
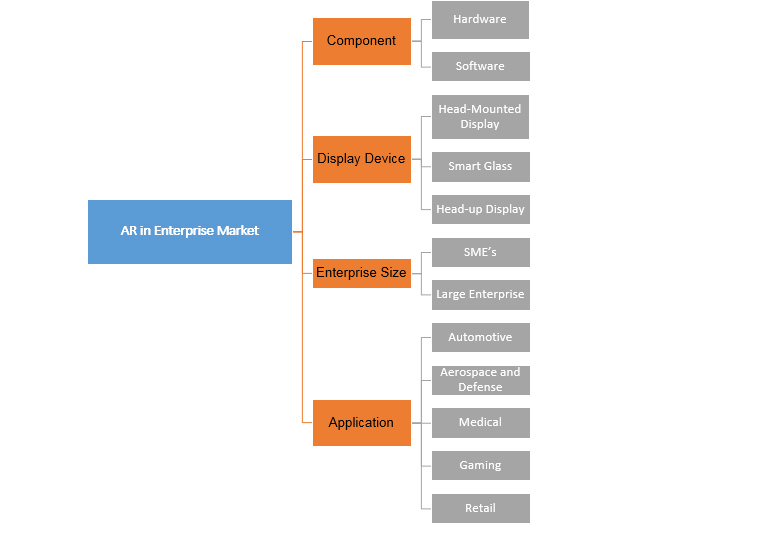
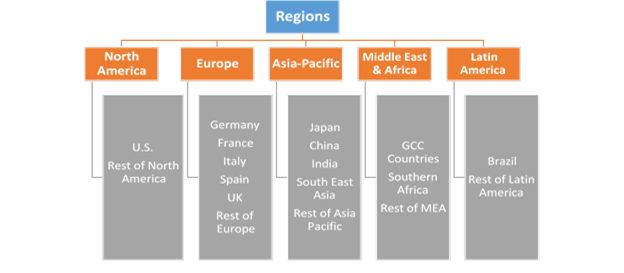
Augmented reality (AR) in Enterprise Market by Component (Hardware, Software); by Display Device (Head-Mounted Display, Smart Glass and Head-up Display); by Enterprise (SME’s, Large Enterprise); by Application (Automotive, Aerospace and Defense, Medical, Gaming, Retail); by Regional outlook (U.S., Rest of North America, France, UK, Germany, Spain, Italy, Rest of Europe, China, Japan, India, Southeast Asia, Rest of Asia Pacific, GCC Countries, Southern Africa, Rest of MEA, Brazil, Rest of Latin America) – Global Insights, Industry Trends, Price Trends, Growth, Size, Supply, Demand, Comparative Analysis, Competitive Market Share and Forecast, 2018-2026
Industry Trends
Augmented reality is an enhanced version of reality where live or indirect views of physical real-world environments are augmented with superimposed computer-generated images. Augmented reality leverages the latest innovations in big data analytics, mobile technology and the internet to offer new upgraded communication channels for enterprises. The global augmented reality (AR) in enterprise market was valued at US$ 1,089.59 Mn in 2017 and is expected to reach US$ 8,742.02 Mn by 2022. Organizations of all sizes have recognized the potential of these rapidly expanding communication channel to visualize data and instructions, covering digital assets in the real world in real time.
AR in Enterprise Market, By Enterprise Size, 2018-2026 (USD Million)
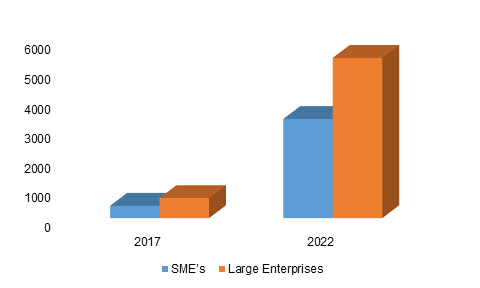
Large enterprises are quickly realizing the possible impact of Augmented reality (AR) technology as this enables their customers to have an ‘anywhere experience’. This characteristic is not only attractive but also helps customers to have a long-lasting experience. Thus, AR approach is ensuring greater customer attachment and trust in products, increasing the likelihood of a purchase.
AR in Enterprise Market, by Enterprise Size
The enterprise size segment of augmented reality (AR) in enterprise market is bifurcated into SME’s and large enterprise, wherein large enterprise is currently dominating the market. Large investments and ongoing projects are the key reason for large enterprises to penetrate maximum into the market. Among large enterprises sectors such as automotive and retail hold a prominent customer base, as the technology is less time consuming and provides more accurate and reliable data to their customers. Instructional AR is also promising commercially, with multi-sensory learning which are valuable in transmitting information. Thus, a variety of industries will adopt AR instructional methods for better-informed and safer workforces in the coming years.
AR in Enterprise Market, by Region
North America currently holds the maximum market share in the global augmented reality (AR) in enterprise market. The region has a high adoption of technically advanced products which is expected to propel the growth of the market globally. In this region, United States has the maximum contribution in terms of revenue due to high awareness of AR technology. The region also has prominent players who are investing on different projects and research & development thus further propelling the market growth. However, Asia Pacific is anticipated to grow in future due to growing consumer business in Asia Pacific. Rising retail spending in countries such as China, India, Vietnam and Malaysia will also further contribute to its growth.
Competitive Market Share
The report provides both, qualitative and quantitative research of the market, as well as integrates worthy insights into the rational scenario and favored development methods adopted by the key contenders. The report also offers extensive research on the key players in this market and detailed insights on the competitiveness of these players. The key business strategies such as M&A, affiliations, collaborations, and contracts adopted by the major players are also recognized and analyzed in the report. For each company, the report recognizes their manufacturing base, competitors, product type, application and specification, pricing, and gross margin.
The Augmented reality (AR) in enterprise market is consolidated since the market has giant players who are generating maximum market share. Some of the primary players of consolidated global AR in enterprise market are Apple Inc., Blippar, CyberGlove Systems LLC, DAQRI LLC, Eon Reality, Inc., Facebook Inc., Google Inc, HTC Corporation, Magic Leap, Inc., Marxent Labs LLC, QUALCOMM, PTC Inc., Microsoft, Rockwell Collins, SAMSUNG, Upskill, Vuzix Corporation and Wikitude GmbH among others.

AR in Enterprise Industry Background
1.
Introduction
1.1. Market Scope
1.2. Market Segmentation
1.3. Methodology
1.4. Assumptions
2.
AR in Enterprise Market Snapshot
3.
Executive Summary: AR in Enterprise Market
4.
Qualitative Analysis: AR in Enterprise Market
4.1. Introduction
4.1.1. Product Definition
4.1.2. Industry Development
4.2. Market Dynamics
4.2.1. Drivers
4.2.2. Restraints
4.2.3. Opportunities
4.3. Trends in Market
4.4. Porter’s Five Force Analysis
5.
Global Augmented Reality (AR) in Enterprise Market
Analysis and Forecasts, 2018 – 2026
5.1. Overview
5.1.1. Global Market Revenue (US$ Mn) and Forecasts
5.2. Global AR in Enterprise Market Revenue (US$ Mn)
and Forecasts, By Component
5.2.1. Hardware
5.2.1.1.
Definition
5.2.1.2.
Market
Penetration
5.2.1.3.
Market Revenue
Expected to Increase by 2026
5.2.1.4.
Compound Annual
Growth Rate (CAGR)
5.2.2. Software
5.2.2.1.
Definition
5.2.2.2.
Market
Penetration
5.2.2.3.
Market Revenue
Expected to Increase by 2026
5.2.2.4.
Compound Annual
Growth Rate (CAGR)
5.3. Key Segment for Channeling Investments
5.3.1. By Component
6.
Global AR in Enterprise Market Analysis and
Forecasts, 2018 – 2026
6.1. Overview
6.2. Global Augmented Reality (AR) in Enterprise
Market Revenue (US$ Mn) and Forecasts, By Display Device
6.2.1. Head-Mounted Display
6.2.1.1.
Definition
6.2.1.2.
Market
Penetration
6.2.1.3.
Market Revenue Expected
to Increase by 2026
6.2.1.4.
Compound Annual
Growth Rate (CAGR)
6.2.2. Smart Glass
6.2.2.1.
Definition
6.2.2.2.
Market
Penetration
6.2.2.3.
Market Revenue
Expected to Increase by 2026
6.2.2.4.
Compound Annual
Growth Rate (CAGR)
6.2.3. Head-up Display
6.2.3.1.
Definition
6.2.3.2.
Market
Penetration
6.2.3.3.
Market Revenue
Expected to Increase by 2026
6.2.3.4.
Compound Annual
Growth Rate (CAGR)
6.3. Key Segment for Channeling Investments
6.3.1. By Display Device
7.
Global AR in Enterprise Market Analysis and
Forecasts, 2018 – 2026
7.1. Overview
7.2. Global Market Revenue (US$ Mn) and Forecasts, By
Enterprise Size
7.2.1. SMEs
7.2.1.1.
Definition
7.2.1.2.
Market
Penetration
7.2.1.3.
Market Revenue
Expected to Increase by 2026
7.2.1.4.
Compound Annual
Growth Rate (CAGR)
7.2.2. Large Enterprise
7.2.2.1.
Definition
7.2.2.2.
Market
Penetration
7.2.2.3.
Market Revenue
Expected to Increase by 2026
7.2.2.4.
Compound Annual
Growth Rate (CAGR)
7.3. Key Segment for Channeling Investments
7.3.1. By Enterprise Size
8.
Global Augmented Reality (AR) in Enterprise
Market Analysis and Forecasts, 2018 – 2026
8.1. Overview
8.2. Global AR in Enterprise Market Revenue (US$ Mn)
and Forecasts, By Application
8.2.1. Automotive
8.2.1.1.
Definition
8.2.1.2.
Market
Penetration
8.2.1.3.
Market Revenue
Expected to Increase by 2026
8.2.1.4.
Compound Annual
Growth Rate (CAGR)
8.2.2. Aerospace and Defense
8.2.2.1.
Definition
8.2.2.2.
Market
Penetration
8.2.2.3.
Market Revenue
Expected to Increase by 2026
8.2.2.4.
Compound Annual
Growth Rate (CAGR)
8.2.3. Medical
8.2.3.1.
Definition
8.2.3.2.
Market
Penetration
8.2.3.3.
Market Revenue
Expected to Increase by 2026
8.2.3.4.
Compound Annual
Growth Rate (CAGR)
8.2.4. Gaming
8.2.4.1.
Definition
8.2.4.2.
Market
Penetration
8.2.4.3.
Market Revenue
Expected to Increase by 2026
8.2.4.4.
Compound Annual
Growth Rate (CAGR)
8.2.5. Retail
8.2.5.1.
Definition
8.2.5.2.
Market
Penetration
8.2.5.3.
Market Revenue
Expected to Increase by 2026
8.2.5.4.
Compound Annual
Growth Rate (CAGR)
8.3. Key Segment for Channeling Investments
8.3.1. By Application
9.
North America Augmented Reality (AR) in
Enterprise Market Analysis and Forecasts, 2018 – 2026
9.1. Overview
9.1.1. North America Market Revenue (US$ Mn)
9.2. North America Market Revenue (US$ Mn) and
Forecasts, By Component
9.2.1. Hardware
9.2.2. Software
9.3. North America Market Revenue (US$ Mn) and
Forecasts, By Display Device
9.3.1. Head-Mounted Display
9.3.2. Smart Glass
9.3.3. Head-up Display
9.4. North America AR in Enterprise Market Revenue
(US$ Mn) and Forecasts, By Enterprise Size
9.4.1. SMEs
9.4.2. Large Enterprise
9.5. North America Market Revenue (US$ Mn) and
Forecasts, By Application
9.5.1. Automotive
9.5.2. Aerospace and Defense
9.5.3. Medical
9.5.4. Gaming
9.5.5. Retail
9.6. North America Market Revenue (US$ Mn) and
Forecasts, By Country
9.6.1. U.S.
9.6.1.1.
U.S. Augmented
Reality (AR) in Enterprise Market Revenue (US$ Mn) and Forecasts, By Component
9.6.1.1.1. Hardware
9.6.1.1.2. Software
9.6.1.2.
U.S. Market
Revenue (US$ Mn) and Forecasts, By Display Device
9.6.1.2.1. Head-Mounted Display
9.6.1.2.2. Smart Glass
9.6.1.2.3. Head-up Display
9.6.1.3.
U.S. Market
Revenue (US$ Mn) and Forecasts, By Enterprise Size
9.6.1.3.1. SMEs
9.6.1.3.2. Large Enterprise
9.6.1.4.
U.S. AR in
Enterprise Market Revenue (US$ Mn) and Forecasts, By Application
9.6.1.4.1. Automotive
9.6.1.4.2. Aerospace and Defense
9.6.1.4.3. Medical
9.6.1.4.4. Gaming
9.6.1.4.5. Retail
9.6.2. Rest of North America
9.6.2.1.
Rest of North
America AR in Enterprise Market Revenue (US$ Mn) and Forecasts, By Component
9.6.2.1.1. Hardware
9.6.2.1.2. Software
9.6.2.2.
Rest of North
America Augmented Reality (AR) in Enterprise Market Revenue (US$ Mn) and
Forecasts, By Display Device
9.6.2.2.1. Head-Mounted Display
9.6.2.2.2. Smart Glass
9.6.2.2.3. Head-up Display
9.6.2.3.
Rest of North
America AR in Enterprise Market Revenue (US$ Mn) and Forecasts, By Enterprise
Size
9.6.2.3.1. SMEs
9.6.2.3.2. Large Enterprise
9.6.2.4.
Rest of North
America Augmented Reality (AR) in Enterprise Market Revenue (US$ Mn) and
Forecasts, By Application
9.6.2.4.1. Automotive
9.6.2.4.2. Aerospace and Defense
9.6.2.4.3. Medical
9.6.2.4.4. Gaming
9.6.2.4.5. Retail
9.7. Key Segment for Channeling Investments
9.7.1. By Country
9.7.2. By Component
9.7.3. By Display Device
9.7.4. By Enterprise Size
9.7.5. By Application
10. Europe AR in
Enterprise Market Analysis and Forecasts, 2018 – 2026
10.1. Overview
10.1.1. Europe Market Revenue (US$ Mn)
10.2. Europe Augmented Reality (AR) in Enterprise Market
Revenue (US$ Mn) and Forecasts, By Component
10.2.1. Hardware
10.2.2. Software
10.3. Europe Market Revenue (US$ Mn) and Forecasts, By
Display Device
10.3.1. Head-Mounted Display
10.3.2. Smart Glass
10.3.3. Head-up Display
10.4. Europe AR in Enterprise Market Revenue (US$ Mn)
and Forecasts, By Enterprise Size
10.4.1. SMEs
10.4.2. Large Enterprise
10.5. Europe Augmented Reality (AR) in Enterprise
Market Revenue (US$ Mn) and Forecasts, By Application
10.5.1. Automotive
10.5.2. Aerospace and Defense
10.5.3. Medical
10.5.4. Gaming
10.5.5. Retail
10.6. Europe AR in Enterprise Market Revenue (US$ Mn)
and Forecasts, By Country
10.6.1. France
10.6.1.1.
France AR in
Enterprise Market Revenue (US$ Mn) and Forecasts, By Component
10.6.1.1.1. Hardware
10.6.1.1.2. Software
10.6.1.2.
France Market
Revenue (US$ Mn) and Forecasts, By Display Device
10.6.1.2.1. Head-Mounted Display
10.6.1.2.2. Smart Glass
10.6.1.2.3. Head-up Display
10.6.1.3.
France Augmented
Reality (AR) in Enterprise Market Revenue (US$ Mn) and Forecasts, By Enterprise
Size
10.6.1.3.1. SMEs
10.6.1.3.2. Large Enterprise
10.6.1.4.
France Market
Revenue (US$ Mn) and Forecasts, By Application
10.6.1.4.1. Automotive
10.6.1.4.2. Aerospace and Defense
10.6.1.4.3. Medical
10.6.1.4.4. Gaming
10.6.1.4.5. Retail
10.6.2. The UK
10.6.2.1.
The UK AR in Enterprise
Market Revenue (US$ Mn) and Forecasts, By Component
10.6.2.1.1. Hardware
10.6.2.1.2. Software
10.6.2.2.
The UK Market
Revenue (US$ Mn) and Forecasts, By Display Device
10.6.2.2.1. Head-Mounted Display
10.6.2.2.2. Smart Glass
10.6.2.2.3. Head-up Display
10.6.2.3.
The UK Market
Revenue (US$ Mn) and Forecasts, By Enterprise Size
10.6.2.3.1. SMEs
10.6.2.3.2. Large Enterprise
10.6.2.4.
The UK Augmented
Reality (AR) in Enterprise Market Revenue (US$ Mn) and Forecasts, By
Application
10.6.2.4.1. Automotive
10.6.2.4.2. Aerospace and Defense
10.6.2.4.3. Medical
10.6.2.4.4. Gaming
10.6.2.4.5. Retail
10.6.3. Spain
10.6.3.1.
Spain Market
Revenue (US$ Mn) and Forecasts, By Component
10.6.3.1.1. Hardware
10.6.3.1.2. Software
10.6.3.2.
Spain Market
Revenue (US$ Mn) and Forecasts, By Display Device
10.6.3.2.1. Head-Mounted Display
10.6.3.2.2. Smart Glass
10.6.3.2.3. Head-up Display
10.6.3.3.
Spain AR in
Enterprise Market Revenue (US$ Mn) and Forecasts, By Enterprise Size
10.6.3.3.1. SMEs
10.6.3.3.2. Large Enterprise
10.6.3.4.
Spain Market
Revenue (US$ Mn) and Forecasts, By Application
10.6.3.4.1. Automotive
10.6.3.4.2. Aerospace and Defense
10.6.3.4.3. Medical
10.6.3.4.4. Gaming
10.6.3.4.5. Retail
10.6.4. Germany
10.6.4.1.
Germany AR in
Enterprise Market Revenue (US$ Mn) and Forecasts, By Component
10.6.4.1.1. Hardware
10.6.4.1.2. Software
10.6.4.2.
Germany Market
Revenue (US$ Mn) and Forecasts, By Display Device
10.6.4.2.1. Head-Mounted Display
10.6.4.2.2. Smart Glass
10.6.4.2.3. Head-up Display
10.6.4.3.
Germany Market
Revenue (US$ Mn) and Forecasts, By Enterprise Size
10.6.4.3.1. SMEs
10.6.4.3.2. Large Enterprise
10.6.4.4.
Germany Market
Revenue (US$ Mn) and Forecasts, By Application
10.6.4.4.1. Automotive
10.6.4.4.2. Aerospace and Defense
10.6.4.4.3. Medical
10.6.4.4.4. Gaming
10.6.4.4.5. Retail
10.6.5. Italy
10.6.5.1.
Italy Augmented
Reality (AR) in Enterprise Market Revenue (US$ Mn) and Forecasts, By Component
10.6.5.1.1. Hardware
10.6.5.1.2. Software
10.6.5.2.
Italy Market
Revenue (US$ Mn) and Forecasts, By Display Device
10.6.5.2.1. Head-Mounted Display
10.6.5.2.2. Smart Glass
10.6.5.2.3. Head-up Display
10.6.5.3.
Italy Market
Revenue (US$ Mn) and Forecasts, By Enterprise Size
10.6.5.3.1. SMEs
10.6.5.3.2. Large Enterprise
10.6.5.4.
Italy Market
Revenue (US$ Mn) and Forecasts, By Application
10.6.5.4.1. Automotive
10.6.5.4.2. Aerospace and Defense
10.6.5.4.3. Medical
10.6.5.4.4. Gaming
10.6.5.4.5. Retail
10.6.6. Rest of Europe
10.6.6.1.
Rest of Europe
Market Revenue (US$ Mn) and Forecasts, By Component
10.6.6.1.1. Hardware
10.6.6.1.2. Software
10.6.6.2.
Rest of Europe AR
in Enterprise Market Revenue (US$ Mn) and Forecasts, By Display Device
10.6.6.2.1. Head-Mounted Display
10.6.6.2.2. Smart Glass
10.6.6.2.3. Head-up Display
10.6.6.3.
Rest of Europe
Market Revenue (US$ Mn) and Forecasts, By Enterprise Size
10.6.6.3.1. SMEs
10.6.6.3.2. Large Enterprise
10.6.6.4.
Rest of Europe Augmented
Reality (AR) in Enterprise Market Revenue (US$ Mn) and Forecasts, By
Application
10.6.6.4.1. Automotive
10.6.6.4.2. Aerospace and Defense
10.6.6.4.3. Medical
10.6.6.4.4. Gaming
10.6.6.4.5. Retail
10.7. Key Segment for Channeling Investments
10.7.1. By Country
10.7.2. By Component
10.7.3. By Display Device
10.7.4. By Enterprise Size
10.7.5. By Application
11. Asia
Pacific AR in Enterprise Market Analysis
and Forecasts, 2018 – 2026
11.1. Overview
11.1.1. Asia Pacific Market Revenue (US$ Mn)
11.2. Asia Pacific AR in Enterprise Market Revenue
(US$ Mn) and Forecasts, By Component
11.2.1. Hardware
11.2.2. Software
11.3. Asia Pacific Market Revenue (US$ Mn) and
Forecasts, By Display Device
11.3.1. Head-Mounted Display
11.3.2. Smart Glass
11.3.3. Head-up Display
11.4. Asia Pacific AR in Enterprise Market Revenue
(US$ Mn) and Forecasts, By Enterprise Size
11.4.1. SMEs
11.4.2. Large Enterprise
11.5. Asia Pacific Market Revenue (US$ Mn) and Forecasts,
By Application
11.5.1. Automotive
11.5.2. Aerospace and Defense
11.5.3. Medical
11.5.4. Gaming
11.5.5. Retail
11.6. Asia Pacific AR in Enterprise Market Revenue
(US$ Mn) and Forecasts, By Country
11.6.1. China
11.6.1.1.
China AR in
Enterprise Market Revenue (US$ Mn) and Forecasts, By Component
11.6.1.1.1. Hardware
11.6.1.1.2. Software
11.6.1.2.
China Market
Revenue (US$ Mn) and Forecasts, By Display Device
11.6.1.2.1. Head-Mounted Display
11.6.1.2.2. Smart Glass
11.6.1.2.3. Head-up Display
11.6.1.3.
China AR in
Enterprise Market Revenue (US$ Mn) and Forecasts, By Enterprise Size
11.6.1.3.1. SMEs
11.6.1.3.2. Large Enterprise
11.6.1.4.
China Market
Revenue (US$ Mn) and Forecasts, By Application
11.6.1.4.1. Automotive
11.6.1.4.2. Aerospace and Defense
11.6.1.4.3. Medical
11.6.1.4.4. Gaming
11.6.1.4.5. Retail
11.6.2. Japan
11.6.2.1.
Japan AR in
Enterprise Market Revenue (US$ Mn) and Forecasts, By Component
11.6.2.1.1. Hardware
11.6.2.1.2. Software
11.6.2.2.
Japan Market
Revenue (US$ Mn) and Forecasts, By Display Device
11.6.2.2.1. Head-Mounted Display
11.6.2.2.2. Smart Glass
11.6.2.2.3. Head-up Display
11.6.2.3.
Japan Market
Revenue (US$ Mn) and Forecasts, By Enterprise Size
11.6.2.3.1. SMEs
11.6.2.3.2. Large Enterprise
11.6.2.4.
Japan AR in
Enterprise Market Revenue (US$ Mn) and Forecasts, By Application
11.6.2.4.1. Automotive
11.6.2.4.2. Aerospace and Defense
11.6.2.4.3. Medical
11.6.2.4.4. Gaming
11.6.2.4.5. Retail
11.6.3. India
11.6.3.1.
India AR in
Enterprise Market Revenue (US$ Mn) and Forecasts, By Component
11.6.3.1.1. Hardware
11.6.3.1.2. Software
11.6.3.2.
India Market
Revenue (US$ Mn) and Forecasts, By Display Device
11.6.3.2.1. Head-Mounted Display
11.6.3.2.2. Smart Glass
11.6.3.2.3. Head-up Display
11.6.3.3.
India Market
Revenue (US$ Mn) and Forecasts, By Enterprise Size
11.6.3.3.1. SMEs
11.6.3.3.2. Large Enterprise
11.6.3.4.
India Market
Revenue (US$ Mn) and Forecasts, By Application
11.6.3.4.1. Automotive
11.6.3.4.2. Aerospace and Defense
11.6.3.4.3. Medical
11.6.3.4.4. Gaming
11.6.3.4.5. Retail
11.6.4. Southeast Asia
11.6.4.1.
Southeast Asia AR
in Enterprise Market Revenue (US$ Mn) and Forecasts, By Component
11.6.4.1.1. Hardware
11.6.4.1.2. Software
11.6.4.2.
Southeast Asia
Market Revenue (US$ Mn) and Forecasts, By Display Device
11.6.4.2.1. Head-Mounted Display
11.6.4.2.2. Smart Glass
11.6.4.2.3. Head-up Display
11.6.4.3.
Southeast Asia
Market Revenue (US$ Mn) and Forecasts, By Enterprise Size
11.6.4.3.1. SMEs
11.6.4.3.2. Large Enterprise
11.6.4.4.
Southeast Asia
Market Revenue (US$ Mn) and Forecasts, By Application
11.6.4.4.1. Automotive
11.6.4.4.2. Aerospace and Defense
11.6.4.4.3. Medical
11.6.4.4.4. Gaming
11.6.4.4.5. Retail
11.6.5. Rest of Asia Pacific
11.6.5.1.
Rest of Asia
Pacific AR in Enterprise Market Revenue (US$ Mn) and Forecasts, By Component
11.6.5.1.1. Hardware
11.6.5.1.2. Software
11.6.5.2.
Rest of Asia Pacific
Market Revenue (US$ Mn) and Forecasts, By Display Device
11.6.5.2.1. Head-Mounted Display
11.6.5.2.2. Smart Glass
11.6.5.2.3. Head-up Display
11.6.5.3.
Rest of Asia
Pacific Market Revenue (US$ Mn) and Forecasts, By Enterprise Size
11.6.5.3.1. SMEs
11.6.5.3.2. Large Enterprise
11.6.5.4.
Rest of Asia
Pacific AR in Enterprise Market Revenue (US$ Mn) and Forecasts, By Application
11.6.5.4.1. Automotive
11.6.5.4.2. Aerospace and Defense
11.6.5.4.3. Medical
11.6.5.4.4. Gaming
11.6.5.4.5. Retail
11.7. Key Segment for Channeling Investments
11.7.1. By Country
11.7.2. By Component
11.7.3. By Display Device
11.7.4. By Enterprise Size
11.7.5. By Application
12. Middle East
and Africa AR in Enterprise Market
Analysis and Forecasts, 2018 – 2026
12.1. Overview
12.1.1. Middle East and Africa Market Revenue (US$ Mn)
12.2. Middle East and Africa AR in Enterprise Market
Revenue (US$ Mn) and Forecasts, By Component
12.2.1. Hardware
12.2.2. Software
12.3. Middle East and Africa Market Revenue (US$ Mn)
and Forecasts, By Display Device
12.3.1. Head-Mounted Display
12.3.2. Smart Glass
12.3.3. Head-up Display
12.4. Middle East and Africa AR in Enterprise Market
Revenue (US$ Mn) and Forecasts, By Enterprise Size
12.4.1. SMEs
12.4.2. Large Enterprise
12.5. Middle East and Africa Market Revenue (US$ Mn)
and Forecasts, By Application
12.5.1. Automotive
12.5.2. Aerospace and Defense
12.5.3. Medical
12.5.4. Gaming
12.5.5. Retail
12.6. Middle East and Africa AR in Enterprise Market
Revenue (US$ Mn) and Forecasts, By Country
12.6.1. GCC Countries
12.6.1.1.
GCC Countries AR
in Enterprise Market Revenue (US$ Mn) and Forecasts, By Component
12.6.1.1.1. Hardware
12.6.1.1.2. Software
12.6.1.2.
GCC Countries
Market Revenue (US$ Mn) and Forecasts, By Display Device
12.6.1.2.1. Head-Mounted Display
12.6.1.2.2. Smart Glass
12.6.1.2.3. Head-up Display
12.6.1.3.
GCC Countries AR
in Enterprise Market Revenue (US$ Mn) and Forecasts, By Enterprise Size
12.6.1.3.1. SMEs
12.6.1.3.2. Large Enterprise
12.6.1.4.
GCC Countries AR
in Enterprise Market Revenue (US$ Mn) and Forecasts, By Application
12.6.1.4.1. Automotive
12.6.1.4.2. Aerospace and Defense
12.6.1.4.3. Medical
12.6.1.4.4. Gaming
12.6.1.4.5. Retail
12.6.2. Southern Africa
12.6.2.1.
Southern Africa
AR in Enterprise Market Revenue (US$ Mn) and Forecasts, By Component
12.6.2.1.1. Hardware
12.6.2.1.2. Software
12.6.2.2.
Southern Africa
Market Revenue (US$ Mn) and Forecasts, By Display Device
12.6.2.2.1. Head-Mounted Display
12.6.2.2.2. Smart Glass
12.6.2.2.3. Head-up Display
12.6.2.3.
Southern Africa
Market Revenue (US$ Mn) and Forecasts, By Enterprise Size
12.6.2.3.1. SMEs
12.6.2.3.2. Large Enterprise
12.6.2.4.
Southern Africa
AR in Enterprise Market Revenue (US$ Mn) and Forecasts, By Application
12.6.2.4.1. Automotive
12.6.2.4.2. Aerospace and Defense
12.6.2.4.3. Medical
12.6.2.4.4. Gaming
12.6.2.4.5. Retail
12.6.3. Rest of MEA
12.6.3.1.
Rest of MEA
Market Revenue (US$ Mn) and Forecasts, By Component
12.6.3.1.1. Hardware
12.6.3.1.2. Software
12.6.3.2.
Rest of MEA AR in
Enterprise Market Revenue (US$ Mn) and Forecasts, By Display Device
12.6.3.2.1. Head-Mounted Display
12.6.3.2.2. Smart Glass
12.6.3.2.3. Head-up Display
12.6.3.3.
Rest of MEA
Market Revenue (US$ Mn) and Forecasts, By Enterprise Size
12.6.3.3.1. SMEs
12.6.3.3.2. Large Enterprise
12.6.3.4.
Rest of MEA AR in
Enterprise Market Revenue (US$ Mn) and Forecasts, By Application
12.6.3.4.1. Automotive
12.6.3.4.2. Aerospace and Defense
12.6.3.4.3. Medical
12.6.3.4.4. Gaming
12.6.3.4.5. Retail
12.7. Key Segment for Channeling Investments
12.7.1. By Country
12.7.2. By Component
12.7.3. By Display Device
12.7.4. By Enterprise Size
12.7.5. By Application
13. Latin
America AR in Enterprise Market Analysis and Forecasts, 2018 – 2026
13.1. Overview
13.1.1. Latin America AR in Enterprise Market Revenue
(US$ Mn)
13.2. Latin America AR in Enterprise Market Revenue
(US$ Mn) and Forecasts, By Component
13.2.1. Hardware
13.2.2. Software
13.3. Latin America Market Revenue (US$ Mn) and
Forecasts, By Display Device
13.3.1. Head-Mounted Display
13.3.2. Smart Glass
13.3.3. Head-up Display
13.4. Latin America AR in Enterprise Market Revenue
(US$ Mn) and Forecasts, By Enterprise Size
13.4.1. SMEs
13.4.2. Large Enterprise
13.5. Latin America Market Revenue (US$ Mn) and
Forecasts, By Application
13.5.1. Automotive
13.5.2. Aerospace and Defense
13.5.3. Medical
13.5.4. Gaming
13.5.5. Retail
13.6. Latin America AR in Enterprise Market Revenue
(US$ Mn) and Forecasts, By Country
13.6.1. Brazil
13.6.1.1.
Brazil AR in
Enterprise Market Revenue (US$ Mn) and Forecasts, By Component
13.6.1.1.1. Hardware
13.6.1.1.2. Software
13.6.1.2.
Brazil Market
Revenue (US$ Mn) and Forecasts, By Display Device
13.6.1.2.1. Head-Mounted Display
13.6.1.2.2. Smart Glass
13.6.1.2.3. Head-up Display
13.6.1.3.
Brazil AR in
Enterprise Market Revenue (US$ Mn) and Forecasts, By Enterprise Size
13.6.1.3.1. SMEs
13.6.1.3.2. Large Enterprise
13.6.1.4.
Brazil Market
Revenue (US$ Mn) and Forecasts, By Application
13.6.1.4.1. Automotive
13.6.1.4.2. Aerospace and Defense
13.6.1.4.3. Medical
13.6.1.4.4. Gaming
13.6.1.4.5. Retail
13.6.2. Rest of Latin America
13.6.2.1.
Rest of Latin
America AR in Enterprise Market Revenue (US$ Mn) and Forecasts, By Component
13.6.2.1.1. Hardware
13.6.2.1.2. Software
13.6.2.2.
Rest of Latin
America Market Revenue (US$ Mn) and Forecasts, By Display Device
13.6.2.2.1. Head-Mounted Display
13.6.2.2.2. Smart Glass
13.6.2.2.3. Head-up Display
13.6.2.3.
Rest of Latin
America AR in Enterprise Market Revenue (US$ Mn) and Forecasts, By Enterprise
Size
13.6.2.3.1. SMEs
13.6.2.3.2. Large Enterprise
13.6.2.4.
Rest of Latin
America Market Revenue (US$ Mn) and Forecasts, By Application
13.6.2.4.1. Automotive
13.6.2.4.2. Aerospace and Defense
13.6.2.4.3. Medical
13.6.2.4.4. Gaming
13.6.2.4.5. Retail
13.7. Key Segment for Channeling Investments
13.7.1. By Country
13.7.2. By Component
13.7.3. By Display Device
13.7.4. By Enterprise Size
13.7.5. By Application
14. Competitive
Benchmarking
14.1. Player Positioning Analysis
14.2. Global Presence and Growth Strategies
15. Player
Profiles
15.1. Apple Inc.
15.1.1. Company Details
15.1.2. Company Overview
15.1.3. Product Offerings
15.1.4. Key Developments
15.1.5. Financial Analysis
15.1.6. SWOT Analysis
15.1.7. Business Strategies
15.2. Blippar
15.2.1. Company Details
15.2.2. Company Overview
15.2.3. Product Offerings
15.2.4. Key Developments
15.2.5. Financial Analysis
15.2.6. SWOT Analysis
15.2.7. Business Strategies
15.3. CyberGlove Systems LLC
15.3.1. Company Details
15.3.2. Company Overview
15.3.3. Product Offerings
15.3.4. Key Developments
15.3.5. Financial Analysis
15.3.6. SWOT Analysis
15.3.7. Business Strategies
15.4. DAQRI LLC
15.4.1. Company Details
15.4.2. Company Overview
15.4.3. Product Offerings
15.4.4. Key Developments
15.4.5. Financial Analysis
15.4.6. SWOT Analysis
15.4.7. Business Strategies
15.5. Eon Reality, Inc.
15.5.1. Company Details
15.5.2. Company Overview
15.5.3. Product Offerings
15.5.4. Key Developments
15.5.5. Financial Analysis
15.5.6. SWOT Analysis
15.5.7. Business Strategies
15.6. Facebook Inc.
15.6.1. Company Details
15.6.2. Company Overview
15.6.3. Product Offerings
15.6.4. Key Developments
15.6.5. Financial Analysis
15.6.6. SWOT Analysis
15.6.7. Business Strategies
15.7. Google Inc.
15.7.1. Company Details
15.7.2. Company Overview
15.7.3. Product Offerings
15.7.4. Key Developments
15.7.5. Financial Analysis
15.7.6. SWOT Analysis
15.7.7. Business Strategies
15.8. HTC Corporation
15.8.1. Company Details
15.8.2. Company Overview
15.8.3. Product Offerings
15.8.4. Key Developments
15.8.5. Financial Analysis
15.8.6. SWOT Analysis
15.8.7. Business Strategies
15.9. Magic Leap, Inc.
15.9.1. Company Details
15.9.2. Company Overview
15.9.3. Product Offerings
15.9.4. Key Developments
15.9.5. Financial Analysis
15.9.6. SWOT Analysis
15.9.7. Business Strategies
15.10. Marxent Labs LLC
15.10.1. Company Details
15.10.2. Company Overview
15.10.3. Product Offerings
15.10.4. Key Developments
15.10.5. Financial Analysis
15.10.6. SWOT Analysis
15.10.7. Business Strategies
15.11. Microsoft
15.11.1. Company Details
15.11.2. Company Overview
15.11.3. Product Offerings
15.11.4. Key Developments
15.11.5. Financial Analysis
15.11.6. SWOT Analysis
15.11.7. Business Strategies
15.12. PTC Inc.
15.12.1. Company Details
15.12.2. Company Overview
15.12.3. Product Offerings
15.12.4. Key Developments
15.12.5. Financial Analysis
15.12.6. SWOT Analysis
15.12.7. Business Strategies
15.13. QUALCOMM
15.13.1. Company Details
15.13.2. Company Overview
15.13.3. Product Offerings
15.13.4. Key Developments
15.13.5. Financial Analysis
15.13.6. SWOT Analysis
15.13.7. Business Strategies
15.14. Rockwell Collins
15.14.1. Company Details
15.14.2. Company Overview
15.14.3. Product Offerings
15.14.4. Key Developments
15.14.5. Financial Analysis
15.14.6. SWOT Analysis
15.14.7. Business Strategies
15.15. SAMSUNG
15.15.1. Company Details
15.15.2. Company Overview
15.15.3. Product Offerings
15.15.4. Key Developments
15.15.5. Financial Analysis
15.15.6. SWOT Analysis
15.15.7. Business Strategies
15.16. Upskill
15.16.1. Company Details
15.16.2. Company Overview
15.16.3. Product Offerings
15.16.4. Key Developments
15.16.5. Financial Analysis
15.16.6. SWOT Analysis
15.16.7. Business Strategies
15.17. Vuzix Corporation
15.17.1. Company Details
15.17.2. Company Overview
15.17.3. Product Offerings
15.17.4. Key Developments
15.17.5. Financial Analysis
15.17.6. SWOT Analysis
15.17.7. Business Strategies
15.18. Wikitude GmbH
15.18.1. Company Details
15.18.2. Company Overview
15.18.3. Product Offerings
15.18.4. Key Developments
15.18.5. Financial Analysis
15.18.6. SWOT Analysis
15.18.7. Business Strategies
At Absolute Markets Insights, we are engaged in building both global as well as country specific reports. As a result, the approach taken for deriving the estimation and forecast for a specific country is a bit unique and different in comparison to the global research studies. In this case, we not only study the concerned market factors & trends prevailing in a particular country (from secondary research) but we also tend to calculate the actual market size & forecast from the revenue generated from the market participants involved in manufacturing or distributing the any concerned product. These companies can also be service providers. For analyzing any country specifically, we do consider the growth factors prevailing under the states/cities/county for the same. For instance, if we are analyzing an industry specific to United States, we primarily need to study about the states present under the same(where the product/service has the highest growth). Similar analysis will be followed by other countries. Our scope of the report changes with different markets.
Our research study is mainly implement through a mix of both secondary and primary research. Various sources such as industry magazines, trade journals, and government websites and trade associations are reviewed for gathering precise data. Primary interviews are conducted to validate the market size derived from secondary research. Industry experts, major manufacturers and distributors are contacted for further validation purpose on the current market penetration and growth trends.
Prominent participants in our primary research process include:
- Key Opinion Leaders namely the CEOs, CSOs, VPs, purchasing managers, amongst others
- Research and development participants, distributors/suppliers and subject matter experts
Secondary Research includes data extracted from paid data sources:
- Reuters
- Factiva
- Bloomberg
- One Source
- Hoovers
Research Methodology

Key Inclusions


