
Global B2B Price Optimization and Management Software Market By Deployment (Cloud Based, On Premise); By Application (Small and Medium Enterprises, Large Enterprises); By Industry Verticals (Airlines and Travel, Chemical, Consumer Goods, Energy, Financial Services, Food and Beverages, Manufacturing, Telecommunication, Wholesale and Distribution); By Region (U.S., Canada, Mexico, Rest of North America, France, UK, Germany, Spain, Italy, Nordic Countries, Benelux Union, Rest of Europe, China, Japan, India, New Zealand, Australia, South Korea, Southeast Asia, Rest of Asia Pacific, Saudi Arabia, UAE, Egypt, Kuwait, South Africa, Rest of MEA, Brazil, Argentina, Rest of Latin America) – Global Insights, Growth, Size, Comparative Analysis, Trends and Forecast, 2019 – 2027
Industry Trends
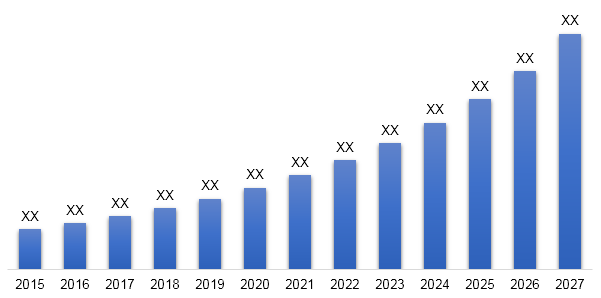
Global B2B price optimization and management software market was valued at US$ 291.56 Mn in 2018 and is anticipated to reach US$ 1,135.40 Mn by 2027, expanding at a CAGR of 16.4% from 2019 to 2027. Price if the product is one of the deciding factors which also helps in determining the consumer demand and competitive positioning of the brand. So it becomes important that the price of the product is aligned with the overall business strategy. Price Optimization is maintaining balance between product valuation and return on investment. Price optimization software helps in analyzing the changing product demand after a cost modification. The software combines data with the information and recommends the price that will generate profits. It helps in deciding the competitors affecting the demand by region, category and product and also helps in determining the factors influencing the consumers buying decision. Comparatively, cloud based products would gain a faster adoption owing to various benefits such as cost effectiveness, scalability and others. High cost of installation, necessity of IT professional team for maintenance, installation, upgrades and fixing are some of the drawbacks of on-premise deployment.
The growth of online B2B commerce is one of the factors which is driving the B2B price optimization and management software market. Increasing penetration of internet and rapid rise in digitization has led to the transformation in all industrial verticals. The rising practice amongst enterprises to use online platform for their business operations and for offering their products has been fuelling the ecommerce sector. The necessity of determining the price of the product such that it maintains a balance between value and profit is driving the price optimization software market. This need of price optimization among the enterprises conducting business through an online platform is leading to rise in demand for the software. The airlines and travel from the industry verticals segment holds largest market share in B2B Price Optimization Software Market. The Airlines sector is going through fundamental changes. Pricing and revenue generation from tickets has been shifted to other revenue generating streams like premium seat selection, onboard food and extra legroom. The use of price optimization software aids in determining the right costing of the services provided by the airline companies. Proper optimization of cost of the services is helping companies to focus on target customers.
Global B2B Price Optimization and Management Software Market Revenue & Forecast, (US$ Billion), 2015 – 2027
Competitive Landscape
The report provides both, qualitative and quantitative research on B2B Price Optimization and Management Software Market, as well as provides comprehensive insights and favored development methods adopted by the key contenders. The report also offers extensive research on the key players in this market and details on the competitiveness of these players. Key business strategies such as mergers and acquisitions (M&A), affiliations, collaborations, and contracts adopted by these major market participants are also recognized and analyzed in the report. For each company, the report studies their global presence, competitors, service offerings and specifications.
The primary market participants in B2B price optimization and management software market include Apttus Corporation, BlackCurve Solutions Limited, COMPETERA LIMITED, Flintfox International Limited, Vendavo, Inc., Perfect Price, Inc., Periscope (McKinsey and Company) Pricefx, SPOSEA B.V., Syncron AB, Vistaar Technologies, Inc., Zilliant. amongst several others.

Global B2B Price Optimization and Management Software Market:
- By Deployment
- Cloud Based
- On Premise
- By Application
- Small and Medium Enterprises
- Large Enterprises
- By Industry Verticals
- Airlines and Travel
- Chemical
- Consumer Goods
- Energy
- Financial Services
- Food and Beverages
- Manufacturing
- Telecommunication
- Wholesale and Distribution
- By Region
- North America
- U.S.
- Canada
- Mexico
- Europe
- France
- The UK
- Spain
- Germany
- Italy
- Nordic Countries
- Denmark
- Finland
- Iceland
- Sweden
- Norway
- Benelux Union
- Belgium
- The Netherlands
- Luxembourg
- Rest of Europe
- Asia Pacific
- China
- Japan
- India
- New Zealand
- Australia
- South Korea
- Southeast Asia
- Indonesia
- Thailand
- Malaysia
- Singapore
- Rest of South Asia
- Rest of Asia Pacific
- Middle East and Africa
- Saudi Arabia
- UAE
- Egypt
- Kuwait
- South Africa
- Rest of Middle East & Africa
- Latin America
- Brazil
- Argentina
- Rest of Latin America
- North America
Table of Contents
1. Market Scope
1.1. Market
Segmentation
1.2. Years
Considered
1.2.1. Historic
Years: 2015 - 2017
1.2.2. Base Year:
2018
1.2.3. Forecast
Years: 2019 – 2027
2. Key Target
Audiences
3. Research
Methodology
3.1. Primary
Research
3.1.1. Research
Questionnaire
3.1.2. Global
Percentage Breakdown
3.1.3. Primary
Interviews: Key Opinion Leaders (KOLs)
3.2. Secondary
Research
3.2.1. Paid Databases
3.2.2. Secondary
Sources
3.3. Market Size
Estimates
3.3.1. Top-Down
Approach
3.3.2. Bottom-Up
Approach
3.4. Data
Triangulation Methodology
3.5. Research
Assumptions
4. Recommendations
and Insights from AMI’s Perspective**
5. Holistic
Overview of B2B Price Optimization and Management Software Market
6. Market
Synopsis: B2B Price Optimization and
Management Software Market
7. B2B Price
Optimization and Management Software Market Analysis: Qualitative Perspective
7.1. Introduction
7.1.1. Product
Definition
7.1.2. Industry
Development
7.2. Market
Dynamics
7.2.1. Drivers
7.2.2. Restraints
7.2.3. Opportunities
7.3. Trends in B2B
Price Optimization and Management Software Market
7.4. Market
Determinants Radar Chart
7.5. Macro-Economic
and Micro-Economic Indicators: B2B Price Optimization and Management Software
Market
7.6. Porter’s Five
Force Analysis
8. Global B2B
Price Optimization and Management Software Market Analysis and Forecasts, 2019
– 2027
8.1. Overview
8.1.1. Global B2B
Price Optimization and Management Software Market Revenue (US$ Mn)
8.2. Global B2B
Price Optimization and Management Software Market Revenue (US$ Mn) and
Forecasts, By Deployment
8.2.1. Cloud Based
8.2.1.1.
Definition
8.2.1.2.
Market Estimation and Penetration, 2015 – 2018
8.2.1.3.
Market Forecast, 2019 – 2027
8.2.1.4.
Compound Annual Growth Rate (CAGR)
8.2.1.5.
Regional Bifurcation
8.2.1.5.1.
North America
8.2.1.5.1.1.
Market Estimation, 2015 – 2018
8.2.1.5.1.2.
Market Forecast, 2019 – 2027
8.2.1.5.2.
Europe
8.2.1.5.2.1.
Market Estimation, 2015 – 2018
8.2.1.5.2.2.
Market Forecast, 2019 – 2027
8.2.1.5.3.
Asia Pacific
8.2.1.5.3.1.
Market Estimation, 2015 – 2018
8.2.1.5.3.2.
Market Forecast, 2019 – 2027
8.2.1.5.4.
Middle East and Africa
8.2.1.5.4.1.
Market Estimation, 2015 – 2018
8.2.1.5.4.2.
Market Forecast, 2019 – 2027
8.2.1.5.5.
Latin America
8.2.1.5.5.1.
Market Estimation, 2015 – 2018
8.2.1.5.5.2.
Market Forecast, 2019 – 2027
8.2.2. On Premise
8.2.2.1.
Definition
8.2.2.2.
Market Estimation and Penetration, 2015 – 2018
8.2.2.3.
Market Forecast, 2019 – 2027
8.2.2.4.
Compound Annual Growth Rate (CAGR)
8.2.2.5.
Regional Bifurcation
8.2.2.5.1.
North America
8.2.2.5.1.1.
Market Estimation, 2015 – 2018
8.2.2.5.1.2.
Market Forecast, 2019 – 2027
8.2.2.5.2.
Europe
8.2.2.5.2.1.
Market Estimation, 2015 – 2018
8.2.2.5.2.2.
Market Forecast, 2019 – 2027
8.2.2.5.3.
Asia Pacific
8.2.2.5.3.1.
Market Estimation, 2015 – 2018
8.2.2.5.3.2.
Market Forecast, 2019 – 2027
8.2.2.5.4.
Middle East and Africa
8.2.2.5.4.1.
Market Estimation, 2015 – 2018
8.2.2.5.4.2.
Market Forecast, 2019 – 2027
8.2.2.5.5.
Latin America
8.2.2.5.5.1.
Market Estimation, 2015 – 2018
8.2.2.5.5.2.
Market Forecast, 2019 – 2027
8.3. Key Segment
for Channeling Investments
8.3.1. By Deployment
9. Global B2B
Price Optimization and Management Software Market Analysis and Forecasts, 2019
– 2027
9.1. Overview
9.2. Global B2B
Price Optimization and Management Software Market Revenue (US$ Mn) and
Forecasts, By Application
9.2.1. Small and
Medium Enterprises
9.2.1.1.
Definition
9.2.1.2.
Market Estimation and Penetration, 2015 – 2018
9.2.1.3.
Market Forecast, 2019 – 2027
9.2.1.4.
Compound Annual Growth Rate (CAGR)
9.2.1.5.
Regional Bifurcation
9.2.1.5.1.
North America
9.2.1.5.1.1.
Market Estimation, 2015 – 2018
9.2.1.5.1.2.
Market Forecast, 2019 – 2027
9.2.1.5.2.
Europe
9.2.1.5.2.1.
Market Estimation, 2015 – 2018
9.2.1.5.2.2.
Market Forecast, 2019 – 2027
9.2.1.5.3.
Asia Pacific
9.2.1.5.3.1.
Market Estimation, 2015 – 2018
9.2.1.5.3.2.
Market Forecast, 2019 – 2027
9.2.1.5.4.
Middle East and Africa
9.2.1.5.4.1.
Market Estimation, 2015 – 2018
9.2.1.5.4.2.
Market Forecast, 2019 – 2027
9.2.1.5.5.
Latin America
9.2.1.5.5.1.
Market Estimation, 2015 – 2018
9.2.1.5.5.2.
Market Forecast, 2019 – 2027
9.2.2. Large
Enterprises
9.2.2.1.
Definition
9.2.2.2.
Market Estimation and Penetration, 2015 – 2018
9.2.2.3.
Market Forecast, 2019 – 2027
9.2.2.4.
Compound Annual Growth Rate (CAGR)
9.2.2.5.
Regional Bifurcation
9.2.2.5.1.
North America
9.2.2.5.1.1.
Market Estimation, 2015 – 2018
9.2.2.5.1.2.
Market Forecast, 2019 – 2027
9.2.2.5.2.
Europe
9.2.2.5.2.1.
Market Estimation, 2015 – 2018
9.2.2.5.2.2.
Market Forecast, 2019 – 2027
9.2.2.5.3.
Asia Pacific
9.2.2.5.3.1.
Market Estimation, 2015 – 2018
9.2.2.5.3.2.
Market Forecast, 2019 – 2027
9.2.2.5.4.
Middle East and Africa
9.2.2.5.4.1.
Market Estimation, 2015 – 2018
9.2.2.5.4.2.
Market Forecast, 2019 – 2027
9.2.2.5.5.
Latin America
9.2.2.5.5.1.
Market Estimation, 2015 – 2018
9.2.2.5.5.2.
Market Forecast, 2019 – 2027
9.3. Key Segment
for Channeling Investments
9.3.1. By Application
10. Global B2B
Price Optimization and Management Software Market Analysis and Forecasts, 2019
– 2027
10.1. Overview
10.2. Global B2B
Price Optimization and Management Software Market Revenue (US$ Mn) and
Forecasts, By Industry Verticals
10.2.1.
Airlines and Travel
10.2.1.1.
Definition
10.2.1.2.
Market Estimation and Penetration, 2015 – 2018
10.2.1.3.
Market Forecast, 2019 – 2027
10.2.1.4.
Compound Annual Growth Rate (CAGR)
10.2.1.5.
Regional Bifurcation
10.2.1.5.1.
North America
10.2.1.5.1.1.
Market Estimation, 2015 – 2018
10.2.1.5.1.2.
Market Forecast, 2019 – 2027
10.2.1.5.2.
Europe
10.2.1.5.2.1.
Market Estimation, 2015 – 2018
10.2.1.5.2.2.
Market Forecast, 2019 – 2027
10.2.1.5.3.
Asia Pacific
10.2.1.5.3.1.
Market Estimation, 2015 – 2018
10.2.1.5.3.2.
Market Forecast, 2019 – 2027
10.2.1.5.4.
Middle East and Africa
10.2.1.5.4.1.
Market Estimation, 2015 – 2018
10.2.1.5.4.2.
Market Forecast, 2019 – 2027
10.2.1.5.5.
Latin America
10.2.1.5.5.1.
Market Estimation, 2015 – 2018
10.2.1.5.5.2.
Market Forecast, 2019 – 2027
10.2.2.
Chemical
10.2.2.1.
Definition
10.2.2.2.
Market Estimation and Penetration, 2015 – 2018
10.2.2.3.
Market Forecast, 2019 – 2027
10.2.2.4.
Compound Annual Growth Rate (CAGR)
10.2.2.5.
Regional Bifurcation
10.2.2.5.1.
North America
10.2.2.5.1.1.
Market Estimation, 2015 – 2018
10.2.2.5.1.2.
Market Forecast, 2019 – 2027
10.2.2.5.2.
Europe
10.2.2.5.2.1.
Market Estimation, 2015 – 2018
10.2.2.5.2.2.
Market Forecast, 2019 – 2027
10.2.2.5.3.
Asia Pacific
10.2.2.5.3.1.
Market Estimation, 2015 – 2018
10.2.2.5.3.2.
Market Forecast, 2019 – 2027
10.2.2.5.4.
Middle East and Africa
10.2.2.5.4.1.
Market Estimation, 2015 – 2018
10.2.2.5.4.2.
Market Forecast, 2019 – 2027
10.2.2.5.5.
Latin America
10.2.2.5.5.1.
Market Estimation, 2015 – 2018
10.2.2.5.5.2.
Market Forecast, 2019 – 2027
10.2.3.
Consumer Goods
10.2.3.1.
Definition
10.2.3.2.
Market Estimation and Penetration, 2015 – 2018
10.2.3.3.
Market Forecast, 2019 – 2027
10.2.3.4.
Compound Annual Growth Rate (CAGR)
10.2.3.5.
Regional Bifurcation
10.2.3.5.1.
North America
10.2.3.5.1.1.
Market Estimation, 2015 – 2018
10.2.3.5.1.2.
Market Forecast, 2019 – 2027
10.2.3.5.2.
Europe
10.2.3.5.2.1.
Market Estimation, 2015 – 2018
10.2.3.5.2.2.
Market Forecast, 2019 – 2027
10.2.3.5.3.
Asia Pacific
10.2.3.5.3.1.
Market Estimation, 2015 – 2018
10.2.3.5.3.2.
Market Forecast, 2019 – 2027
10.2.3.5.4.
Middle East and Africa
10.2.3.5.4.1.
Market Estimation, 2015 – 2018
10.2.3.5.4.2.
Market Forecast, 2019 – 2027
10.2.3.5.5.
Latin America
10.2.3.5.5.1.
Market Estimation, 2015 – 2018
10.2.3.5.5.2.
Market Forecast, 2019 – 2027
10.2.4.
Energy
10.2.4.1.
Definition
10.2.4.2.
Market Estimation and Penetration, 2015 – 2018
10.2.4.3.
Market Forecast, 2019 – 2027
10.2.4.4.
Compound Annual Growth Rate (CAGR)
10.2.4.5.
Regional Bifurcation
10.2.4.5.1.
North America
10.2.4.5.1.1.
Market Estimation, 2015 – 2018
10.2.4.5.1.2.
Market Forecast, 2019 – 2027
10.2.4.5.2.
Europe
10.2.4.5.2.1.
Market Estimation, 2015 – 2018
10.2.4.5.2.2.
Market Forecast, 2019 – 2027
10.2.4.5.3.
Asia Pacific
10.2.4.5.3.1.
Market Estimation, 2015 – 2018
10.2.4.5.3.2.
Market Forecast, 2019 – 2027
10.2.4.5.4.
Middle East and Africa
10.2.4.5.4.1.
Market Estimation, 2015 – 2018
10.2.4.5.4.2.
Market Forecast, 2019 – 2027
10.2.4.5.5.
Latin America
10.2.4.5.5.1.
Market Estimation, 2015 – 2018
10.2.4.5.5.2.
Market Forecast, 2019 – 2027
10.2.5.
Financial Services
10.2.5.1.
Definition
10.2.5.2.
Market Estimation and Penetration, 2015 – 2018
10.2.5.3.
Market Forecast, 2019 – 2027
10.2.5.4.
Compound Annual Growth Rate (CAGR)
10.2.5.5.
Regional Bifurcation
10.2.5.5.1.
North America
10.2.5.5.1.1.
Market Estimation, 2015 – 2018
10.2.5.5.1.2.
Market Forecast, 2019 – 2027
10.2.5.5.2.
Europe
10.2.5.5.2.1.
Market Estimation, 2015 – 2018
10.2.5.5.2.2.
Market Forecast, 2019 – 2027
10.2.5.5.3.
Asia Pacific
10.2.5.5.3.1.
Market Estimation, 2015 – 2018
10.2.5.5.3.2.
Market Forecast, 2019 – 2027
10.2.5.5.4.
Middle East and Africa
10.2.5.5.4.1.
Market Estimation, 2015 – 2018
10.2.5.5.4.2.
Market Forecast, 2019 – 2027
10.2.5.5.5.
Latin America
10.2.5.5.5.1.
Market Estimation, 2015 – 2018
10.2.5.5.5.2.
Market Forecast, 2019 – 2027
10.2.6.
Food and Beverages
10.2.6.1.
Definition
10.2.6.2.
Market Estimation and Penetration, 2015 – 2018
10.2.6.3.
Market Forecast, 2019 – 2027
10.2.6.4.
Compound Annual Growth Rate (CAGR)
10.2.6.5.
Regional Bifurcation
10.2.6.5.1.
North America
10.2.6.5.1.1.
Market Estimation, 2015 – 2018
10.2.6.5.1.2.
Market Forecast, 2019 – 2027
10.2.6.5.2.
Europe
10.2.6.5.2.1.
Market Estimation, 2015 – 2018
10.2.6.5.2.2.
Market Forecast, 2019 – 2027
10.2.6.5.3.
Asia Pacific
10.2.6.5.3.1.
Market Estimation, 2015 – 2018
10.2.6.5.3.2.
Market Forecast, 2019 – 2027
10.2.6.5.4.
Middle East and Africa
10.2.6.5.4.1.
Market Estimation, 2015 – 2018
10.2.6.5.4.2.
Market Forecast, 2019 – 2027
10.2.6.5.5.
Latin America
10.2.6.5.5.1.
Market Estimation, 2015 – 2018
10.2.6.5.5.2.
Market Forecast, 2019 – 2027
10.2.7.
Manufacturing
10.2.7.1.
Definition
10.2.7.2.
Market Estimation and Penetration, 2015 – 2018
10.2.7.3.
Market Forecast, 2019 – 2027
10.2.7.4.
Compound Annual Growth Rate (CAGR)
10.2.7.5.
Regional Bifurcation
10.2.7.5.1.
North America
10.2.7.5.1.1.
Market Estimation, 2015 – 2018
10.2.7.5.1.2.
Market Forecast, 2019 – 2027
10.2.7.5.2.
Europe
10.2.7.5.2.1.
Market Estimation, 2015 – 2018
10.2.7.5.2.2.
Market Forecast, 2019 – 2027
10.2.7.5.3.
Asia Pacific
10.2.7.5.3.1.
Market Estimation, 2015 – 2018
10.2.7.5.3.2.
Market Forecast, 2019 – 2027
10.2.7.5.4.
Middle East and Africa
10.2.7.5.4.1.
Market Estimation, 2015 – 2018
10.2.7.5.4.2.
Market Forecast, 2019 – 2027
10.2.7.5.5.
Latin America
10.2.7.5.5.1.
Market Estimation, 2015 – 2018
10.2.7.5.5.2.
Market Forecast, 2019 – 2027
10.2.8.
Telecommunication
10.2.8.1.
Definition
10.2.8.2.
Market Estimation and Penetration, 2015 – 2018
10.2.8.3.
Market Forecast, 2019 – 2027
10.2.8.4.
Compound Annual Growth Rate (CAGR)
10.2.8.5.
Regional Bifurcation
10.2.8.5.1.
North America
10.2.8.5.1.1.
Market Estimation, 2015 – 2018
10.2.8.5.1.2.
Market Forecast, 2019 – 2027
10.2.8.5.2.
Europe
10.2.8.5.2.1.
Market Estimation, 2015 – 2018
10.2.8.5.2.2.
Market Forecast, 2019 – 2027
10.2.8.5.3.
Asia Pacific
10.2.8.5.3.1.
Market Estimation, 2015 – 2018
10.2.8.5.3.2.
Market Forecast, 2019 – 2027
10.2.8.5.4.
Middle East and Africa
10.2.8.5.4.1.
Market Estimation, 2015 – 2018
10.2.8.5.4.2.
Market Forecast, 2019 – 2027
10.2.8.5.5.
Latin America
10.2.8.5.5.1.
Market Estimation, 2015 – 2018
10.2.8.5.5.2.
Market Forecast, 2019 – 2027
10.2.9.
Wholesale and Distribution
10.2.9.1.
Definition
10.2.9.2.
Market Estimation and Penetration, 2015 – 2018
10.2.9.3.
Market Forecast, 2019 – 2027
10.2.9.4.
Compound Annual Growth Rate (CAGR)
10.2.9.5.
Regional Bifurcation
10.2.9.5.1.
North America
10.2.9.5.1.1.
Market Estimation, 2015 – 2018
10.2.9.5.1.2.
Market Forecast, 2019 – 2027
10.2.9.5.2.
Europe
10.2.9.5.2.1.
Market Estimation, 2015 – 2018
10.2.9.5.2.2.
Market Forecast, 2019 – 2027
10.2.9.5.3.
Asia Pacific
10.2.9.5.3.1.
Market Estimation, 2015 – 2018
10.2.9.5.3.2.
Market Forecast, 2019 – 2027
10.2.9.5.4.
Middle East and Africa
10.2.9.5.4.1.
Market Estimation, 2015 – 2018
10.2.9.5.4.2.
Market Forecast, 2019 – 2027
10.2.9.5.5.
Latin America
10.2.9.5.5.1.
Market Estimation, 2015 – 2018
10.2.9.5.5.2.
Market Forecast, 2019 – 2027
10.3. Key Segment
for Channeling Investments
10.3.1.
By Industry Verticals
11. North America
B2B Price Optimization and Management Software Market Analysis and Forecasts,
2019 - 2027
11.1. Overview
11.1.1.
North America B2B Price Optimization and Management Software
Market Revenue (US$ Mn)
11.2. North America
B2B Price Optimization and Management Software Market Revenue (US$ Mn) and
Forecasts, By Deployment
11.2.1.
Cloud Based
11.2.2.
On Premise
11.3. North America
B2B Price Optimization and Management Software Market Revenue (US$ Mn) and
Forecasts, By Application
11.3.1.
Small and Medium Enterprises
11.3.2.
Large Enterprises
11.4. North America
B2B Price Optimization and Management Software Market Revenue (US$ Mn) and
Forecasts, By Industry Verticals
11.4.1.
Airlines and Travel
11.4.2.
Chemical
11.4.3.
Consumer Goods
11.4.4.
Energy
11.4.5.
Financial Services
11.4.6.
Food and Beverages
11.4.7.
Manufacturing
11.4.8.
Telecommunication
11.4.9.
Wholesale and Distribution
11.5. North America
B2B Price Optimization and Management Software Market Revenue (US$ Mn) and
Forecasts, By Country
11.5.1.
U.S
11.5.1.1.
U.S B2B Price Optimization and Management Software Market
Revenue (US$ Mn) and Forecasts, By Deployment
11.5.1.1.1.
Cloud Based
11.5.1.1.2.
On Premise
11.5.1.2.
U.S B2B Price Optimization and Management Software Market
Revenue (US$ Mn) and Forecasts, By Application
11.5.1.2.1.
Small and Medium Enterprises
11.5.1.2.2.
Large Enterprises
11.5.1.3.
U.S B2B Price Optimization and Management Software Market
Revenue (US$ Mn) and Forecasts, By Industry Verticals
11.5.1.3.1.
Airlines and Travel
11.5.1.3.2.
Chemical
11.5.1.3.3.
Consumer Goods
11.5.1.3.4.
Energy
11.5.1.3.5.
Financial Services
11.5.1.3.6.
Food and Beverages
11.5.1.3.7.
Manufacturing
11.5.1.3.8.
Telecommunication
11.5.1.3.9.
Wholesale and Distribution
11.5.2.
Canada
11.5.2.1.
Canada B2B Price Optimization and Management Software Market
Revenue (US$ Mn) and Forecasts, By Deployment
11.5.2.1.1.
Cloud Based
11.5.2.1.2.
On Premise
11.5.2.2.
Canada B2B Price Optimization and Management Software Market
Revenue (US$ Mn) and Forecasts, By Application
11.5.2.2.1.
Small and Medium Enterprises
11.5.2.2.2.
Large Enterprises
11.5.2.3.
Canada B2B Price Optimization and Management Software Market
Revenue (US$ Mn) and Forecasts, By Industry Verticals
11.5.2.3.1.
Airlines and Travel
11.5.2.3.2.
Chemical
11.5.2.3.3.
Consumer Goods
11.5.2.3.4.
Energy
11.5.2.3.5.
Financial Services
11.5.2.3.6.
Food and Beverages
11.5.2.3.7.
Manufacturing
11.5.2.3.8.
Telecommunication
11.5.2.3.9.
Wholesale and Distribution
11.5.3.
Mexico
11.5.3.1.
Mexico B2B Price Optimization and Management Software Market
Revenue (US$ Mn) and Forecasts, By Deployment
11.5.3.1.1.
Cloud Based
11.5.3.1.2.
On Premise
11.5.3.2.
Mexico B2B Price Optimization and Management Software Market
Revenue (US$ Mn) and Forecasts, By Application
11.5.3.2.1.
Small and Medium Enterprises
11.5.3.2.2.
Large Enterprises
11.5.3.3.
Mexico B2B Price Optimization and Management Software Market
Revenue (US$ Mn) and Forecasts, By Industry Verticals
11.5.3.3.1.
Airlines and Travel
11.5.3.3.2.
Chemical
11.5.3.3.3.
Consumer Goods
11.5.3.3.4.
Energy
11.5.3.3.5.
Financial Services
11.5.3.3.6.
Food and Beverages
11.5.3.3.7.
Manufacturing
11.5.3.3.8.
Telecommunication
11.5.3.3.9.
Wholesale and Distribution
11.5.4.
Rest of North America
11.5.4.1.
Rest of North America B2B Price Optimization and Management
Software Market Revenue (US$ Mn) and Forecasts, By Deployment
11.5.4.1.1.
Cloud Based
11.5.4.1.2.
On Premise
11.5.4.2.
Rest of North America B2B Price Optimization and Management
Software Market Revenue (US$ Mn) and Forecasts, By Application
11.5.4.2.1.
Small and Medium Enterprises
11.5.4.2.2.
Large Enterprises
11.5.4.3.
Rest of North America B2B Price Optimization and Management
Software Market Revenue (US$ Mn) and Forecasts, By Industry Verticals
11.5.4.3.1.
Airlines and Travel
11.5.4.3.2.
Chemical
11.5.4.3.3.
Consumer Goods
11.5.4.3.4.
Energy
11.5.4.3.5.
Financial Services
11.5.4.3.6.
Food and Beverages
11.5.4.3.7.
Manufacturing
11.5.4.3.8.
Telecommunication
11.5.4.3.9.
Wholesale and Distribution
11.6. Key Segment
for Channeling Investments
11.6.1.
By Country
11.6.2.
By Deployment
11.6.3.
By Application
11.6.4.
By Industry Verticals
12. Europe B2B
Price Optimization and Management Software Market Analysis and Forecasts, 2019
- 2027
12.1. Overview
12.1.1.
Europe B2B Price Optimization and Management Software Market
Revenue (US$ Mn)
12.2. Europe B2B
Price Optimization and Management Software Market Revenue (US$ Mn) and
Forecasts, By Deployment
12.2.1.
Cloud Based
12.2.2.
On Premise
12.3. Europe B2B
Price Optimization and Management Software Market Revenue (US$ Mn) and
Forecasts, By Application
12.3.1.
Small and Medium Enterprises
12.3.2.
Large Enterprises
12.4. Europe B2B
Price Optimization and Management Software Market Revenue (US$ Mn) and Forecasts,
By Industry Verticals
12.4.1.
Airlines and Travel
12.4.2.
Chemical
12.4.3.
Consumer Goods
12.4.4.
Energy
12.4.5.
Financial Services
12.4.6.
Food and Beverages
12.4.7.
Manufacturing
12.4.8.
Telecommunication
12.4.9.
Wholesale and Distribution
12.5. Europe B2B
Price Optimization and Management Software Market Revenue (US$ Mn) and
Forecasts, By Country
12.5.1.
France
12.5.1.1.
France B2B Price Optimization and Management Software Market
Revenue (US$ Mn) and Forecasts, By Deployment
12.5.1.1.1.
Cloud Based
12.5.1.1.2.
On Premise
12.5.1.2.
France B2B Price Optimization and Management Software Market
Revenue (US$ Mn) and Forecasts, By Application
12.5.1.2.1.
Small and Medium Enterprises
12.5.1.2.2.
Large Enterprises
12.5.1.3.
France B2B Price Optimization and Management Software Market
Revenue (US$ Mn) and Forecasts, By Industry Verticals
12.5.1.3.1.
Airlines and Travel
12.5.1.3.2.
Chemical
12.5.1.3.3.
Consumer Goods
12.5.1.3.4.
Energy
12.5.1.3.5.
Financial Services
12.5.1.3.6.
Food and Beverages
12.5.1.3.7.
Manufacturing
12.5.1.3.8.
Telecommunication
12.5.1.3.9.
Wholesale and Distribution
12.5.2.
The UK
12.5.2.1.
The UK B2B Price Optimization and Management Software Market
Revenue (US$ Mn) and Forecasts, By Deployment
12.5.2.1.1.
Cloud Based
12.5.2.1.2.
On Premise
12.5.2.2.
The UK B2B Price Optimization and Management Software Market
Revenue (US$ Mn) and Forecasts, By Application
12.5.2.2.1.
Small and Medium Enterprises
12.5.2.2.2.
Large Enterprises
12.5.2.3.
The UK B2B Price Optimization and Management Software Market
Revenue (US$ Mn) and Forecasts, By Industry Verticals
12.5.2.3.1.
Airlines and Travel
12.5.2.3.2.
Chemical
12.5.2.3.3.
Consumer Goods
12.5.2.3.4.
Energy
12.5.2.3.5.
Financial Services
12.5.2.3.6.
Food and Beverages
12.5.2.3.7.
Manufacturing
12.5.2.3.8.
Telecommunication
12.5.2.3.9.
Wholesale and Distribution
12.5.3.
Spain
12.5.3.1.
Spain B2B Price Optimization and Management Software Market
Revenue (US$ Mn) and Forecasts, By Deployment
12.5.3.1.1.
Cloud Based
12.5.3.1.2.
On Premise
12.5.3.2.
Spain B2B Price Optimization and Management Software Market
Revenue (US$ Mn) and Forecasts, By Application
12.5.3.2.1.
Small and Medium Enterprises
12.5.3.2.2.
Large Enterprises
12.5.3.3.
Spain B2B Price Optimization and Management Software Market
Revenue (US$ Mn) and Forecasts, By Industry Verticals
12.5.3.3.1.
Airlines and Travel
12.5.3.3.2.
Chemical
12.5.3.3.3.
Consumer Goods
12.5.3.3.4.
Energy
12.5.3.3.5.
Financial Services
12.5.3.3.6.
Food and Beverages
12.5.3.3.7.
Manufacturing
12.5.3.3.8.
Telecommunication
12.5.3.3.9.
Wholesale and Distribution
12.5.4.
Germany
12.5.4.1.
Germany B2B Price Optimization and Management Software Market
Revenue (US$ Mn) and Forecasts, By Deployment
12.5.4.1.1.
Cloud Based
12.5.4.1.2.
On Premise
12.5.4.2.
Germany B2B Price Optimization and Management Software Market
Revenue (US$ Mn) and Forecasts, By Application
12.5.4.2.1.
Small and Medium Enterprises
12.5.4.2.2.
Large Enterprises
12.5.4.3.
Germany B2B Price Optimization and Management Software Market
Revenue (US$ Mn) and Forecasts, By Industry Verticals
12.5.4.3.1.
Airlines and Travel
12.5.4.3.2.
Chemical
12.5.4.3.3.
Consumer Goods
12.5.4.3.4.
Energy
12.5.4.3.5.
Financial Services
12.5.4.3.6.
Food and Beverages
12.5.4.3.7.
Manufacturing
12.5.4.3.8.
Telecommunication
12.5.4.3.9.
Wholesale and Distribution
12.5.5.
Italy
12.5.5.1.
Italy B2B Price Optimization and Management Software Market
Revenue (US$ Mn) and Forecasts, By Deployment
12.5.5.1.1.
Cloud Based
12.5.5.1.2.
On Premise
12.5.5.2.
Italy B2B Price Optimization and Management Software Market
Revenue (US$ Mn) and Forecasts, By Application
12.5.5.2.1.
Small and Medium Enterprises
12.5.5.2.2.
Large Enterprises
12.5.5.3.
Italy B2B Price Optimization and Management Software Market
Revenue (US$ Mn) and Forecasts, By Industry Verticals
12.5.5.3.1.
Airlines and Travel
12.5.5.3.2.
Chemical
12.5.5.3.3.
Consumer Goods
12.5.5.3.4.
Energy
12.5.5.3.5.
Financial Services
12.5.5.3.6.
Food and Beverages
12.5.5.3.7.
Manufacturing
12.5.5.3.8.
Telecommunication
12.5.5.3.9.
Wholesale and Distribution
12.5.6.
Nordic Countries
12.5.6.1.
Nordic Countries B2B Price Optimization and Management
Software Market Revenue (US$ Mn) and Forecasts, By Deployment
12.5.6.1.1.
Cloud Based
12.5.6.1.2.
On Premise
12.5.6.2.
Nordic Countries B2B Price Optimization and Management
Software Market Revenue (US$ Mn) and Forecasts, By Application
12.5.6.2.1.
Small and Medium Enterprises
12.5.6.2.2.
Large Enterprises
12.5.6.3.
Nordic Countries B2B Price Optimization and Management
Software Market Revenue (US$ Mn) and Forecasts, By Industry Verticals
12.5.6.3.1.
Airlines and Travel
12.5.6.3.2.
Chemical
12.5.6.3.3.
Consumer Goods
12.5.6.3.4.
Energy
12.5.6.3.5.
Financial Services
12.5.6.3.6.
Food and Beverages
12.5.6.3.7.
Manufacturing
12.5.6.3.8.
Telecommunication
12.5.6.3.9.
Wholesale and Distribution
12.5.6.4.
Nordic Countries B2B Price Optimization and Management
Software Market Revenue (US$ Mn) and Forecasts, By Country
12.5.6.4.1.
Denmark
12.5.6.4.2.
Finland
12.5.6.4.3.
Iceland
12.5.6.4.4.
Sweden
12.5.6.4.5.
Norway
12.5.7.
Benelux Union
12.5.7.1.
Benelux Union B2B Price Optimization and Management Software
Market Revenue (US$ Mn) and Forecasts, By Deployment
12.5.7.1.1.
Cloud Based
12.5.7.1.2.
On Premise
12.5.7.2.
Benelux Union B2B Price Optimization and Management Software
Market Revenue (US$ Mn) and Forecasts, By Application
12.5.7.2.1.
Small and Medium Enterprises
12.5.7.2.2.
Large Enterprises
12.5.7.3.
Benelux Union B2B Price Optimization and Management Software
Market Revenue (US$ Mn) and Forecasts, By Industry Verticals
12.5.7.3.1.
Airlines and Travel
12.5.7.3.2.
Chemical
12.5.7.3.3.
Consumer Goods
12.5.7.3.4.
Energy
12.5.7.3.5.
Financial Services
12.5.7.3.6.
Food and Beverages
12.5.7.3.7.
Manufacturing
12.5.7.3.8.
Telecommunication
12.5.7.3.9.
Wholesale and Distribution
12.5.7.4.
Benelux Union B2B Price Optimization and Management Software
Market Revenue (US$ Mn) and Forecasts, By Country
12.5.7.4.1.
Belgium
12.5.7.4.2.
The Netherlands
12.5.7.4.3.
Luxembourg
12.5.8.
Rest of Europe
12.5.8.1.
Rest of Europe B2B Price Optimization and Management Software
Market Revenue (US$ Mn) and Forecasts, By Deployment
12.5.8.1.1.
Cloud Based
12.5.8.1.2.
On Premise
12.5.8.2.
Rest of Europe B2B Price Optimization and Management Software
Market Revenue (US$ Mn) and Forecasts, By Application
12.5.8.2.1.
Small and Medium Enterprises
12.5.8.2.2.
Large Enterprises
12.5.8.3.
Rest of Europe B2B Price Optimization and Management Software
Market Revenue (US$ Mn) and Forecasts, By Industry Verticals
12.5.8.3.1.
Airlines and Travel
12.5.8.3.2.
Chemical
12.5.8.3.3.
Consumer Goods
12.5.8.3.4.
Energy
12.5.8.3.5.
Financial Services
12.5.8.3.6.
Food and Beverages
12.5.8.3.7.
Manufacturing
12.5.8.3.8.
Telecommunication
12.5.8.3.9.
Wholesale and Distribution
12.6. Key Segment
for Channeling Investments
12.6.1.
By Country
12.6.2.
By Deployment
12.6.3.
By Application
12.6.4.
By Industry Verticals
13. Asia Pacific
B2B Price Optimization and Management Software Market Analysis and Forecasts,
2019 - 2027
13.1. Overview
13.1.1.
Asia Pacific B2B Price Optimization and Management Software
Market Revenue (US$ Mn)
13.2. Asia Pacific
B2B Price Optimization and Management Software Market Revenue (US$ Mn) and
Forecasts, By Deployment
13.2.1.
Cloud Based
13.2.2.
On Premise
13.3. Asia Pacific
B2B Price Optimization and Management Software Market Revenue (US$ Mn) and
Forecasts, By Application
13.3.1.
Small and Medium Enterprises
13.3.2.
Large Enterprises
13.4. Asia Pacific
B2B Price Optimization and Management Software Market Revenue (US$ Mn) and
Forecasts, By Industry Verticals
13.4.1.
Airlines and Travel
13.4.2.
Chemical
13.4.3.
Consumer Goods
13.4.4.
Energy
13.4.5.
Financial Services
13.4.6.
Food and Beverages
13.4.7.
Manufacturing
13.4.8.
Telecommunication
13.4.9.
Wholesale and Distribution
13.5. Asia Pacific
B2B Price Optimization and Management Software Market Revenue (US$ Mn) and
Forecasts, By Country
13.5.1.
China
13.5.1.1.
China B2B Price Optimization and Management Software Market
Revenue (US$ Mn) and Forecasts, By Deployment
13.5.1.1.1.
Cloud Based
13.5.1.1.2.
On Premise
13.5.1.2.
China B2B Price Optimization and Management Software Market
Revenue (US$ Mn) and Forecasts, By Application
13.5.1.2.1.
Small and Medium Enterprises
13.5.1.2.2.
Large Enterprises
13.5.1.3.
China B2B Price Optimization and Management Software Market
Revenue (US$ Mn) and Forecasts, By Industry Verticals
13.5.1.3.1.
Airlines and Travel
13.5.1.3.2.
Chemical
13.5.1.3.3.
Consumer Goods
13.5.1.3.4.
Energy
13.5.1.3.5.
Financial Services
13.5.1.3.6.
Food and Beverages
13.5.1.3.7.
Manufacturing
13.5.1.3.8.
Telecommunication
13.5.1.3.9.
Wholesale and Distribution
13.5.2.
Japan
13.5.2.1.
Japan B2B Price Optimization and Management Software Market
Revenue (US$ Mn) and Forecasts, By Deployment
13.5.2.1.1.
Cloud Based
13.5.2.1.2.
On Premise
13.5.2.2.
Japan B2B Price Optimization and Management Software Market
Revenue (US$ Mn) and Forecasts, By Application
13.5.2.2.1.
Small and Medium Enterprises
13.5.2.2.2.
Large Enterprises
13.5.2.3.
Japan B2B Price Optimization and Management Software Market
Revenue (US$ Mn) and Forecasts, By Industry Verticals
13.5.2.3.1.
Airlines and Travel
13.5.2.3.2.
Chemical
13.5.2.3.3.
Consumer Goods
13.5.2.3.4.
Energy
13.5.2.3.5.
Financial Services
13.5.2.3.6.
Food and Beverages
13.5.2.3.7.
Manufacturing
13.5.2.3.8.
Telecommunication
13.5.2.3.9.
Wholesale and Distribution
13.5.3.
India
13.5.3.1.
India B2B Price Optimization and Management Software Market
Revenue (US$ Mn) and Forecasts, By Deployment
13.5.3.1.1.
Cloud Based
13.5.3.1.2.
On Premise
13.5.3.2.
India B2B Price Optimization and Management Software Market
Revenue (US$ Mn) and Forecasts, By Application
13.5.3.2.1.
Small and Medium Enterprises
13.5.3.2.2.
Large Enterprises
13.5.3.3.
India B2B Price Optimization and Management Software Market
Revenue (US$ Mn) and Forecasts, By Industry Verticals
13.5.3.3.1.
Airlines and Travel
13.5.3.3.2.
Chemical
13.5.3.3.3.
Consumer Goods
13.5.3.3.4.
Energy
13.5.3.3.5.
Financial Services
13.5.3.3.6.
Food and Beverages
13.5.3.3.7.
Manufacturing
13.5.3.3.8.
Telecommunication
13.5.3.3.9.
Wholesale and Distribution
13.5.4.
New Zealand
13.5.4.1.
New Zealand B2B Price Optimization and Management Software
Market Revenue (US$ Mn) and Forecasts, By Deployment
13.5.4.1.1.
Cloud Based
13.5.4.1.2.
On Premise
13.5.4.2.
New Zealand B2B Price Optimization and Management Software
Market Revenue (US$ Mn) and Forecasts, By Application
13.5.4.2.1.
Small and Medium Enterprises
13.5.4.2.2.
Large Enterprises
13.5.4.3.
New Zealand B2B Price Optimization and Management Software
Market Revenue (US$ Mn) and Forecasts, By Industry Verticals
13.5.4.3.1.
Airlines and Travel
13.5.4.3.2.
Chemical
13.5.4.3.3.
Consumer Goods
13.5.4.3.4.
Energy
13.5.4.3.5.
Financial Services
13.5.4.3.6.
Food and Beverages
13.5.4.3.7.
Manufacturing
13.5.4.3.8.
Telecommunication
13.5.4.3.9.
Wholesale and Distribution
13.5.5.
Australia
13.5.5.1.
Australia B2B Price Optimization and Management Software
Market Revenue (US$ Mn) and Forecasts, By Deployment
13.5.5.1.1.
Cloud Based
13.5.5.1.2.
On Premise
13.5.5.2.
Australia B2B Price Optimization and Management Software
Market Revenue (US$ Mn) and Forecasts, By Application
13.5.5.2.1.
Small and Medium Enterprises
13.5.5.2.2.
Large Enterprises
13.5.5.3.
Australia B2B Price Optimization and Management Software
Market Revenue (US$ Mn) and Forecasts, By Industry Verticals
13.5.5.3.1.
Airlines and Travel
13.5.5.3.2.
Chemical
13.5.5.3.3.
Consumer Goods
13.5.5.3.4.
Energy
13.5.5.3.5.
Financial Services
13.5.5.3.6.
Food and Beverages
13.5.5.3.7.
Manufacturing
13.5.5.3.8.
Telecommunication
13.5.5.3.9.
Wholesale and Distribution
13.5.6.
South Korea
13.5.6.1.
South Korea B2B Price Optimization and Management Software
Market Revenue (US$ Mn) and Forecasts, By Deployment
13.5.6.1.1.
Cloud Based
13.5.6.1.2.
On Premise
13.5.6.2.
South Korea B2B Price Optimization and Management Software
Market Revenue (US$ Mn) and Forecasts, By Application
13.5.6.2.1.
Small and Medium Enterprises
13.5.6.2.2.
Large Enterprises
13.5.6.3.
South Korea B2B Price Optimization and Management Software
Market Revenue (US$ Mn) and Forecasts, By Industry Verticals
13.5.6.3.1.
Airlines and Travel
13.5.6.3.2.
Chemical
13.5.6.3.3.
Consumer Goods
13.5.6.3.4.
Energy
13.5.6.3.5.
Financial Services
13.5.6.3.6.
Food and Beverages
13.5.6.3.7.
Manufacturing
13.5.6.3.8.
Telecommunication
13.5.6.3.9.
Wholesale and Distribution
13.5.7.
Southeast Asia
13.5.7.1.
Southeast Asia B2B Price Optimization and Management Software
Market Revenue (US$ Mn) and Forecasts, By Deployment
13.5.7.1.1.
Cloud Based
13.5.7.1.2.
On Premise
13.5.7.2.
Southeast Asia B2B Price Optimization and Management Software
Market Revenue (US$ Mn) and Forecasts, By Application
13.5.7.2.1.
Small and Medium Enterprises
13.5.7.2.2.
Large Enterprises
13.5.7.3.
Southeast Asia B2B Price Optimization and Management Software
Market Revenue (US$ Mn) and Forecasts, By Industry Verticals
13.5.7.3.1.
Airlines and Travel
13.5.7.3.2.
Chemical
13.5.7.3.3.
Consumer Goods
13.5.7.3.4.
Energy
13.5.7.3.5.
Financial Services
13.5.7.3.6.
Food and Beverages
13.5.7.3.7.
Manufacturing
13.5.7.3.8.
Telecommunication
13.5.7.3.9.
Wholesale and Distribution
13.5.7.4.
Southeast Asia B2B Price Optimization and Management Software
Market Revenue (US$ Mn) and Forecasts, By Country
13.5.7.4.1.
Indonesia
13.5.7.4.2.
Thailand
13.5.7.4.3.
Malaysia
13.5.7.4.4.
Singapore
13.5.7.4.5.
Rest of Southeast Asia
13.5.8.
Rest of Asia Pacific
13.5.8.1.
Rest of Asia Pacific B2B Price Optimization and Management
Software Market Revenue (US$ Mn) and Forecasts, By Deployment
13.5.8.1.1.
Cloud Based
13.5.8.1.2.
On Premise
13.5.8.2.
Rest of Asia Pacific B2B Price Optimization and Management
Software Market Revenue (US$ Mn) and Forecasts, By Application
13.5.8.2.1.
Small and Medium Enterprises
13.5.8.2.2.
Large Enterprises
13.5.8.3.
Rest of Asia Pacific B2B Price Optimization and Management
Software Market Revenue (US$ Mn) and Forecasts, By Industry Verticals
13.5.8.3.1.
Airlines and Travel
13.5.8.3.2.
Chemical
13.5.8.3.3.
Consumer Goods
13.5.8.3.4.
Energy
13.5.8.3.5.
Financial Services
13.5.8.3.6.
Food and Beverages
13.5.8.3.7.
Manufacturing
13.5.8.3.8.
Telecommunication
13.5.8.3.9.
Wholesale and Distribution
13.6. Key Segment
for Channeling Investments
13.6.1.
By Country
13.6.2.
By Deployment
13.6.3.
By Application
13.6.4.
By Industry Verticals
14. Middle East
and Africa B2B Price Optimization and Management Software Market Analysis and
Forecasts, 2019 - 2027
14.1. Overview
14.1.1.
Middle East and Africa B2B Price Optimization and Management
Software Market Revenue (US$ Mn)
14.2. Middle East
and Africa B2B Price Optimization and Management Software Market Revenue (US$ Mn)
and Forecasts, By Deployment
14.2.1.
Cloud Based
14.2.2.
On Premise
14.3. Middle East
and Africa B2B Price Optimization and Management Software Market Revenue (US$
Mn) and Forecasts, By Application
14.3.1.
Small and Medium Enterprises
14.3.2.
Large Enterprises
14.4. Middle East
and Africa B2B Price Optimization and Management Software Market Revenue (US$
Mn) and Forecasts, By Industry Verticals
14.4.1.
Airlines and Travel
14.4.2.
Chemical
14.4.3.
Consumer Goods
14.4.4.
Energy
14.4.5.
Financial Services
14.4.6.
Food and Beverages
14.4.7.
Manufacturing
14.4.8.
Telecommunication
14.4.9.
Wholesale and Distribution
14.5. Middle East
and Africa B2B Price Optimization and Management Software Market Revenue (US$
Mn) and Forecasts, By Country
14.5.1.
Saudi Arabia
14.5.1.1.
Saudi Arabia B2B Price Optimization and Management Software
Market Revenue (US$ Mn) and Forecasts, By Deployment
14.5.1.1.1.
Cloud Based
14.5.1.1.2.
On Premise
14.5.1.2.
Saudi Arabia B2B Price Optimization and Management Software
Market Revenue (US$ Mn) and Forecasts, By Application
14.5.1.2.1.
Small and Medium Enterprises
14.5.1.2.2.
Large Enterprises
14.5.1.3.
Saudi Arabia B2B Price Optimization and Management Software
Market Revenue (US$ Mn) and Forecasts, By Industry Verticals
14.5.1.3.1.
Airlines and Travel
14.5.1.3.2.
Chemical
14.5.1.3.3.
Consumer Goods
14.5.1.3.4.
Energy
14.5.1.3.5.
Financial Services
14.5.1.3.6.
Food and Beverages
14.5.1.3.7.
Manufacturing
14.5.1.3.8.
Telecommunication
14.5.1.3.9.
Wholesale and Distribution
14.5.2.
UAE
14.5.2.1.
UAE B2B Price Optimization and Management Software Market
Revenue (US$ Mn) and Forecasts, By Deployment
14.5.2.1.1.
Cloud Based
14.5.2.1.2.
On Premise
14.5.2.2.
UAE B2B Price Optimization and Management Software Market
Revenue (US$ Mn) and Forecasts, By Application
14.5.2.2.1.
Small and Medium Enterprises
14.5.2.2.2.
Large Enterprises
14.5.2.3.
UAE B2B Price Optimization and Management Software Market
Revenue (US$ Mn) and Forecasts, By Industry Verticals
14.5.2.3.1.
Airlines and Travel
14.5.2.3.2.
Chemical
14.5.2.3.3.
Consumer Goods
14.5.2.3.4.
Energy
14.5.2.3.5.
Financial Services
14.5.2.3.6.
Food and Beverages
14.5.2.3.7.
Manufacturing
14.5.2.3.8.
Telecommunication
14.5.2.3.9.
Wholesale and Distribution
14.5.3.
Egypt
14.5.3.1.
Egypt B2B Price Optimization and Management Software Market
Revenue (US$ Mn) and Forecasts, By Deployment
14.5.3.1.1.
Cloud Based
14.5.3.1.2.
On Premise
14.5.3.2.
Egypt B2B Price Optimization and Management Software Market
Revenue (US$ Mn) and Forecasts, By Application
14.5.3.2.1.
Small and Medium Enterprises
14.5.3.2.2.
Large Enterprises
14.5.3.3.
Egypt B2B Price Optimization and Management Software Market
Revenue (US$ Mn) and Forecasts, By Industry Verticals
14.5.3.3.1.
Airlines and Travel
14.5.3.3.2.
Chemical
14.5.3.3.3.
Consumer Goods
14.5.3.3.4.
Energy
14.5.3.3.5.
Financial Services
14.5.3.3.6.
Food and Beverages
14.5.3.3.7.
Manufacturing
14.5.3.3.8.
Telecommunication
14.5.3.3.9.
Wholesale and Distribution
14.5.4.
Kuwait
14.5.4.1.
Kuwait B2B Price Optimization and Management Software Market
Revenue (US$ Mn) and Forecasts, By Deployment
14.5.4.1.1.
Cloud Based
14.5.4.1.2.
On Premise
14.5.4.2.
Kuwait B2B Price Optimization and Management Software Market
Revenue (US$ Mn) and Forecasts, By Application
14.5.4.2.1.
Small and Medium Enterprises
14.5.4.2.2.
Large Enterprises
14.5.4.3.
Kuwait B2B Price Optimization and Management Software Market
Revenue (US$ Mn) and Forecasts, By Industry Verticals
14.5.4.3.1.
Airlines and Travel
14.5.4.3.2.
Chemical
14.5.4.3.3.
Consumer Goods
14.5.4.3.4.
Energy
14.5.4.3.5.
Financial Services
14.5.4.3.6.
Food and Beverages
14.5.4.3.7.
Manufacturing
14.5.4.3.8.
Telecommunication
14.5.4.3.9.
Wholesale and Distribution
14.5.5.
South Africa
14.5.5.1.
South Africa B2B Price Optimization and Management Software
Market Revenue (US$ Mn) and Forecasts, By Deployment
14.5.5.1.1.
Cloud Based
14.5.5.1.2.
On Premise
14.5.5.2.
South Africa B2B Price Optimization and Management Software
Market Revenue (US$ Mn) and Forecasts, By Application
14.5.5.2.1.
Small and Medium Enterprises
14.5.5.2.2.
Large Enterprises
14.5.5.3.
South Africa B2B Price Optimization and Management Software
Market Revenue (US$ Mn) and Forecasts, By Industry Verticals
14.5.5.3.1.
Airlines and Travel
14.5.5.3.2.
Chemical
14.5.5.3.3.
Consumer Goods
14.5.5.3.4.
Energy
14.5.5.3.5.
Financial Services
14.5.5.3.6.
Food and Beverages
14.5.5.3.7.
Manufacturing
14.5.5.3.8.
Telecommunication
14.5.5.3.9.
Wholesale and Distribution
14.5.6.
Rest of Middle East & Africa
14.5.6.1.
Rest of Middle East & Africa B2B Price Optimization and
Management Software Market Revenue (US$ Mn) and Forecasts, By Deployment
14.5.6.1.1.
Cloud Based
14.5.6.1.2.
On Premise
14.5.6.2.
Rest of Middle East & Africa B2B Price Optimization and
Management Software Market Revenue (US$ Mn) and Forecasts, By Application
14.5.6.2.1.
Small and Medium Enterprises
14.5.6.2.2.
Large Enterprises
14.5.6.3.
Rest of Middle East & Africa B2B Price Optimization and
Management Software Market Revenue (US$ Mn) and Forecasts, By Industry
Verticals
14.5.6.3.1.
Airlines and Travel
14.5.6.3.2.
Chemical
14.5.6.3.3.
Consumer Goods
14.5.6.3.4.
Energy
14.5.6.3.5.
Financial Services
14.5.6.3.6.
Food and Beverages
14.5.6.3.7.
Manufacturing
14.5.6.3.8.
Telecommunication
14.5.6.3.9.
Wholesale and Distribution
14.6. Key Segment
for Channeling Investments
14.6.1.
By Country
14.6.2.
By Deployment
14.6.3.
By Application
14.6.4.
By Industry Verticals
15. Latin America
B2B Price Optimization and Management Software Market Analysis and Forecasts,
2019 - 2027
15.1. Overview
15.1.1.
Latin America B2B Price Optimization and Management Software
Market Revenue (US$ Mn)
15.2. Latin America
B2B Price Optimization and Management Software Market Revenue (US$ Mn) and
Forecasts, By Deployment
15.2.1.
Cloud Based
15.2.2.
On Premise
15.3. Latin America
B2B Price Optimization and Management Software Market Revenue (US$ Mn) and
Forecasts, By Application
15.3.1.
Small and Medium Enterprises
15.3.2.
Large Enterprises
15.4. Latin America
B2B Price Optimization and Management Software Market Revenue (US$ Mn) and
Forecasts, By Industry Verticals
15.4.1.
Airlines and Travel
15.4.2.
Chemical
15.4.3.
Consumer Goods
15.4.4.
Energy
15.4.5.
Financial Services
15.4.6.
Food and Beverages
15.4.7.
Manufacturing
15.4.8.
Telecommunication
15.4.9.
Wholesale and Distribution
15.5. Latin America
B2B Price Optimization and Management Software Market Revenue (US$ Mn) and
Forecasts, By Country
15.5.1.
Brazil
15.5.1.1.
Brazil B2B Price Optimization and Management Software Market
Revenue (US$ Mn) and Forecasts, By Deployment
15.5.1.1.1.
Cloud Based
15.5.1.1.2.
On Premise
15.5.1.2.
Brazil B2B Price Optimization and Management Software Market
Revenue (US$ Mn) and Forecasts, By Application
15.5.1.2.1.
Small and Medium Enterprises
15.5.1.2.2.
Large Enterprises
15.5.1.3.
Brazil B2B Price Optimization and Management Software Market
Revenue (US$ Mn) and Forecasts, By Industry Verticals
15.5.1.3.1.
Airlines and Travel
15.5.1.3.2.
Chemical
15.5.1.3.3.
Consumer Goods
15.5.1.3.4.
Energy
15.5.1.3.5.
Financial Services
15.5.1.3.6.
Food and Beverages
15.5.1.3.7.
Manufacturing
15.5.1.3.8.
Telecommunication
15.5.1.3.9.
Wholesale and Distribution
15.5.2.
Argentina
15.5.2.1.
Argentina B2B Price Optimization and Management Software
Market Revenue (US$ Mn) and Forecasts, By Deployment
15.5.2.1.1.
Cloud Based
15.5.2.1.2.
On Premise
15.5.2.2.
Argentina B2B Price Optimization and Management Software
Market Revenue (US$ Mn) and Forecasts, By Application
15.5.2.2.1.
Small and Medium Enterprises
15.5.2.2.2.
Large Enterprises
15.5.2.3.
Argentina B2B Price Optimization and Management Software
Market Revenue (US$ Mn) and Forecasts, By Industry Verticals
15.5.2.3.1.
Airlines and Travel
15.5.2.3.2.
Chemical
15.5.2.3.3.
Consumer Goods
15.5.2.3.4.
Energy
15.5.2.3.5.
Financial Services
15.5.2.3.6.
Food and Beverages
15.5.2.3.7.
Manufacturing
15.5.2.3.8.
Telecommunication
15.5.2.3.9.
Wholesale and Distribution
15.5.3.
Rest of Latin America
15.5.3.1.
Rest of Latin America B2B Price Optimization and Management
Software Market Revenue (US$ Mn) and Forecasts, By Deployment
15.5.3.1.1.
Cloud Based
15.5.3.1.2.
On Premise
15.5.3.2.
Rest of Latin America B2B Price Optimization and Management
Software Market Revenue (US$ Mn) and Forecasts, By Application
15.5.3.2.1.
Small and Medium Enterprises
15.5.3.2.2.
Large Enterprises
15.5.3.3.
Rest of Latin America B2B Price Optimization and Management
Software Market Revenue (US$ Mn) and Forecasts, By Industry Verticals
15.5.3.3.1.
Airlines and Travel
15.5.3.3.2.
Chemical
15.5.3.3.3.
Consumer Goods
15.5.3.3.4.
Energy
15.5.3.3.5.
Financial Services
15.5.3.3.6.
Food and Beverages
15.5.3.3.7.
Manufacturing
15.5.3.3.8.
Telecommunication
15.5.3.3.9.
Wholesale and Distribution
15.6. Key Segment
for Channeling Investments
15.6.1.
By Country
15.6.2.
By Deployment
15.6.3.
By Application
15.6.4.
By Industry Verticals
16. Competitive
Benchmarking
16.1. Market Share
Analysis, 2018
16.2. Global
Presence and Growth Strategies
16.2.1.
Mergers and Acquisitions
16.2.2.
Product Launches
16.2.3.
Investments Trends
16.2.4.
R&D Initiatives
17. Player
Profiles
17.1. Apttus
Corporation
17.1.1.
Company Details
17.1.2.
Company Overview
17.1.3.
Product Offerings
17.1.4.
Key Developments
17.1.5.
Financial Analysis
17.1.6.
SWOT Analysis
17.1.7.
Business Strategies
17.2. BlackCurve
Solutions Limited
17.2.1.
Company Details
17.2.2.
Company Overview
17.2.3.
Product Offerings
17.2.4.
Key Developments
17.2.5.
Financial Analysis
17.2.6.
SWOT Analysis
17.2.7.
Business Strategies
17.3. COMPETERA
LIMITED
17.3.1.
Company Details
17.3.2.
Company Overview
17.3.3.
Product Offerings
17.3.4.
Key Developments
17.3.5.
Financial Analysis
17.3.6.
SWOT Analysis
17.3.7.
Business Strategies
17.4. Flintfox
International Limited
17.4.1.
Company Details
17.4.2.
Company Overview
17.4.3.
Product Offerings
17.4.4.
Key Developments
17.4.5.
Financial Analysis
17.4.6.
SWOT Analysis
17.4.7.
Business Strategies
17.5. Vendavo, Inc.
17.5.1.
Company Details
17.5.2.
Company Overview
17.5.3.
Product Offerings
17.5.4.
Key Developments
17.5.5.
Financial Analysis
17.5.6.
SWOT Analysis
17.5.7.
Business Strategies
17.6. Perfect Price,
Inc.
17.6.1.
Company Details
17.6.2.
Company Overview
17.6.3.
Product Offerings
17.6.4.
Key Developments
17.6.5.
Financial Analysis
17.6.6.
SWOT Analysis
17.6.7.
Business Strategies
17.7. Periscope
(McKinsey & Company)
17.7.1.
Company Details
17.7.2.
Company Overview
17.7.3.
Product Offerings
17.7.4.
Key Developments
17.7.5.
Financial Analysis
17.7.6.
SWOT Analysis
17.7.7.
Business Strategies
17.8. Pricefx
17.8.1.
Company Details
17.8.2.
Company Overview
17.8.3.
Product Offerings
17.8.4.
Key Developments
17.8.5.
Financial Analysis
17.8.6.
SWOT Analysis
17.8.7.
Business Strategies
17.9. SPOSEA B.V.
17.9.1.
Company Details
17.9.2.
Company Overview
17.9.3.
Product Offerings
17.9.4.
Key Developments
17.9.5.
Financial Analysis
17.9.6.
SWOT Analysis
17.9.7.
Business Strategies
17.10. Syncron AB
17.10.1.
Company Details
17.10.2.
Company Overview
17.10.3.
Product Offerings
17.10.4.
Key Developments
17.10.5.
Financial Analysis
17.10.6.
SWOT Analysis
17.10.7.
Business Strategies
17.11. Vistaar
Technologies, Inc.
17.11.1.
Company Details
17.11.2.
Company Overview
17.11.3.
Product Offerings
17.11.4.
Key Developments
17.11.5.
Financial Analysis
17.11.6.
SWOT Analysis
17.11.7.
Business Strategies
17.12. Zilliant.
17.12.1.
Company Details
17.12.2.
Company Overview
17.12.3.
Product Offerings
17.12.4.
Key Developments
17.12.5.
Financial Analysis
17.12.6.
SWOT Analysis
17.12.7.
Business Strategies
17.13. Other Market Participants
18. Key Findings
At Absolute Markets Insights, we are engaged in building both global as well as country specific reports. As a result, the approach taken for deriving the estimation and forecast for a specific country is a bit unique and different in comparison to the global research studies. In this case, we not only study the concerned market factors & trends prevailing in a particular country (from secondary research) but we also tend to calculate the actual market size & forecast from the revenue generated from the market participants involved in manufacturing or distributing the any concerned product. These companies can also be service providers. For analyzing any country specifically, we do consider the growth factors prevailing under the states/cities/county for the same. For instance, if we are analyzing an industry specific to United States, we primarily need to study about the states present under the same(where the product/service has the highest growth). Similar analysis will be followed by other countries. Our scope of the report changes with different markets.
Our research study is mainly implement through a mix of both secondary and primary research. Various sources such as industry magazines, trade journals, and government websites and trade associations are reviewed for gathering precise data. Primary interviews are conducted to validate the market size derived from secondary research. Industry experts, major manufacturers and distributors are contacted for further validation purpose on the current market penetration and growth trends.
Prominent participants in our primary research process include:
- Key Opinion Leaders namely the CEOs, CSOs, VPs, purchasing managers, amongst others
- Research and development participants, distributors/suppliers and subject matter experts
Secondary Research includes data extracted from paid data sources:
- Reuters
- Factiva
- Bloomberg
- One Source
- Hoovers
Research Methodology

Key Inclusions


