
Agriculture Analytics Market By Application Area (Farm Analytics, Livestock Analytics, and Aquaculture Analytics), Component (Solution and Services), Farm Size (Small, Medium Sized, and Large); By Region (U.S., Canada, Mexico, UK, France, Germany, Italy, Spain, Benelux Union, Nordic Countries , Rest of Europe, China, Japan, India, South Korea, Singapore, Philippines, Indonesia, Thailand, Malaysia, Vietnam, Rest of Southeast Asia, Brazil, Argentina Rest of Latin America, Saudi Arabia, UAE, Egypt, Kuwait, Southern Africa, Rest of Middle East & Africa) – Global Insights, Growth, Size, Comparative Analysis, Trends and Forecast, 2019 - 2027
Industry Trends
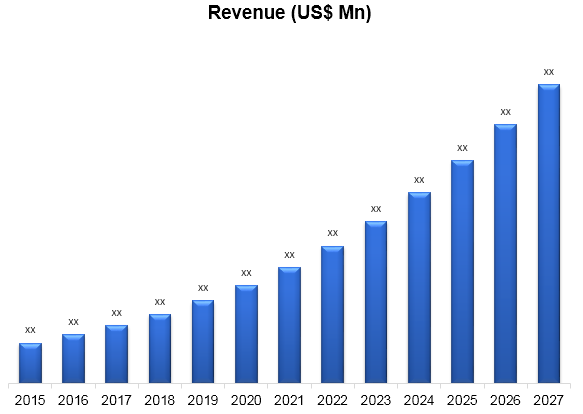
Global Agriculture Analytics Market was valued at US$ 576.32 million in 2018 and is expected to reach US$ 1676.9 million by 2027, growing at an estimated CAGR of 12.6% over the forecast period.
Smart agriculture is a component of agriculture analytics, which is the innovative implementation of science and technology across agricultural sector. Agriculture analytics refers to the adoption of techniques such as Big Data, IoT and other analytical instruments in the agricultural field. Government ventures to send contemporary rural strategies are the principle development driver for the agriculture analytics industry. In addition, increasing pressure to meet the increasing demand for food worldwide combined with the need to improve farm productivity leads to the implementation of agricultural analytics.
Application Insights
In terms of application, the agriculture analytics market has been segmented as farm analytics, livestock analytics and aquaculture analytics. The livestock analytics application segment is expected to project the highest CAGR during the forecast period. The application section of livestock analytics involves feeding management, heat stress management, dairy harvesting, breeding management, tracking and management of behaviours, and others (calf management, genetic management, and cattle sorting). Various daily tasks performed in livestock farming generate large volumes of critical animal data. Any mismanagement in the diet or animal tracking may lead in significant loss to farmers. Farmers are therefore investing in analytical solutions that assist them to manage their livestock cycle for the manufacturing of quality.
Raw data from farm management systems is extricated and fitted into an information space model that has been thoroughly intended to encourage its control and examination. This procedure is called ETL: Extract, Transform, and Load. The information model contains various substances, which exclusively embody a cultivating idea (items, fields, farms, planting zones, crop types, field tasks) and by and large incorporate to portray farming exercises. The model twists around field undertakings, for instance, entering (planting), crop security (pesticide application), sustenance (fertilizer application), and collect yield (accumulate exercises). This data model is populated by a considerable number records in order to make a data lake, holding significant information arranged for being addressed and found.
Component Insights
In terms of component, the agriculture analytics market has been segmented as solution and services. Cloud computing is one application that farmers can use to better manage crops and their business through its application called software-as-a-service (Saas). In this sector, start-up firms are developing business applications that are specifically helpful to the agricultural sector. Some of these applications are such that farmers can create budgets and operational schedules as per production plans. The farming-specific software is available, through which workforce management can become more efficient. Work plans against weather forecast can also be chalked out, and progress is monitored. Mobile task management tools and data integration techniques are available, that will measure machine operations and production. Apart from this, there is also an analytics software that helps farmers track costs, production yields and profits against benchmarked values. This is a technology that many sectors use, but in this case, it is tailored for farm production.
Farm Size Insights
In terms of farm size, the agriculture analytics market has been segmented as small, medium and large sized farms. Mechanical applications for agriculture are developing exponentially, which offers promising answers for Smart Farming in dealing with work deficiency and a long-term declining benefit; notwithstanding, as most advancements, there exist significant constraints to adapt to at the current beginning times. These advances are still unreasonably costly for most ranchers, particularly those with little estates since scale money related issues make minimal individual residences less beneficial. The expense of innovation diminishes with time, and rural robots will be most likely executed later on as the choice to realize higher creation.
Region Insights
In agriculture analytics market, it is anticipated that North America will hold the biggest share from 2020 to 2027 and dominate this industry. The region has mostly large ranches with top tier cultivating apparatus, which contributes altogether to the advancement of the market. APAC is anticipated to provide profitable possibilities for agriculture analytics suppliers due to growing investment in digital farming methods and cloud-based solutions among farmers in the region. Inability to institutionalize data in various territories, notwithstanding, could impact the usage of an answer for agrarian examination.
Agriculture Analytics Market Revenue & Forecast, (US$ Million), 2015 – 2027
Competitive Landscape
The report provides both, qualitative and quantitative research of agriculture analytics market, as well as provides comprehensive insights and development methods adopted by the key contenders. The report also offers extensive research on the key players in this market and details on the competitiveness of these players. Key business strategies such as mergers and acquisitions (M&A), affiliations, collaborations, and contracts adopted by these major market participants are also recognized and analysed in the report. For each company, the report studies their global presence, competitors, service offerings and specification amongst others.
IBM Corporation, Deere & Company, SAP SE, Trimble Inc., Accenture, Monsanto Company, Oracle, Taranis, and Iteris, Inc. are some of the players operating in the global agriculture analytics market.

Agriculture Analytics Market:
- By Application Area
- Farm Analytics
- Livestock Analytics
- Aquaculture Analytics
- By Component
- Solution
- Services
- By Farm Size
- Small
- Medium Sized
- Large
- By Geography
- North America
- US
- Canada
- Mexico
- Europe
- France
- The UK
- Spain
- Germany
- Italy
- Nordic Countries
- Denmark
- Finland
- Iceland
- Sweden
- Norway
- Benelux Union
- Belgium
- The Netherlands
- Luxembourg
- Rest of Europe
- Asia Pacific
- China
- Japan
- India
- New Zealand
- Australia
- South Korea
- Southeast Asia
- Indonesia
- Thailand
- Malaysia
- Singapore
- Rest of Southeast Asia
- Rest of Asia Pacific
- Middle East and Africa
- Saudi Arabia
- UAE
- Egypt
- Kuwait
- South Africa
- Rest of Middle East & Africa
- Latin America
- Brazil
- Argentina
- Rest of Latin America
- North America
1.
Market Scope
1.1. Market
Segmentation
1.2. Years
Considered
1.2.1. Historic
Years: 2013 - 2017
1.2.2. Base
Year: 2018
1.2.3. Forecast
Years: 2019 – 2027
2.
Key Target Audiences
3.
Research Methodology
3.1. Primary
Research
3.1.1. Research
Questionnaire
3.1.2. Global
Percentage Breakdown
3.1.3. Primary
Interviews: Key Opinion Leaders (KOLs)
3.2. Secondary
Research
3.2.1. Paid
Databases
3.2.2. Secondary
Sources
3.3. Market
Size Estimates
3.3.1. Top-Down
Approach
3.3.2. Bottom-Up
Approach
3.4. Data
Triangulation Methodology
3.5. Research
Assumptions
4.
Recommendations and
Insights from AMI’s Perspective**
5.
Holistic Overview of
Agriculture Analytics Market
6.
Market Synopsis: Agriculture Analytics Market
7.
Agriculture Analytics
Market Analysis: Qualitative Perspective
7.1. Introduction
7.1.1. Product
Definition
7.1.2. Industry
Development
7.2. Market
Dynamics
7.2.1. Drivers
7.2.2. Restraints
7.2.3. Opportunities
7.3. Trends in
Agriculture Analytics Market
7.4. Market
Determinants Radar Chart
7.5. Macro-Economic
and Micro-Economic Indicators: Agriculture Analytics Market
7.6. Porter’s
Five Force Analysis
8.
Global Agriculture
Analytics Market Analysis and Forecasts, 2019 – 2027
8.1. Overview
8.1.1. Global
Agriculture Analytics Market Revenue (US$ Mn)
8.2. Global
Agriculture Analytics Market Revenue (US$ Mn) and Forecasts, By Application
Area
8.2.1. Farm
Analytics
8.2.1.1. Definition
8.2.1.2. Market Estimation and Penetration, 2013 – 2018
8.2.1.3. Market Forecast, 2019 – 2027
8.2.1.4. Compound Annual Growth Rate (CAGR)
8.2.1.5. Regional Bifurcation
8.2.1.5.1. North America
8.2.1.5.1.1. Market
Estimation, 2013 – 2018
8.2.1.5.1.2. Market
Forecast, 2019 – 2027
8.2.1.5.2. Europe
8.2.1.5.2.1. Market
Estimation, 2013 – 2018
8.2.1.5.2.2. Market
Forecast, 2019 – 2027
8.2.1.5.3. Asia Pacific
8.2.1.5.3.1. Market
Estimation, 2013 – 2018
8.2.1.5.3.2. Market
Forecast, 2019 – 2027
8.2.1.5.4. Middle East and Africa
8.2.1.5.4.1. Market
Estimation, 2013 – 2018
8.2.1.5.4.2. Market
Forecast, 2019 – 2027
8.2.1.5.5. Latin America
8.2.1.5.5.1. Market
Estimation, 2013 – 2018
8.2.1.5.5.2. Market
Forecast, 2019 – 2027
8.2.2. Livestock
Analytics
8.2.2.1. Definition
8.2.2.2. Market Estimation and Penetration, 2013 – 2018
8.2.2.3. Market Forecast, 2019 – 2027
8.2.2.4. Compound Annual Growth Rate (CAGR)
8.2.2.5. Regional Bifurcation
8.2.2.5.1. North America
8.2.2.5.1.1. Market
Estimation, 2013 – 2018
8.2.2.5.1.2. Market
Forecast, 2019 – 2027
8.2.2.5.2. Europe
8.2.2.5.2.1. Market
Estimation, 2013 – 2018
8.2.2.5.2.2. Market
Forecast, 2019 – 2027
8.2.2.5.3. Asia Pacific
8.2.2.5.3.1. Market
Estimation, 2013 – 2018
8.2.2.5.3.2. Market
Forecast, 2019 – 2027
8.2.2.5.4. Middle East and Africa
8.2.2.5.4.1. Market
Estimation, 2013 – 2018
8.2.2.5.4.2. Market
Forecast, 2019 – 2027
8.2.2.5.5. Latin America
8.2.2.5.5.1. Market
Estimation, 2013 – 2018
8.2.2.5.5.2. Market
Forecast, 2019 – 2027
8.2.3. Aquaculture
Analytics
8.2.3.1. Definition
8.2.3.2. Market Estimation and Penetration, 2013 – 2018
8.2.3.3. Market Forecast, 2019 – 2027
8.2.3.4. Compound Annual Growth Rate (CAGR)
8.2.3.5. Regional Bifurcation
8.2.3.5.1. North America
8.2.3.5.1.1. Market
Estimation, 2013 – 2018
8.2.3.5.1.2. Market
Forecast, 2019 – 2027
8.2.3.5.2. Europe
8.2.3.5.2.1. Market
Estimation, 2013 – 2018
8.2.3.5.2.2. Market
Forecast, 2019 – 2027
8.2.3.5.3. Asia Pacific
8.2.3.5.3.1. Market
Estimation, 2013 – 2018
8.2.3.5.3.2. Market
Forecast, 2019 – 2027
8.2.3.5.4. Middle East and Africa
8.2.3.5.4.1. Market
Estimation, 2013 – 2018
8.2.3.5.4.2. Market
Forecast, 2019 – 2027
8.2.3.5.5. Latin America
8.2.3.5.5.1. Market
Estimation, 2013 – 2018
8.2.3.5.5.2. Market
Forecast, 2019 – 2027
8.3. Key
Segment for Channeling Investments
8.3.1. By
Application Area
9.
Global Agriculture
Analytics Market Analysis and Forecasts, 2019 – 2027
9.1. Overview
9.2. Global
Agriculture Analytics Market Revenue (US$ Mn) and Forecasts, By Component
9.2.1. Solution
9.2.1.1. Definition
9.2.1.2. Market Estimation and Penetration, 2013 – 2018
9.2.1.3. Market Forecast, 2019 – 2027
9.2.1.4. Compound Annual Growth Rate (CAGR)
9.2.1.5. Regional Bifurcation
9.2.1.5.1. North America
9.2.1.5.1.1. Market
Estimation, 2013 – 2018
9.2.1.5.1.2. Market
Forecast, 2019 – 2027
9.2.1.5.2. Europe
9.2.1.5.2.1. Market
Estimation, 2013 – 2018
9.2.1.5.2.2. Market
Forecast, 2019 – 2027
9.2.1.5.3. Asia Pacific
9.2.1.5.3.1. Market
Estimation, 2013 – 2018
9.2.1.5.3.2. Market
Forecast, 2019 – 2027
9.2.1.5.4. Middle East and Africa
9.2.1.5.4.1. Market
Estimation, 2013 – 2018
9.2.1.5.4.2. Market
Forecast, 2019 – 2027
9.2.1.5.5. Latin America
9.2.1.5.5.1. Market
Estimation, 2013 – 2018
9.2.1.5.5.2. Market
Forecast, 2019 – 2027
9.2.2. Services
9.2.2.1. Definition
9.2.2.2. Market Estimation and Penetration, 2013 – 2018
9.2.2.3. Market Forecast, 2019 – 2027
9.2.2.4. Compound Annual Growth Rate (CAGR)
9.2.2.5. Regional Bifurcation
9.2.2.5.1. North America
9.2.2.5.1.1. Market
Estimation, 2013 – 2018
9.2.2.5.1.2. Market
Forecast, 2019 – 2027
9.2.2.5.2. Europe
9.2.2.5.2.1. Market
Estimation, 2013 – 2018
9.2.2.5.2.2. Market
Forecast, 2019 – 2027
9.2.2.5.3. Asia Pacific
9.2.2.5.3.1. Market
Estimation, 2013 – 2018
9.2.2.5.3.2. Market
Forecast, 2019 – 2027
9.2.2.5.4. Middle East and Africa
9.2.2.5.4.1. Market
Estimation, 2013 – 2018
9.2.2.5.4.2. Market
Forecast, 2019 – 2027
9.2.2.5.5. Latin America
9.2.2.5.5.1. Market
Estimation, 2013 – 2018
9.2.2.5.5.2. Market
Forecast, 2019 – 2027
9.3. Key
Segment for Channeling Investments
9.3.1. By
Component
10.
Global Agriculture
Analytics Market Analysis and Forecasts, 2019 – 2027
10.1. Overview
10.2. Global
Agriculture Analytics Market Revenue (US$ Mn) and Forecasts, By Farm Size
10.2.1. Small
10.2.1.1. Definition
10.2.1.2. Market Estimation and Penetration, 2013 – 2018
10.2.1.3. Market Forecast, 2019 – 2027
10.2.1.4. Compound Annual Growth Rate (CAGR)
10.2.1.5. Regional Bifurcation
10.2.1.5.1. North America
10.2.1.5.1.1. Market
Estimation, 2013 – 2018
10.2.1.5.1.2. Market
Forecast, 2019 – 2027
10.2.1.5.2. Europe
10.2.1.5.2.1. Market
Estimation, 2013 – 2018
10.2.1.5.2.2. Market
Forecast, 2019 – 2027
10.2.1.5.3. Asia Pacific
10.2.1.5.3.1. Market
Estimation, 2013 – 2018
10.2.1.5.3.2. Market
Forecast, 2019 – 2027
10.2.1.5.4. Middle East and Africa
10.2.1.5.4.1. Market
Estimation, 2013 – 2018
10.2.1.5.4.2. Market
Forecast, 2019 – 2027
10.2.1.5.5. Latin America
10.2.1.5.5.1. Market
Estimation, 2013 – 2018
10.2.1.5.5.2. Market
Forecast, 2019 – 2027
10.2.2. Medium
Sized
10.2.2.1. Definition
10.2.2.2. Market Estimation and Penetration, 2013 – 2018
10.2.2.3. Market Forecast, 2019 – 2027
10.2.2.4. Compound Annual Growth Rate (CAGR)
10.2.2.5. Regional Bifurcation
10.2.2.5.1. North America
10.2.2.5.1.1. Market
Estimation, 2013 – 2018
10.2.2.5.1.2. Market
Forecast, 2019 – 2027
10.2.2.5.2. Europe
10.2.2.5.2.1. Market
Estimation, 2013 – 2018
10.2.2.5.2.2. Market
Forecast, 2019 – 2027
10.2.2.5.3. Asia Pacific
10.2.2.5.3.1. Market
Estimation, 2013 – 2018
10.2.2.5.3.2. Market
Forecast, 2019 – 2027
10.2.2.5.4. Middle East and Africa
10.2.2.5.4.1. Market
Estimation, 2013 – 2018
10.2.2.5.4.2. Market
Forecast, 2019 – 2027
10.2.2.5.5. Latin America
10.2.2.5.5.1. Market
Estimation, 2013 – 2018
10.2.2.5.5.2. Market
Forecast, 2019 – 2027
10.2.3. Large
10.2.3.1. Definition
10.2.3.2. Market Estimation and Penetration, 2013 – 2018
10.2.3.3. Market Forecast, 2019 – 2027
10.2.3.4. Compound Annual Growth Rate (CAGR)
10.2.3.5. Regional Bifurcation
10.2.3.5.1. North America
10.2.3.5.1.1. Market
Estimation, 2013 – 2018
10.2.3.5.1.2. Market
Forecast, 2019 – 2027
10.2.3.5.2. Europe
10.2.3.5.2.1. Market
Estimation, 2013 – 2018
10.2.3.5.2.2. Market
Forecast, 2019 – 2027
10.2.3.5.3. Asia Pacific
10.2.3.5.3.1. Market
Estimation, 2013 – 2018
10.2.3.5.3.2. Market
Forecast, 2019 – 2027
10.2.3.5.4. Middle East and Africa
10.2.3.5.4.1. Market
Estimation, 2013 – 2018
10.2.3.5.4.2. Market
Forecast, 2019 – 2027
10.2.3.5.5. Latin America
10.2.3.5.5.1. Market
Estimation, 2013 – 2018
10.2.3.5.5.2. Market
Forecast, 2019 – 2027
10.3. Key
Segment for Channeling Investments
10.3.1. By Farm
Size
11.
North America Agriculture
Analytics Market Analysis and Forecasts, 2019 - 2027
11.1. Overview
11.1.1. North
America Agriculture Analytics Market Revenue (US$ Mn)
11.2. North
America Agriculture Analytics Market Revenue (US$ Mn) and Forecasts, By
Application Area
11.2.1. Farm
Analytics
11.2.2. Livestock
Analytics
11.2.3. Aquaculture
Analytics
11.3. North
America Agriculture Analytics Market Revenue (US$ Mn) and Forecasts, By
Component
11.3.1. Solution
11.3.2. Services
11.4. North
America Agriculture Analytics Market Revenue (US$ Mn) and Forecasts, By Farm
Size
11.4.1. Small
11.4.2. Medium
Sized
11.4.3. Large
11.5. North
America Agriculture Analytics Market Revenue (US$ Mn) and Forecasts, By Country
11.5.1. U.S
11.5.1.1. U.S Agriculture Analytics Market Revenue (US$ Mn) and
Forecasts, By Application Area
11.5.1.1.1. Farm Analytics
11.5.1.1.2. Livestock Analytics
11.5.1.1.3. Aquaculture Analytics
11.5.1.2. U.S Agriculture Analytics Market Revenue (US$ Mn) and Forecasts,
By Component
11.5.1.2.1. Solution
11.5.1.2.2. Services
11.5.1.3. U.S Agriculture Analytics Market Revenue (US$ Mn) and
Forecasts, By Farm Size
11.5.1.3.1. Small
11.5.1.3.2. Medium Sized
11.5.1.3.3. Large
11.5.2. Canada
11.5.2.1. Canada Agriculture Analytics Market Revenue (US$ Mn) and
Forecasts, By Application Area
11.5.2.1.1. Farm Analytics
11.5.2.1.2. Livestock Analytics
11.5.2.1.3. Aquaculture Analytics
11.5.2.2. Canada Agriculture Analytics Market Revenue (US$ Mn) and
Forecasts, By Component
11.5.2.2.1. Solution
11.5.2.2.2. Services
11.5.2.3. Canada Agriculture Analytics Market Revenue (US$ Mn) and
Forecasts, By Farm Size
11.5.2.3.1. Small
11.5.2.3.2. Medium Sized
11.5.2.3.3. Large
11.5.3. Mexico
11.5.3.1. Mexico Agriculture Analytics Market Revenue (US$ Mn) and
Forecasts, By Application Area
11.5.3.1.1. Farm Analytics
11.5.3.1.2. Livestock Analytics
11.5.3.1.3. Aquaculture Analytics
11.5.3.2. Mexico Agriculture Analytics Market Revenue (US$ Mn) and
Forecasts, By Component
11.5.3.2.1. Solution
11.5.3.2.2. Services
11.5.3.3. Mexico Agriculture Analytics Market Revenue (US$ Mn) and
Forecasts, By Farm Size
11.5.3.3.1. Small
11.5.3.3.2. Medium Sized
11.5.3.3.3. Large
11.5.4. Rest of
North America
11.5.4.1. Rest of North America Agriculture Analytics Market Revenue
(US$ Mn) and Forecasts, By Application Area
11.5.4.1.1. Farm Analytics
11.5.4.1.2. Livestock Analytics
11.5.4.1.3. Aquaculture Analytics
11.5.4.2. Rest of North America Agriculture Analytics Market Revenue
(US$ Mn) and Forecasts, By Component
11.5.4.2.1. Solution
11.5.4.2.2. Services
11.5.4.3. Rest of North America Agriculture Analytics Market Revenue
(US$ Mn) and Forecasts, By Farm Size
11.5.4.3.1. Small
11.5.4.3.2. Medium Sized
11.5.4.3.3. Large
11.6. Key
Segment for Channeling Investments
11.6.1. By
Country
11.6.2. By
Application Area
11.6.3. By
Component
11.6.4. By Farm
Size
12.
Europe Agriculture
Analytics Market Analysis and Forecasts, 2019 - 2027
12.1. Overview
12.1.1. Europe
Agriculture Analytics Market Revenue (US$ Mn)
12.2. Europe
Agriculture Analytics Market Revenue (US$ Mn) and Forecasts, By Application
Area
12.2.1. Farm
Analytics
12.2.2. Livestock
Analytics
12.2.3. Aquaculture
Analytics
12.3. Europe
Agriculture Analytics Market Revenue (US$ Mn) and Forecasts, By Component
12.3.1. Solution
12.3.2. Services
12.4. Europe
Agriculture Analytics Market Revenue (US$ Mn) and Forecasts, By Farm Size
12.4.1. Small
12.4.2. Medium
Sized
12.4.3. Large
12.5. Europe
Agriculture Analytics Market Revenue (US$ Mn) and Forecasts, By Country
12.5.1. France
12.5.1.1. France Agriculture Analytics Market Revenue (US$ Mn) and
Forecasts, By Application Area
12.5.1.1.1. Farm Analytics
12.5.1.1.2. Livestock Analytics
12.5.1.1.3. Aquaculture Analytics
12.5.1.2. France Agriculture Analytics Market Revenue (US$ Mn) and
Forecasts, By Component
12.5.1.2.1. Solution
12.5.1.2.2. Services
12.5.1.3. France Agriculture Analytics Market Revenue (US$ Mn) and
Forecasts, By Farm Size
12.5.1.3.1. Small
12.5.1.3.2. Medium Sized
12.5.1.3.3. Large
12.5.2. The UK
12.5.2.1. The UK Agriculture Analytics Market Revenue (US$ Mn) and
Forecasts, By Application Area
12.5.2.1.1. Farm Analytics
12.5.2.1.2. Livestock Analytics
12.5.2.1.3. Aquaculture Analytics
12.5.2.2. The UK Agriculture Analytics Market Revenue (US$ Mn) and
Forecasts, By Component
12.5.2.2.1. Solution
12.5.2.2.2. Services
12.5.2.3. The UK Agriculture Analytics Market Revenue (US$ Mn) and
Forecasts, By Farm Size
12.5.2.3.1. Small
12.5.2.3.2. Medium Sized
12.5.2.3.3. Large
12.5.3. Spain
12.5.3.1. Spain Agriculture Analytics Market Revenue (US$ Mn) and
Forecasts, By Application Area
12.5.3.1.1. Farm Analytics
12.5.3.1.2. Livestock Analytics
12.5.3.1.3. Aquaculture Analytics
12.5.3.2. Spain Agriculture Analytics Market Revenue (US$ Mn) and
Forecasts, By Component
12.5.3.2.1. Solution
12.5.3.2.2. Services
12.5.3.3. Spain Agriculture Analytics Market Revenue (US$ Mn) and
Forecasts, By Farm Size
12.5.3.3.1. Small
12.5.3.3.2. Medium Sized
12.5.3.3.3. Large
12.5.4. Germany
12.5.4.1. Germany Agriculture Analytics Market Revenue (US$ Mn) and
Forecasts, By Application Area
12.5.4.1.1. Farm Analytics
12.5.4.1.2. Livestock Analytics
12.5.4.1.3. Aquaculture Analytics
12.5.4.2. Germany Agriculture Analytics Market Revenue (US$ Mn) and
Forecasts, By Component
12.5.4.2.1. Solution
12.5.4.2.2. Services
12.5.4.3. Germany Agriculture Analytics Market Revenue (US$ Mn) and
Forecasts, By Farm Size
12.5.4.3.1. Small
12.5.4.3.2. Medium Sized
12.5.4.3.3. Large
12.5.5. Italy
12.5.5.1. Italy Agriculture Analytics Market Revenue (US$ Mn) and
Forecasts, By Application Area
12.5.5.1.1. Farm Analytics
12.5.5.1.2. Livestock Analytics
12.5.5.1.3. Aquaculture Analytics
12.5.5.2. Italy Agriculture Analytics Market Revenue (US$ Mn) and
Forecasts, By Component
12.5.5.2.1. Solution
12.5.5.2.2. Services
12.5.5.3. Italy Agriculture Analytics Market Revenue (US$ Mn) and
Forecasts, By Farm Size
12.5.5.3.1. Small
12.5.5.3.2. Medium Sized
12.5.5.3.3. Large
12.5.6. Nordic
Countries
12.5.6.1. Nordic Countries Agriculture Analytics Market Revenue (US$ Mn)
and Forecasts, By Application Area
12.5.6.1.1. Farm Analytics
12.5.6.1.2. Livestock Analytics
12.5.6.1.3. Aquaculture Analytics
12.5.6.2. Nordic Countries Agriculture Analytics Market Revenue (US$ Mn)
and Forecasts, By Component
12.5.6.2.1. Solution
12.5.6.2.2. Services
12.5.6.3. Nordic Countries Agriculture Analytics Market Revenue (US$ Mn)
and Forecasts, By Farm Size
12.5.6.3.1. Small
12.5.6.3.2. Medium Sized
12.5.6.3.3. Large
12.5.6.4. Nordic Countries Agriculture Analytics Market Revenue (US$ Mn)
and Forecasts, By Country
12.5.6.4.1. Denmark
12.5.6.4.2. Finland
12.5.6.4.3. Iceland
12.5.6.4.4. Sweden
12.5.6.4.5. Norway
12.5.7. Benelux
Union
12.5.7.1. Benelux Union Agriculture Analytics Market Revenue (US$ Mn)
and Forecasts, By Application Area
12.5.7.1.1. Farm Analytics
12.5.7.1.2. Livestock Analytics
12.5.7.1.3. Aquaculture Analytics
12.5.7.2. Benelux Union Agriculture Analytics Market Revenue (US$ Mn)
and Forecasts, By Component
12.5.7.2.1. Solution
12.5.7.2.2. Services
12.5.7.3. Benelux Union Agriculture Analytics Market Revenue (US$ Mn)
and Forecasts, By Farm Size
12.5.7.3.1. Small
12.5.7.3.2. Medium Sized
12.5.7.3.3. Large
12.5.7.4. Benelux Union Agriculture Analytics Market Revenue (US$ Mn)
and Forecasts, By Country
12.5.7.4.1. Belgium
12.5.7.4.2. The Netherlands
12.5.7.4.3. Luxembourg
12.5.8. Rest of
Europe
12.5.8.1. Rest of Europe Agriculture Analytics Market Revenue (US$ Mn)
and Forecasts, By Application Area
12.5.8.1.1. Farm Analytics
12.5.8.1.2. Livestock Analytics
12.5.8.1.3. Aquaculture Analytics
12.5.8.2. Rest of Europe Agriculture Analytics Market Revenue (US$ Mn)
and Forecasts, By Component
12.5.8.2.1. Solution
12.5.8.2.2. Services
12.5.8.3. Rest of Europe Agriculture Analytics Market Revenue (US$ Mn)
and Forecasts, By Farm Size
12.5.8.3.1. Small
12.5.8.3.2. Medium Sized
12.5.8.3.3. Large
12.6. Key
Segment for Channeling Investments
12.6.1. By
Country
12.6.2. By
Application Area
12.6.3. By
Component
12.6.4. By Farm
Size
13.
Asia Pacific Agriculture
Analytics Market Analysis and Forecasts, 2019 - 2027
13.1. Overview
13.1.1. Asia
Pacific Agriculture Analytics Market Revenue (US$ Mn)
13.2. Asia
Pacific Agriculture Analytics Market Revenue (US$ Mn) and Forecasts, By
Application Area
13.2.1. Farm
Analytics
13.2.2. Livestock
Analytics
13.2.3. Aquaculture
Analytics
13.3. Asia
Pacific Agriculture Analytics Market Revenue (US$ Mn) and Forecasts, By
Component
13.3.1. Solution
13.3.2. Services
13.4. Asia
Pacific Agriculture Analytics Market Revenue (US$ Mn) and Forecasts, By Farm
Size
13.4.1. Small
13.4.2. Medium
Sized
13.4.3. Large
13.5. Asia
Pacific Agriculture Analytics Market Revenue (US$ Mn) and Forecasts, By Country
13.5.1. China
13.5.1.1. China Agriculture Analytics Market Revenue (US$ Mn) and
Forecasts, By Application Area
13.5.1.1.1. Farm Analytics
13.5.1.1.2. Livestock Analytics
13.5.1.1.3. Aquaculture Analytics
13.5.1.2. China Agriculture Analytics Market Revenue (US$ Mn) and
Forecasts, By Component
13.5.1.2.1. Solution
13.5.1.2.2. Services
13.5.1.3. China Agriculture Analytics Market Revenue (US$ Mn) and
Forecasts, By Farm Size
13.5.1.3.1. Small
13.5.1.3.2. Medium Sized
13.5.1.3.3. Large
13.5.2. Japan
13.5.2.1. Japan Agriculture Analytics Market Revenue (US$ Mn) and
Forecasts, By Application Area
13.5.2.1.1. Farm Analytics
13.5.2.1.2. Livestock Analytics
13.5.2.1.3. Aquaculture Analytics
13.5.2.2. Japan Agriculture Analytics Market Revenue (US$ Mn) and
Forecasts, By Component
13.5.2.2.1. Solution
13.5.2.2.2. Services
13.5.2.3. Japan Agriculture Analytics Market Revenue (US$ Mn) and
Forecasts, By Farm Size
13.5.2.3.1. Small
13.5.2.3.2. Medium Sized
13.5.2.3.3. Large
13.5.3. India
13.5.3.1. India Agriculture Analytics Market Revenue (US$ Mn) and
Forecasts, By Application Area
13.5.3.1.1. Farm Analytics
13.5.3.1.2. Livestock Analytics
13.5.3.1.3. Aquaculture Analytics
13.5.3.2. India Agriculture Analytics Market Revenue (US$ Mn) and
Forecasts, By Component
13.5.3.2.1. Solution
13.5.3.2.2. Services
13.5.3.3. India Agriculture Analytics Market Revenue (US$ Mn) and
Forecasts, By Farm Size
13.5.3.3.1. Small
13.5.3.3.2. Medium Sized
13.5.3.3.3. Large
13.5.4. New
Zealand
13.5.4.1. New Zealand Agriculture Analytics Market Revenue (US$ Mn) and
Forecasts, By Application Area
13.5.4.1.1. Farm Analytics
13.5.4.1.2. Livestock Analytics
13.5.4.1.3. Aquaculture Analytics
13.5.4.2. New Zealand Agriculture Analytics Market Revenue (US$ Mn) and
Forecasts, By Component
13.5.4.2.1. Solution
13.5.4.2.2. Services
13.5.4.3. New Zealand Agriculture Analytics Market Revenue (US$ Mn) and
Forecasts, By Farm Size
13.5.4.3.1. Small
13.5.4.3.2. Medium Sized
13.5.4.3.3. Large
13.5.5. Australia
13.5.5.1. Australia Agriculture Analytics Market Revenue (US$ Mn) and
Forecasts, By Application Area
13.5.5.1.1. Farm Analytics
13.5.5.1.2. Livestock Analytics
13.5.5.1.3. Aquaculture Analytics
13.5.5.2. Australia Agriculture Analytics Market Revenue (US$ Mn) and
Forecasts, By Component
13.5.5.2.1. Solution
13.5.5.2.2. Services
13.5.5.3. Australia Agriculture Analytics Market Revenue (US$ Mn) and
Forecasts, By Farm Size
13.5.5.3.1. Small
13.5.5.3.2. Medium Sized
13.5.5.3.3. Large
13.5.6. South
Korea
13.5.6.1. South Korea Agriculture Analytics Market Revenue (US$ Mn) and
Forecasts, By Application Area
13.5.6.1.1. Farm Analytics
13.5.6.1.2. Livestock Analytics
13.5.6.1.3. Aquaculture Analytics
13.5.6.2. South Korea Agriculture Analytics Market Revenue (US$ Mn) and
Forecasts, By Component
13.5.6.2.1. Solution
13.5.6.2.2. Services
13.5.6.3. South Korea Agriculture Analytics Market Revenue (US$ Mn) and
Forecasts, By Farm Size
13.5.6.3.1. Small
13.5.6.3.2. Medium Sized
13.5.6.3.3. Large
13.5.7. Southeast
Asia
13.5.7.1. Southeast Asia Agriculture Analytics Market Revenue (US$ Mn)
and Forecasts, By Application Area
13.5.7.1.1. Farm Analytics
13.5.7.1.2. Livestock Analytics
13.5.7.1.3. Aquaculture Analytics
13.5.7.2. Southeast Asia Agriculture Analytics Market Revenue (US$ Mn)
and Forecasts, By Component
13.5.7.2.1. Solution
13.5.7.2.2. Services
13.5.7.3. Southeast Asia Agriculture Analytics Market Revenue (US$ Mn)
and Forecasts, By Farm Size
13.5.7.3.1. Small
13.5.7.3.2. Medium Sized
13.5.7.3.3. Large
13.5.7.4. Southeast Asia Agriculture Analytics Market Revenue (US$ Mn)
and Forecasts, By Country
13.5.7.4.1. Indonesia
13.5.7.4.2. Thailand
13.5.7.4.3. Malaysia
13.5.7.4.4. Singapore
13.5.7.4.5. Rest of Southeast Asia
13.5.8. Rest of
Asia Pacific
13.5.8.1. Rest of Asia Pacific Agriculture Analytics Market Revenue (US$
Mn) and Forecasts, By Application Area
13.5.8.1.1. Farm Analytics
13.5.8.1.2. Livestock Analytics
13.5.8.1.3. Aquaculture Analytics
13.5.8.2. Rest of Asia Pacific Agriculture Analytics Market Revenue (US$
Mn) and Forecasts, By Component
13.5.8.2.1. Solution
13.5.8.2.2. Services
13.5.8.3. Rest of Asia Pacific Agriculture Analytics Market Revenue (US$
Mn) and Forecasts, By Farm Size
13.5.8.3.1. Small
13.5.8.3.2. Medium Sized
13.5.8.3.3. Large
13.6. Key
Segment for Channeling Investments
13.6.1. By
Country
13.6.2. By
Application Area
13.6.3. By
Component
13.6.4. By Farm
Size
14.
Middle East and Africa
Agriculture Analytics Market Analysis and Forecasts, 2019 - 2027
14.1. Overview
14.1.1. Middle
East and Africa Agriculture Analytics Market Revenue (US$ Mn)
14.2. Middle
East and Africa Agriculture Analytics Market Revenue (US$ Mn) and Forecasts, By
Application Area
14.2.1. Farm
Analytics
14.2.2. Livestock
Analytics
14.2.3. Aquaculture
Analytics
14.3. Middle
East and Africa Agriculture Analytics Market Revenue (US$ Mn) and Forecasts, By
Component
14.3.1. Solution
14.3.2. Services
14.4. Middle
East and Africa Agriculture Analytics Market Revenue (US$ Mn) and Forecasts, By
Farm Size
14.4.1. Small
14.4.2. Medium
Sized
14.4.3. Large
14.5. Middle
East and Africa Agriculture Analytics Market Revenue (US$ Mn) and Forecasts, By
Country
14.5.1. Saudi
Arabia
14.5.1.1. Saudi Arabia Agriculture Analytics Market Revenue (US$ Mn) and
Forecasts, By Application Area
14.5.1.1.1. Farm Analytics
14.5.1.1.2. Livestock Analytics
14.5.1.1.3. Aquaculture Analytics
14.5.1.2. Saudi Arabia Agriculture Analytics Market Revenue (US$ Mn) and
Forecasts, By Component
14.5.1.2.1. Solution
14.5.1.2.2. Services
14.5.1.3. Saudi Arabia Agriculture Analytics Market Revenue (US$ Mn) and
Forecasts, By Farm Size
14.5.1.3.1. Small
14.5.1.3.2. Medium Sized
14.5.1.3.3. Large
14.5.2. UAE
14.5.2.1. UAE Agriculture Analytics Market Revenue (US$ Mn) and
Forecasts, By Application Area
14.5.2.1.1. Farm Analytics
14.5.2.1.2. Livestock Analytics
14.5.2.1.3. Aquaculture Analytics
14.5.2.2. UAE Agriculture Analytics Market Revenue (US$ Mn) and
Forecasts, By Component
14.5.2.2.1. Solution
14.5.2.2.2. Services
14.5.2.3. UAE Agriculture Analytics Market Revenue (US$ Mn) and
Forecasts, By Farm Size
14.5.2.3.1. Small
14.5.2.3.2. Medium Sized
14.5.2.3.3. Large
14.5.3. Egypt
14.5.3.1. Egypt Agriculture Analytics Market Revenue (US$ Mn) and
Forecasts, By Application Area
14.5.3.1.1. Farm Analytics
14.5.3.1.2. Livestock Analytics
14.5.3.1.3. Aquaculture Analytics
14.5.3.2. Egypt Agriculture Analytics Market Revenue (US$ Mn) and
Forecasts, By Component
14.5.3.2.1. Solution
14.5.3.2.2. Services
14.5.3.3. Egypt Agriculture Analytics Market Revenue (US$ Mn) and
Forecasts, By Farm Size
14.5.3.3.1. Small
14.5.3.3.2. Medium Sized
14.5.3.3.3. Large
14.5.4. Kuwait
14.5.4.1. Kuwait Agriculture Analytics Market Revenue (US$ Mn) and
Forecasts, By Application Area
14.5.4.1.1. Farm Analytics
14.5.4.1.2. Livestock Analytics
14.5.4.1.3. Aquaculture Analytics
14.5.4.2. Kuwait Agriculture Analytics Market Revenue (US$ Mn) and
Forecasts, By Component
14.5.4.2.1. Solution
14.5.4.2.2. Services
14.5.4.3. Kuwait Agriculture Analytics Market Revenue (US$ Mn) and
Forecasts, By Farm Size
14.5.4.3.1. Small
14.5.4.3.2. Medium Sized
14.5.4.3.3. Large
14.5.5. South
Africa
14.5.5.1. South Africa Agriculture Analytics Market Revenue (US$ Mn) and
Forecasts, By Application Area
14.5.5.1.1. Farm Analytics
14.5.5.1.2. Livestock Analytics
14.5.5.1.3. Aquaculture Analytics
14.5.5.2. South Africa Agriculture Analytics Market Revenue (US$ Mn) and
Forecasts, By Component
14.5.5.2.1. Solution
14.5.5.2.2. Services
14.5.5.3. South Africa Agriculture Analytics Market Revenue (US$ Mn) and
Forecasts, By Farm Size
14.5.5.3.1. Small
14.5.5.3.2. Medium Sized
14.5.5.3.3. Large
14.5.6. Rest of
Middle East & Africa
14.5.6.1. Rest of Middle East & Africa Agriculture Analytics Market
Revenue (US$ Mn) and Forecasts, By Application Area
14.5.6.1.1. Farm Analytics
14.5.6.1.2. Livestock Analytics
14.5.6.1.3. Aquaculture Analytics
14.5.6.2. Rest of Middle East & Africa Agriculture Analytics Market
Revenue (US$ Mn) and Forecasts, By Component
14.5.6.2.1. Solution
14.5.6.2.2. Services
14.5.6.3. Rest of Middle East & Africa Agriculture Analytics Market
Revenue (US$ Mn) and Forecasts, By Farm Size
14.5.6.3.1. Small
14.5.6.3.2. Medium Sized
14.5.6.3.3. Large
14.6. Key
Segment for Channeling Investments
14.6.1. By
Country
14.6.2. By
Application Area
14.6.3. By
Component
14.6.4. By Farm
Size
15.
Latin America Agriculture
Analytics Market Analysis and Forecasts, 2019 - 2027
15.1. Overview
15.1.1. Latin
America Agriculture Analytics Market Revenue (US$ Mn)
15.2. Latin
America Agriculture Analytics Market Revenue (US$ Mn) and Forecasts, By
Application Area
15.2.1. Farm
Analytics
15.2.2. Livestock
Analytics
15.2.3. Aquaculture
Analytics
15.3. Latin
America Agriculture Analytics Market Revenue (US$ Mn) and Forecasts, By
Component
15.3.1. Solution
15.3.2. Services
15.4. Latin
America Agriculture Analytics Market Revenue (US$ Mn) and Forecasts, By Farm
Size
15.4.1. Small
15.4.2. Medium
Sized
15.4.3. Large
15.5. Latin
America Agriculture Analytics Market Revenue (US$ Mn) and Forecasts, By Country
15.5.1. Brazil
15.5.1.1. Brazil Agriculture Analytics Market Revenue (US$ Mn) and
Forecasts, By Application Area
15.5.1.1.1. Farm Analytics
15.5.1.1.2. Livestock Analytics
15.5.1.1.3. Aquaculture Analytics
15.5.1.2. Brazil Agriculture Analytics Market Revenue (US$ Mn) and
Forecasts, By Component
15.5.1.2.1. Solution
15.5.1.2.2. Services
15.5.1.3. Brazil Agriculture Analytics Market Revenue (US$ Mn) and
Forecasts, By Farm Size
15.5.1.3.1. Small
15.5.1.3.2. Medium Sized
15.5.1.3.3. Large
15.5.2. Argentina
15.5.2.1. Argentina Agriculture Analytics Market Revenue (US$ Mn) and
Forecasts, By Application Area
15.5.2.1.1. Farm Analytics
15.5.2.1.2. Livestock Analytics
15.5.2.1.3. Aquaculture Analytics
15.5.2.2. Argentina Agriculture Analytics Market Revenue (US$ Mn) and
Forecasts, By Component
15.5.2.2.1. Solution
15.5.2.2.2. Services
15.5.2.3. Argentina Agriculture Analytics Market Revenue (US$ Mn) and
Forecasts, By Farm Size
15.5.2.3.1. Small
15.5.2.3.2. Medium Sized
15.5.2.3.3. Large
15.5.3. Rest of
Latin America
15.5.3.1. Rest of Latin America Agriculture Analytics Market Revenue
(US$ Mn) and Forecasts, By Application Area
15.5.3.1.1. Farm Analytics
15.5.3.1.2. Livestock Analytics
15.5.3.1.3. Aquaculture Analytics
15.5.3.2. Rest of Latin America Agriculture Analytics Market Revenue
(US$ Mn) and Forecasts, By Component
15.5.3.2.1. Solution
15.5.3.2.2. Services
15.5.3.3. Rest of Latin America Agriculture Analytics Market Revenue
(US$ Mn) and Forecasts, By Farm Size
15.5.3.3.1. Small
15.5.3.3.2. Medium Sized
15.5.3.3.3. Large
15.6. Key
Segment for Channeling Investments
15.6.1. By
Country
15.6.2. By
Application Area
15.6.3. By
Component
15.6.4. By Farm
Size
16.
Competitive Benchmarking
16.1. Market
Share Analysis, 2018
16.2. Global
Presence and Growth Strategies
16.2.1. Mergers
and Acquisitions
16.2.2. Product
Launches
16.2.3. Investments
Trends
16.2.4. R&D
Initiatives
17.
Player Profiles
17.1. Accenture
17.1.1. Company
Details
17.1.2. Company
Overview
17.1.3. Product
Offerings
17.1.4. Key
Developments
17.1.5. Financial
Analysis
17.1.6. SWOT
Analysis
17.1.7. Business
Strategies
17.2. Deere and
Company
17.2.1. Company
Details
17.2.2. Company
Overview
17.2.3. Product
Offerings
17.2.4. Key
Developments
17.2.5. Financial
Analysis
17.2.6. SWOT
Analysis
17.2.7. Business
Strategies
17.3. IBM
Corporation
17.3.1. Company
Details
17.3.2. Company
Overview
17.3.3. Product
Offerings
17.3.4. Key
Developments
17.3.5. Financial
Analysis
17.3.6. SWOT
Analysis
17.3.7. Business
Strategies
17.4. Iteris,
Inc.
17.4.1. Company
Details
17.4.2. Company
Overview
17.4.3. Product
Offerings
17.4.4. Key
Developments
17.4.5. Financial
Analysis
17.4.6. SWOT
Analysis
17.4.7. Business
Strategies
17.5. Monsanto
Company
17.5.1. Company
Details
17.5.2. Company
Overview
17.5.3. Product
Offerings
17.5.4. Key
Developments
17.5.5. Financial
Analysis
17.5.6. SWOT
Analysis
17.5.7. Business
Strategies
17.6. Oracle
17.6.1. Company
Details
17.6.2. Company
Overview
17.6.3. Product
Offerings
17.6.4. Key
Developments
17.6.5. Financial
Analysis
17.6.6. SWOT
Analysis
17.6.7. Business
Strategies
17.7. SAP SE
17.7.1. Company
Details
17.7.2. Company
Overview
17.7.3. Product
Offerings
17.7.4. Key
Developments
17.7.5. Financial
Analysis
17.7.6. SWOT
Analysis
17.7.7. Business
Strategies
17.8. Taranis
17.8.1. Company
Details
17.8.2. Company
Overview
17.8.3. Product
Offerings
17.8.4. Key
Developments
17.8.5. Financial
Analysis
17.8.6. SWOT
Analysis
17.8.7. Business
Strategies
17.9. Trimble
Inc.
17.9.1. Company
Details
17.9.2. Company
Overview
17.9.3. Product
Offerings
17.9.4. Key
Developments
17.9.5. Financial
Analysis
17.9.6. SWOT
Analysis
17.9.7. Business
Strategies
17.10. Other
Market Participants
18.
Key Findings
Note: This ToC is tentative and
can be changed according to the research study conducted during the course of
report completion.
**Exclusive for Multi-User and
Enterprise User.
At Absolute Markets Insights, we are engaged in building both global as well as country specific reports. As a result, the approach taken for deriving the estimation and forecast for a specific country is a bit unique and different in comparison to the global research studies. In this case, we not only study the concerned market factors & trends prevailing in a particular country (from secondary research) but we also tend to calculate the actual market size & forecast from the revenue generated from the market participants involved in manufacturing or distributing the any concerned product. These companies can also be service providers. For analyzing any country specifically, we do consider the growth factors prevailing under the states/cities/county for the same. For instance, if we are analyzing an industry specific to United States, we primarily need to study about the states present under the same(where the product/service has the highest growth). Similar analysis will be followed by other countries. Our scope of the report changes with different markets.
Our research study is mainly implement through a mix of both secondary and primary research. Various sources such as industry magazines, trade journals, and government websites and trade associations are reviewed for gathering precise data. Primary interviews are conducted to validate the market size derived from secondary research. Industry experts, major manufacturers and distributors are contacted for further validation purpose on the current market penetration and growth trends.
Prominent participants in our primary research process include:
- Key Opinion Leaders namely the CEOs, CSOs, VPs, purchasing managers, amongst others
- Research and development participants, distributors/suppliers and subject matter experts
Secondary Research includes data extracted from paid data sources:
- Reuters
- Factiva
- Bloomberg
- One Source
- Hoovers
Research Methodology

Key Inclusions


