
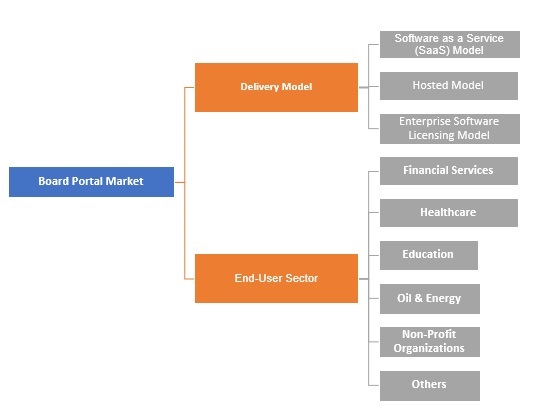
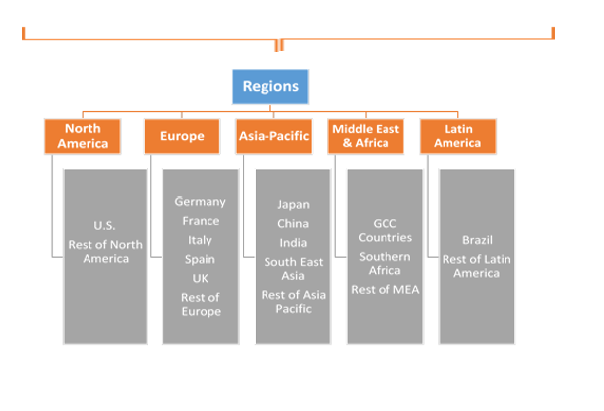
Board Portal Market by Delivery Model (Software as a Service(SaaS), Hosted Model and Enterprise Software Licensing Model); by End-Use Sector (Financial Services, Healthcare, Education, Oil & Energy, Non-Profit Organizations and Others); by Regional Outlook (U.S., Rest of North America, France, UK, Germany, Spain, Italy, Rest of Europe, China, Japan, India, Southeast Asia, Rest of Asia Pacific, GCC Countries, Southern Africa, Rest of MEA, Brazil, Rest of Latin America) - Global Insights, Growth, Size, Comparative Analysis, Trends and Forecast, 2018-2026
Industry Trend
Board portal is an app or software designed to provide secure digital communication among the board of directors and the company. The users have online access to both historic and current documents in addition to multitude of other tools to ensure secure communication. Such technological developments in IT sector has surged the demand for adopting the board portal services in the companies globally. Moreover, the surging demand to deploy advanced management systems and growing requirement to safeguard the shareholders trust across private sector enterprises, has increased the adoption of digitized services.
The board portal market was valued US$ 3360 Mn in 2017 and is anticipated to reach US$ 7930 Mn by 2022.
Board Portal Market, By Delivery Model, 2017 and 2022 (USD Million)
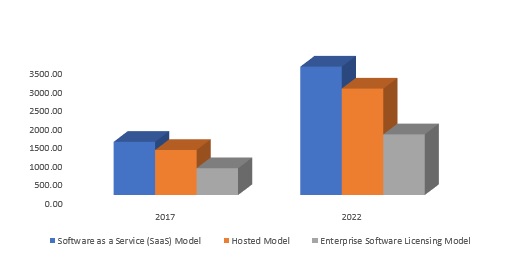
Board portal is a computerized workspace that allows directors and senior executives to securely access the confidential documents on any electronic gadget. Technological advancements in IT solutions such as software as a service (SaaS) model is the major factor driving the growth of board portal market. Hence, a desire for effective and reliable solution for secure exchange of documents is gaining importance. Industries such as BFSI, healthcare, education, oil & energy, non-profit organizations and others operate on advanced technologies such as software as a service (SaaS) model, hosted model and others. Growing government regulations and increasing board duties are encouraging the organizations to adopt the board portal technology. Although market is impacted by high initial cost of implementation and deployment, the increase in number of cybercrimes is expected to influence the growth of board portal industry. Surging mobility and globalization is increasing the demand for fast, secure and efficient board communication. Moreover, the increasing adoption of user friendly algorithm and new product development is expected to further deepen the market penetration of board portal over the forecast period.
Board Portal Market, By End-User Sector
Financial services are expected to hold the highest market share among the other board portal end users. Board portal in financial institutions helps in increasing efficiency and ensure secure exchange of confidential documents. For instance, the Aprio Boardroom, allows efficient access and data security for board information. Owing to these efficient factors, financial institutions globally are largely adopting board portal technology into their organizational structure. Furthermore, no additional requirement of hardware and staff to maintain the solution has inhibited the importance of board portal systems in the financial sectors.
Board Portal Market, By Region
North America region holds the largest market share among other regions for board portal market. The region accounts for major board portal users in the global market. The rising demand for advanced technologies in IT solutions in financial institutions and educational institutes amongst other industries in North America has contributed the growth in the region. Focusing on stringent security, the financial institutions in North America are adopting SaaS model for secure data exchange. In 2017, Banc Intranets, LLC designed enterprise content management software for credit unions, which replaced excess storage space requirements with real-time postings.
Competitive Landscape
The board portal market report covers both, qualitative and quantitative research of the market, as well as include comprehensive insights and developments methods adopted by the key players. The report encompasses competitive detailed analysis of the key players which are driving the market. The key business strategies such as Mergers & Acquisitions, affiliations, collaborations, and contracts adopted by the major players are also recognized and analyzed in the report. For each company, the report recognizes their manufacturing base, competitors, product type, application and specification, pricing, and gross margin.
Some of the primary market participants are Computershare Limited, Diligent Corporation and Nasdaq, Inc Admincontrol, Aprio Inc., Azeus Systems Ltd., Banc Intranets, LLC, BOARDEFFECT, Boardpaq LLC, Boardvantage, Directorpoint LLC, eShare Ltd., ICSA Boardroom Apps Limited., Leading Boards, M29 Technology and Design, Modevity, LLC, Passageways, Sherpany, StreamLink Software Inc., amongst others.

1. Introduction
1.1. Market Scope
1.2. Market Segmentation
1.3. Methodology
1.4. Assumptions
2. Board Portal Market Snapshot
3. Executive Summary: Board Portal Market
4. Qualitative Analysis: Board Portal Market
4.1. Introduction
4.1.1. Product Definition
4.1.2. Industry Development
4.2. Market Dynamics
4.2.1. Drivers
4.2.2. Restraints
4.2.3. Opportunities
4.3. Trends in Market
5. Global Board Portal Market Analysis and Forecasts, 2018 –
2026
5.1. Overview
5.1.1. Global Market Revenue (US$ Mn) and Forecasts
5.2. Global Board Portal Market Revenue (US$ Mn) and Forecasts, By
Delivery Mode
5.2.1. Software as a Service(SaaS) Model
5.2.1.1. Definition
5.2.1.2. Market Penetration
5.2.1.3. Market Revenue Expected to Increase by 2026
5.2.1.4. Compound Annual Growth Rate (CAGR)
5.2.2. Hosted Model
5.2.2.1. Definition
5.2.2.2. Market Penetration
5.2.2.3. Market Revenue Expected to Increase by 2026
5.2.2.4. Compound Annual Growth Rate (CAGR)
5.2.3. Enterprise Software Licensing Model
5.2.3.1. Definition
5.2.3.2. Market Penetration
5.2.3.3. Market Revenue Expected to Increase by 2026
5.2.3.4. Compound Annual Growth Rate (CAGR)
5.3. Key Segment for Channeling Investments
5.3.1. By Delivery Mode
6. Global Board Portal Market Analysis and Forecasts, 2018 –
2026
6.1. Overview
6.2. Global Board Portal Market Revenue (US$ Mn) and Forecasts, By
End-Use Sector
6.2.1. Financial Services
6.2.1.1. Definition
6.2.1.2. Market Penetration
6.2.1.3. Market Revenue Expected to Increase by 2026
6.2.1.4. Compound Annual Growth Rate (CAGR)
6.2.2. Healthcare
6.2.2.1. Definition
6.2.2.2. Market Penetration
6.2.2.3. Market Revenue Expected to Increase by 2026
6.2.2.4. Compound Annual Growth Rate (CAGR)
6.2.3. Education
6.2.3.1. Definition
6.2.3.2. Market Penetration
6.2.3.3. Market Revenue Expected to Increase by 2026
6.2.3.4. Compound Annual Growth Rate (CAGR)
6.2.4. Oil and Energy
6.2.4.1. Definition
6.2.4.2. Market Penetration
6.2.4.3. Market Revenue Expected to Increase by 2026
6.2.4.4. Compound Annual Growth Rate (CAGR)
6.2.5. Non-Profit Organizations
6.2.5.1. Definition
6.2.5.2. Market Penetration
6.2.5.3. Market Revenue Expected to Increase by 2026
6.2.5.4. Compound Annual Growth Rate (CAGR)
6.2.6. Others
6.2.6.1. Definition
6.2.6.2. Market Penetration
6.2.6.3. Market Revenue Expected to Increase by 2026
6.2.6.4. Compound Annual Growth Rate (CAGR)
6.3. Key Segment for Channeling Investments
6.3.1. By End-Use Sector
7. North America Board Portal Market Analysis and Forecasts,
2018 – 2026
7.1. Overview
7.1.1. North America Market Revenue (US$ Mn)
7.2. North America Market Revenue (US$ Mn) and Forecasts, By
Delivery Mode
7.2.1. Software as a Service(SaaS) Model
7.2.2. Hosted Model
7.2.3. Enterprise Software Licensing Model
7.3. North America Board Portal Market Revenue (US$ Mn) and
Forecasts, By End-Use Sector
7.3.1. Financial Services
7.3.2. Healthcare
7.3.3. Education
7.3.4. Oil and Energy
7.3.5. Non-Profit Organizations
7.3.6. Others
7.4. North America Board Portal Market Revenue (US$ Mn) and
Forecasts, By Country
7.4.1. U.S.
7.4.1.1. U.S. Board Portal Market Revenue (US$ Mn) and Forecasts, By
Delivery Mode
7.4.1.1.1. Software as a Service(SaaS) Model
7.4.1.1.2. Hosted Model
7.4.1.1.3. Enterprise Software Licensing Model
7.4.1.2. U.S. Market Revenue (US$ Mn) and Forecasts, By End-Use Sector
7.4.1.2.1. Financial Services
7.4.1.2.2. Healthcare
7.4.1.2.3. Education
7.4.1.2.4. Oil and Energy
7.4.1.2.5. Non-Profit Organizations
7.4.1.2.6. Others
7.4.2. Rest of North America
7.4.2.1. Rest of North America Board Portal Market Revenue (US$ Mn) and
Forecasts, By Delivery Mode
7.4.2.1.1. Software as a Service(SaaS) Model
7.4.2.1.2. Hosted Model
7.4.2.1.3. Enterprise Software Licensing Model
7.4.2.2. Rest of North America Board Portal Market Revenue (US$ Mn) and
Forecasts, By End-Use Sector
7.4.2.2.1. Financial Services
7.4.2.2.2. Healthcare
7.4.2.2.3. Education
7.4.2.2.4. Oil and Energy
7.4.2.2.5. Non-Profit Organizations
7.4.2.2.6. Others
7.5. Key Segment for Channeling Investments
7.5.1. By Country
7.5.2. By Delivery Mode
7.5.3. By End-Use Sector
8. Europe Board Portal Market Analysis and Forecasts, 2018 –
2026
8.1. Overview
8.1.1. Europe Market Revenue (US$ Mn)
8.2. Europe Market Revenue (US$ Mn) and Forecasts, By Delivery Mode
8.2.1. Software as a Service(SaaS) Model
8.2.2. Hosted Model
8.2.3. Enterprise Software Licensing Model
8.3. Europe Board Portal Market Revenue (US$ Mn) and Forecasts, By
End-Use Sector
8.3.1. Financial Services
8.3.2. Healthcare
8.3.3. Education
8.3.4. Oil and Energy
8.3.5. Non-Profit Organizations
8.3.6. Others
8.4. Europe Board Portal Market Revenue (US$ Mn) and Forecasts, By
Country
8.4.1. France
8.4.1.1. France Board Portal Market Revenue (US$ Mn) and Forecasts, By
Delivery Mode
8.4.1.1.1. Software as a Service(SaaS) Model
8.4.1.1.2. Hosted Model
8.4.1.1.3. Enterprise Software Licensing Model
8.4.1.2. France Market Revenue (US$ Mn) and Forecasts, By End-Use
Sector
8.4.1.2.1. Financial Services
8.4.1.2.2. Healthcare
8.4.1.2.3. Education
8.4.1.2.4. Oil and Energy
8.4.1.2.5. Non-Profit Organizations
8.4.1.2.6. Others
8.4.2. The UK
8.4.2.1. The UK Board Portal Market Revenue (US$ Mn) and Forecasts, By
Delivery Mode
8.4.2.1.1. Software as a Service(SaaS) Model
8.4.2.1.2. Hosted Model
8.4.2.1.3. Enterprise Software Licensing Model
8.4.2.2. The UK Market Revenue (US$ Mn) and Forecasts, By End-Use
Sector
8.4.2.2.1. Financial Services
8.4.2.2.2. Healthcare
8.4.2.2.3. Education
8.4.2.2.4. Oil and Energy
8.4.2.2.5. Non-Profit Organizations
8.4.2.2.6. Others
8.4.3. Spain
8.4.3.1. Spain Board Portal Market Revenue (US$ Mn) and Forecasts, By
Delivery Mode
8.4.3.1.1. Software as a Service(SaaS) Model
8.4.3.1.2. Hosted Model
8.4.3.1.3. Enterprise Software Licensing Model
8.4.3.2. Spain Market Revenue (US$ Mn) and Forecasts, By End-Use Sector
8.4.3.2.1. Financial Services
8.4.3.2.2. Healthcare
8.4.3.2.3. Education
8.4.3.2.4. Oil and Energy
8.4.3.2.5. Non-Profit Organizations
8.4.3.2.6. Others
8.4.4. Germany
8.4.4.1. Germany Board Portal Market Revenue (US$ Mn) and Forecasts, By
Delivery Mode
8.4.4.1.1. Software as a Service(SaaS) Model
8.4.4.1.2. Hosted Model
8.4.4.1.3. Enterprise Software Licensing Model
8.4.4.2. Germany Market Revenue (US$ Mn) and Forecasts, By End-Use
Sector
8.4.4.2.1. Financial Services
8.4.4.2.2. Healthcare
8.4.4.2.3. Education
8.4.4.2.4. Oil and Energy
8.4.4.2.5. Non-Profit Organizations
8.4.4.2.6. Others
8.4.5. Italy
8.4.5.1. Italy Board Portal Market Revenue (US$ Mn) and Forecasts, By
Delivery Mode
8.4.5.1.1. Software as a Service(SaaS) Model
8.4.5.1.2. Hosted Model
8.4.5.1.3. Enterprise Software Licensing Model
8.4.5.2. Italy Market Revenue (US$ Mn) and Forecasts, By End-Use Sector
8.4.5.2.1. Financial Services
8.4.5.2.2. Healthcare
8.4.5.2.3. Education
8.4.5.2.4. Oil and Energy
8.4.5.2.5. Non-Profit Organizations
8.4.5.2.6. Others
8.4.6. Rest of Europe
8.4.6.1. Rest of Europe Board Portal Market Revenue (US$ Mn) and
Forecasts, By Delivery Mode
8.4.6.1.1. Software as a Service(SaaS) Model
8.4.6.1.2. Hosted Model
8.4.6.1.3. Enterprise Software Licensing Model
8.4.6.2. Rest of Europe Market Revenue (US$ Mn) and Forecasts, By
End-Use Sector
8.4.6.2.1. Financial Services
8.4.6.2.2. Healthcare
8.4.6.2.3. Education
8.4.6.2.4. Oil and Energy
8.4.6.2.5. Non-Profit Organizations
8.4.6.2.6. Others
8.5. Key Segment for Channeling Investments
8.5.1. By Country
8.5.2. By Delivery Mode
8.5.3. By End-Use Sector
9. Asia Pacific Board
Portal Market Analysis and Forecasts, 2018 – 2026
9.1. Overview
9.1.1. Asia Pacific Market Revenue (US$ Mn)
9.2. Asia Pacific Board Portal Market Revenue (US$ Mn) and
Forecasts, By Delivery Mode
9.2.1. Software as a Service(SaaS) Model
9.2.2. Hosted Model
9.2.3. Enterprise Software Licensing Model
9.3. Asia Pacific Board Portal Market Revenue (US$ Mn) and
Forecasts, By End-Use Sector
9.3.1. Financial Services
9.3.2. Healthcare
9.3.3. Education
9.3.4. Oil and Energy
9.3.5. Non-Profit Organizations
9.3.6. Others
9.4. Asia Pacific Board Portal Market Revenue (US$ Mn) and
Forecasts, By Country
9.4.1. China
9.4.1.1. China Board Portal Market Revenue (US$ Mn) and Forecasts, By
Delivery Mode
9.4.1.1.1. Software as a Service(SaaS) Model
9.4.1.1.2. Hosted Model
9.4.1.1.3. Enterprise Software Licensing Model
9.4.1.2. China Market Revenue (US$ Mn) and Forecasts, By End-Use Sector
9.4.1.2.1. Financial Services
9.4.1.2.2. Healthcare
9.4.1.2.3. Education
9.4.1.2.4. Oil and Energy
9.4.1.2.5. Non-Profit Organizations
9.4.1.2.6. Others
9.4.2. Japan
9.4.2.1. Japan Board Portal Market Revenue (US$ Mn) and Forecasts, By
Delivery Mode
9.4.2.1.1. Software as a Service(SaaS) Model
9.4.2.1.2. Hosted Model
9.4.2.1.3. Enterprise Software Licensing Model
9.4.2.2. Japan Market Revenue (US$ Mn) and Forecasts, By End-Use Sector
9.4.2.2.1. Financial Services
9.4.2.2.2. Healthcare
9.4.2.2.3. Education
9.4.2.2.4. Oil and Energy
9.4.2.2.5. Non-Profit Organizations
9.4.2.2.6. Others
9.4.3. India
9.4.3.1. India Board Portal Market Revenue (US$ Mn) and Forecasts, By
Delivery Mode
9.4.3.1.1. Software as a Service(SaaS) Model
9.4.3.1.2. Hosted Model
9.4.3.1.3. Enterprise Software Licensing Model
9.4.3.2. India Board Portal Market Revenue (US$ Mn) and Forecasts, By
End-Use Sector
9.4.3.2.1. Financial Services
9.4.3.2.2. Healthcare
9.4.3.2.3. Education
9.4.3.2.4. Oil and Energy
9.4.3.2.5. Non-Profit Organizations
9.4.3.2.6. Others
9.4.4. Southeast Asia
9.4.4.1. Southeast Asia Board Portal Market Revenue (US$ Mn) and
Forecasts, By Delivery Mode
9.4.4.1.1. Software as a Service(SaaS) Model
9.4.4.1.2. Hosted Model
9.4.4.1.3. Enterprise Software Licensing Model
9.4.4.2. Southeast Asia Market Revenue (US$ Mn) and Forecasts, By
End-Use Sector
9.4.4.2.1. Financial Services
9.4.4.2.2. Healthcare
9.4.4.2.3. Education
9.4.4.2.4. Oil and Energy
9.4.4.2.5. Non-Profit Organizations
9.4.4.2.6. Others
9.4.5. Rest of Asia Pacific
9.4.5.1. Rest of Asia Pacific Board Portal Market Revenue (US$ Mn) and
Forecasts, By Delivery Mode
9.4.5.1.1. Software as a Service(SaaS) Model
9.4.5.1.2. Hosted Model
9.4.5.1.3. Enterprise Software Licensing Model
9.4.5.2. Rest of Asia Pacific Board Portal Market Revenue (US$ Mn) and
Forecasts, By End-Use Sector
9.4.5.2.1. Financial Services
9.4.5.2.2. Healthcare
9.4.5.2.3. Education
9.4.5.2.4. Oil and Energy
9.4.5.2.5. Non-Profit Organizations
9.4.5.2.6. Others
9.5. Key Segment for Channeling Investments
9.5.1. By Country
9.5.2. By Delivery Mode
9.5.3. By End-Use Sector
10. Middle East and Africa
Board Portal Market Analysis and Forecasts, 2018 – 2026
10.1. Overview
10.1.1. Middle East and Africa Market Revenue (US$ Mn)
10.2. Middle East and Africa Board Portal Market Revenue (US$ Mn)
and Forecasts, By Delivery Mode
10.2.1. Software as a Service(SaaS) Model
10.2.2. Hosted Model
10.2.3. Enterprise Software Licensing Model
10.3. Middle East and Africa Market Revenue (US$ Mn) and Forecasts,
By End-Use Sector
10.3.1. Financial Services
10.3.2. Healthcare
10.3.3. Education
10.3.4. Oil and Energy
10.3.5. Non-Profit Organizations
10.3.6. Others
10.4. Middle East and Africa Board Portal Market Revenue (US$ Mn)
and Forecasts, By Country
10.4.1. GCC Countries
10.4.1.1. GCC Countries Board Portal Market Revenue (US$ Mn) and
Forecasts, By Delivery Mode
10.4.1.1.1. Software as a Service(SaaS) Model
10.4.1.1.2. Hosted Model
10.4.1.1.3. Enterprise Software Licensing Model
10.4.1.2. GCC Countries Market Revenue (US$ Mn) and Forecasts, By
End-Use Sector
10.4.1.2.1. Financial Services
10.4.1.2.2. Healthcare
10.4.1.2.3. Education
10.4.1.2.4. Oil and Energy
10.4.1.2.5. Non-Profit Organizations
10.4.1.2.6. Others
10.4.2. Southern Africa
10.4.2.1. Southern Africa Board Portal Market Revenue (US$ Mn) and Forecasts,
By Delivery Mode
10.4.2.1.1. Software as a Service(SaaS) Model
10.4.2.1.2. Hosted Model
10.4.2.1.3. Enterprise Software Licensing Model
10.4.2.2. Southern Africa Board Portal Market Revenue (US$ Mn) and
Forecasts, By End-Use Sector
10.4.2.2.1. Financial Services
10.4.2.2.2. Healthcare
10.4.2.2.3. Education
10.4.2.2.4. Oil and Energy
10.4.2.2.5. Non-Profit Organizations
10.4.2.2.6. Others
10.4.3. Rest of MEA
10.4.3.1. Rest of MEA Board Portal Market Revenue (US$ Mn) and
Forecasts, By Delivery Mode
10.4.3.1.1. Software as a Service(SaaS) Model
10.4.3.1.2. Hosted Model
10.4.3.1.3. Enterprise Software Licensing Model
10.4.3.2. Rest of MEA Board Portal Market Revenue (US$ Mn) and
Forecasts, By End-Use Sector
10.4.3.2.1. Financial Services
10.4.3.2.2. Healthcare
10.4.3.2.3. Education
10.4.3.2.4. Oil and Energy
10.4.3.2.5. Non-Profit Organizations
10.4.3.2.6. Others
10.5. Key Segment for Channeling Investments
10.5.1. By Country
10.5.2. By Delivery Mode
10.5.3. By End-Use Sector
11. Latin America Board Portal Market Analysis and Forecasts,
2018 – 2026
11.1. Overview
11.1.1. Latin America Market Revenue (US$ Mn)
11.2. Latin America Board Portal Market Revenue (US$ Mn) and
Forecasts, By Delivery Mode
11.2.1. Software as a Service(SaaS) Model
11.2.2. Hosted Model
11.2.3. Enterprise Software Licensing Model
11.3. Latin America Market Revenue (US$ Mn) and Forecasts, By
End-Use Sector
11.3.1. Financial Services
11.3.2. Healthcare
11.3.3. Education
11.3.4. Oil and Energy
11.3.5. Non-Profit Organizations
11.3.6. Others
11.4. Latin America Board Portal Market Revenue (US$ Mn) and
Forecasts, By Country
11.4.1. Brazil
11.4.1.1. Brazil Board Portal Market Revenue (US$ Mn) and Forecasts, By
Delivery Mode
11.4.1.1.1. Software as a Service(SaaS) Model
11.4.1.1.2. Hosted Model
11.4.1.1.3. Enterprise Software Licensing Model
11.4.1.2. Brazil Market Revenue (US$ Mn) and Forecasts, By End-Use
Sector
11.4.1.2.1. Financial Services
11.4.1.2.2. Healthcare
11.4.1.2.3. Education
11.4.1.2.4. Oil and Energy
11.4.1.2.5. Non-Profit Organizations
11.4.1.2.6. Others
11.4.2. Rest of Latin America
11.4.2.1. Rest of Latin America Board Portal Market Revenue (US$ Mn) and
Forecasts, By Delivery Mode
11.4.2.1.1. Software as a Service(SaaS) Model
11.4.2.1.2. Hosted Model
11.4.2.1.3. Enterprise Software Licensing Model
11.4.2.2. Rest of Latin America Board Portal Market Revenue (US$ Mn) and
Forecasts, By End-Use Sector
11.4.2.2.1. Financial Services
11.4.2.2.2. Healthcare
11.4.2.2.3. Education
11.4.2.2.4. Oil and Energy
11.4.2.2.5. Non-Profit Organizations
11.4.2.2.6. Others
11.5. Key Segment for Channeling Investments
11.5.1. By Country
11.5.2. By Delivery Mode
11.5.3. By End-Use Sector
12. Competitive Benchmarking
12.1. Player Positioning Analysis
12.2. Global Presence and Growth Strategies
13. Player Profiles
13.1. Admincontrol
13.1.1. Company Details
13.1.2. Company Overview
13.1.3. Product Offerings
13.1.4. Key Developments
13.1.5. Financial Analysis
13.1.6. SWOT Analysis
13.1.7. Business Strategies
13.2. Aprio Inc.
13.2.1. Company Details
13.2.2. Company Overview
13.2.3. Product Offerings
13.2.4. Key Developments
13.2.5. Financial Analysis
13.2.6. SWOT Analysis
13.2.7. Business Strategies
13.3. Azeus Systems Ltd.
13.3.1. Company Details
13.3.2. Company Overview
13.3.3. Product Offerings
13.3.4. Key Developments
13.3.5. Financial Analysis
13.3.6. SWOT Analysis
13.3.7. Business Strategies
13.4. Banc Intranets, LLC
13.4.1. Company Details
13.4.2. Company Overview
13.4.3. Product Offerings
13.4.4. Key Developments
13.4.5. Financial Analysis
13.4.6. SWOT Analysis
13.4.7. Business Strategies
13.5. BOARDEFFECT
13.5.1. Company Details
13.5.2. Company Overview
13.5.3. Product Offerings
13.5.4. Key Developments
13.5.5. Financial Analysis
13.5.6. SWOT Analysis
13.5.7. Business Strategies
13.6. Boardpaq LLC
13.6.1. Company Details
13.6.2. Company Overview
13.6.3. Product Offerings
13.6.4. Key Developments
13.6.5. Financial Analysis
13.6.6. SWOT Analysis
13.6.7. Business Strategies
13.7. Boardvantage
13.7.1. Company Details
13.7.2. Company Overview
13.7.3. Product Offerings
13.7.4. Key Developments
13.7.5. Financial Analysis
13.7.6. SWOT Analysis
13.7.7. Business Strategies
13.8. Computershare Limited
13.8.1. Company Details
13.8.2. Company Overview
13.8.3. Product Offerings
13.8.4. Key Developments
13.8.5. Financial Analysis
13.8.6. SWOT Analysis
13.8.7. Business Strategies
13.9. Diligent Corporation
13.9.1. Company Details
13.9.2. Company Overview
13.9.3. Product Offerings
13.9.4. Key Developments
13.9.5. Financial Analysis
13.9.6. SWOT Analysis
13.9.7. Business Strategies
13.10. Directorpoint LLC
13.10.1. Company Details
13.10.2. Company Overview
13.10.3. Product Offerings
13.10.4. Key Developments
13.10.5. Financial Analysis
13.10.6. SWOT Analysis
13.10.7. Business Strategies
13.11.
eShare Ltd.
13.11.1.
Company Details
13.11.2.
Company Overview
13.11.3.
Product Offerings
13.11.4.
Key Developments
13.11.5.
Financial Analysis
13.11.6.
SWOT Analysis
13.11.7.
Business Strategies
13.12.
ICSA Boardroom Apps
Limited
13.12.1.
Company Details
13.12.2.
Company Overview
13.12.3.
Product Offerings
13.12.4.
Key Developments
13.12.5.
Financial Analysis
13.12.6.
SWOT Analysis
13.12.7.
Business Strategies
13.13.
Leading Boards
13.13.1.
Company Details
13.13.2.
Company Overview
13.13.3.
Product Offerings
13.13.4.
Key Developments
13.13.5.
Financial Analysis
13.13.6.
SWOT Analysis
13.13.7.
Business Strategies
13.14.
M29 Technology and Design
13.14.1.
Company Details
13.14.2.
Company Overview
13.14.3.
Product Offerings
13.14.4.
Key Developments
13.14.5.
Financial Analysis
13.14.6.
SWOT Analysis
13.14.7.
Business Strategies
13.15.
Modevity, LLC
13.15.1.
Company Details
13.15.2.
Company Overview
13.15.3.
Product Offerings
13.15.4.
Key Developments
13.15.5.
Financial Analysis
13.15.6.
SWOT Analysis
13.15.7.
Business Strategies
13.16.
Nasdaq, Inc
13.16.1.
Company Details
13.16.2.
Company Overview
13.16.3.
Product Offerings
13.16.4.
Key Developments
13.16.5.
Financial Analysis
13.16.6.
SWOT Analysis
13.16.7.
Business Strategies
13.17.
Passageways
13.17.1.
Company Details
13.17.2.
Company Overview
13.17.3.
Product Offerings
13.17.4.
Key Developments
13.17.5.
Financial Analysis
13.17.6.
SWOT Analysis
13.17.7.
Business Strategies
13.18.
Sherpany
13.18.1.
Company Details
13.18.2.
Company Overview
13.18.3.
Product Offerings
13.18.4.
Key Developments
13.18.5.
Financial Analysis
13.18.6.
SWOT Analysis
13.18.7.
Business Strategies
13.19.
StreamLink Software Inc.
13.19.1.
Company Details
13.19.2.
Company Overview
13.19.3.
Product Offerings
13.19.4.
Key Developments
13.19.5.
Financial Analysis
13.19.6.
SWOT Analysis
13.19.7.
Business Strategies
Note: This ToC is tentative
and can be changed according to the research study conducted during the course
of report completion.
At Absolute Markets Insights, we are engaged in building both global as well as country specific reports. As a result, the approach taken for deriving the estimation and forecast for a specific country is a bit unique and different in comparison to the global research studies. In this case, we not only study the concerned market factors & trends prevailing in a particular country (from secondary research) but we also tend to calculate the actual market size & forecast from the revenue generated from the market participants involved in manufacturing or distributing the any concerned product. These companies can also be service providers. For analyzing any country specifically, we do consider the growth factors prevailing under the states/cities/county for the same. For instance, if we are analyzing an industry specific to United States, we primarily need to study about the states present under the same(where the product/service has the highest growth). Similar analysis will be followed by other countries. Our scope of the report changes with different markets.
Our research study is mainly implement through a mix of both secondary and primary research. Various sources such as industry magazines, trade journals, and government websites and trade associations are reviewed for gathering precise data. Primary interviews are conducted to validate the market size derived from secondary research. Industry experts, major manufacturers and distributors are contacted for further validation purpose on the current market penetration and growth trends.
Prominent participants in our primary research process include:
- Key Opinion Leaders namely the CEOs, CSOs, VPs, purchasing managers, amongst others
- Research and development participants, distributors/suppliers and subject matter experts
Secondary Research includes data extracted from paid data sources:
- Reuters
- Factiva
- Bloomberg
- One Source
- Hoovers
Research Methodology

Key Inclusions


