
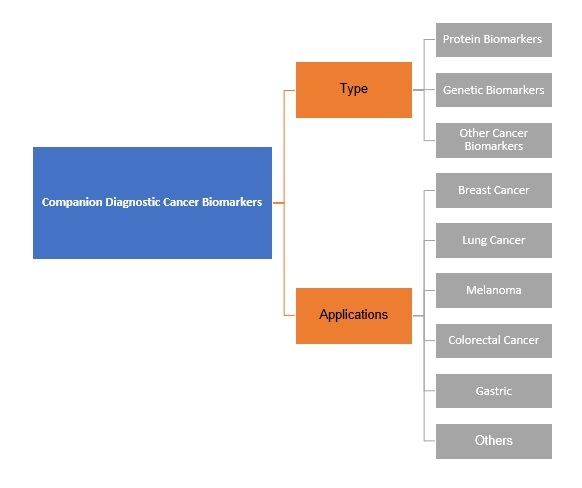
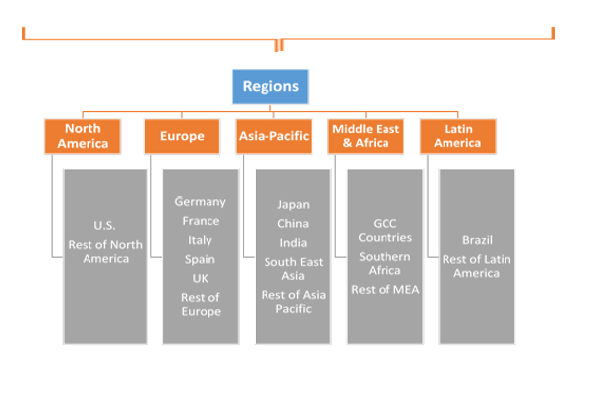
Companion Diagnostic Cancer Biomarkers Market by Product Type (Protein Biomarkers ,Genetic Biomarkers, Other Cancer Biomarkers); by Applications (Breast Cancer, Lung Cancer, Melanoma, Colorectal Cancer, Gastric, Others); by Regional Outlook (U.S., Rest of North America, France, UK, Germany, Spain, Italy, Rest of Europe, China, Japan, India, Southeast Asia, Rest of Asia Pacific, GCC Countries, Southern Africa, Rest of MEA, Brazil, Rest of Latin America) – Global Insights, Growth, Size, Comparative Analysis, Trends and Forecast, 2018 - 2026
Industry trends
Companion diagnostics (CDx) are in vitro devices, assays or imaging tools which are used in combination with cancer biomarkers that provide critical information regarding patients’ condition and efficiency of the treatment. This enables healthcare professionals to determine if the benefits of the treatments outweigh the associated risks and subsequently prescribe the most appropriate treatment.
The companion diagnostic cancer biomarkers market for companion diagnostics cancer biomarkers is fueled by the growing incidents of cancer and the need for better treatment solutions. In the present scenario where the prescription of most cancer treatments is predominantly based on trial and error, companion diagnostics (CDx) give a certain assurance of more efficient and safer pharmacotherapy. Numerous FDA approved companion diagnostics are being developed for breast cancer, colorectal cancer, lung cancer, gastric cancer and melanoma. Companion diagnostics standards are equivalent to the requirements and regulations to that of the related drugs.
The aligning of revenue among the stakeholders remains a major challenge. The companies that are developing companion diagnostics are caught between the conflicting demands of two major stakeholders i.e., the companies that are directly involved in the development of the drugs or companion biomarkers and the providers/payers. The regulation criteria are becoming more demanding in terms of development period between drug and companion diagnostics.
Research and development of predictive biomarkers in oncology plays a significant role in profitable commercialization of companion diagnostics. The Gleevec (Imatinib) and Herceptin(trastuzumab) are two of the most commercially successful drugs that are attributed to the acceptance and popularity of companion diagnostics. Before prescription, both of these drugs need companion diagnostics for testing. From the initial beginning of a few oncology biomarkers with companion diagnostics, the companion diagnostic cancer biomarkers market has expanded to several therapeutic areas and the number of combinations has grown manifolds.
Global Companion Diagnostics Cancer Biomarkers Market, By Application, 2016 & 2021 (USD Million)
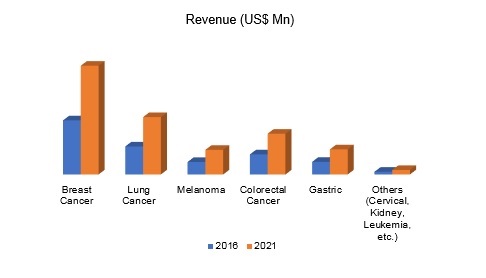
Companion Diagnostic Cancer Biomarkers Market, by Application
The application of companion diagnostics with cancer biomarkers in the treatment of breast cancer is accounted for US$ 960 Mn in 2016 and expected to show sustainable growth during the forecast period. The growth is attributed to the rise of breast cancer awareness programs and as the demand and development of CDx for detection of biomarkers for breast cancer.
Companion Diagnostic Cancer Biomarker Market, by Region
North America dominated the companion diagnostic cancer biomarkers market in terms of revenue accounting for approximately US$ 980 Mn in 2016 accounting for 42.6% of the global market, followed by Europe. The major share is attributed to the high investments in research and development in the region, high demand for companion diagnostics cancer biomarkers from the medical industry and demonstrated support from the U.S. Food and Drug Administration (FDA) and European Medicines Agency (EMA). Another important reason for the growth in North America is a relatively better insurance infrastructure assuring predictable reimbursement.
Competitive Market Share
The companion diagnostic cancer biomarkers market report provides both, qualitative and quantitative research of the market, as well as it helps to gain important insights of current and future market and trending technologies adopted by the key players. The report also offers extensive research on the key players in this market and detailed insights on the competitiveness of these players. The key business strategies such as mergers and acquisitions(M&A), affiliations, collaborations, and contracts adopted by the major players are also recognized and analyzed in the report. For each company, the report recognizes their manufacturing base, competitors, product type, application and specification, pricing, and gross margin.
Some of the key participants of global companion diagnostic cancer biomarkers market are Hoffmann-La Roche AG, Agilent Technologies, Inc., Qiagen N.V., Thermo Fisher Scientific Inc., Abbott Laboratories, Inc., Biomérieux SA, Danaher Corporation, Illumina, Inc., Myriad Genetics, Inc., Arup Laboratories Inc., Sysmex Corporation, Hologic Inc., Novartis AG, Almac Group and Abnova Corporation amongst others.

1. Introduction
1.1. Market Scope
1.2. Market Segmentation
1.3. Methodology
1.4. Assumptions
2. Companion Diagnostic Cancer Biomarkers Market Snapshot
3. Executive Summary: Companion Diagnostic Cancer Biomarkers
Market
4. Qualitative Analysis: Companion Diagnostic Cancer Biomarkers
Market
4.1. Introduction
4.1.1. Product Definition
4.1.2. Industry Development
4.2. Market Dynamics
4.2.1. Drivers
4.2.2. Restraints
4.2.3. Opportunities
4.3. Trends in Market
5. Global Companion Diagnostic Cancer Biomarkers Market Analysis
and Forecasts, 2018 – 2026
5.1. Overview
5.1.1. Global Market Revenue (US$ Mn) and Forecasts
5.2. Global Companion Diagnostic Cancer Biomarkers Market Revenue
(US$ Mn) and Forecasts, By Product Type
5.2.1. Protein Biomarkers
5.2.1.1. Definition
5.2.1.2. Market Penetration
5.2.1.3. Market Revenue Expected to Increase by 2026
5.2.1.4. Compound Annual Growth Rate (CAGR)
5.2.2. Genetic Biomarkers
5.2.2.1. Definition
5.2.2.2. Market Penetration
5.2.2.3. Market Revenue Expected to Increase by 2026
5.2.2.4. Compound Annual Growth Rate (CAGR)
5.2.3. Other Cancer Biomarkers
5.2.3.1. Definition
5.2.3.2. Market Penetration
5.2.3.3. Market Revenue Expected to Increase by 2026
5.2.3.4. Compound Annual Growth Rate (CAGR)
5.3. Key Segment for Channeling Investments
5.3.1. By Product Type
6. Global Companion Diagnostic Cancer Biomarkers Market Analysis
and Forecasts, 2018 – 2026
6.1. Overview
6.2. Global Companion Diagnostic Cancer Biomarkers Market Revenue
(US$ Mn) and Forecasts, By Applications
6.2.1. Breast Cancer
6.2.1.1. Definition
6.2.1.2. Market Penetration
6.2.1.3. Market Revenue Expected to Increase by 2026
6.2.1.4. Compound Annual Growth Rate (CAGR)
6.2.2. Lung Cancer
6.2.2.1. Definition
6.2.2.2. Market Penetration
6.2.2.3. Market Revenue Expected to Increase by 2026
6.2.2.4. Compound Annual Growth Rate (CAGR)
6.2.3. Melanoma
6.2.3.1. Definition
6.2.3.2. Market Penetration
6.2.3.3. Market Revenue Expected to Increase by 2026
6.2.3.4. Compound Annual Growth Rate (CAGR)
6.2.4. Colorectal Cancer
6.2.4.1. Definition
6.2.4.2. Market Penetration
6.2.4.3. Market Revenue Expected to Increase by 2026
6.2.4.4. Compound Annual Growth Rate (CAGR)
6.2.5. Gastric
6.2.5.1. Definition
6.2.5.2. Market Penetration
6.2.5.3. Market Revenue Expected to Increase by 2026
6.2.5.4. Compound Annual Growth Rate (CAGR)
6.2.6. Others (Cervical, Kidney, Leukemia, etc.)
6.2.6.1. Definition
6.2.6.2. Market Penetration
6.2.6.3. Market Revenue Expected to Increase by 2026
6.2.6.4. Compound Annual Growth Rate (CAGR)
6.3. Key Segment for Channeling Investments
6.3.1. By Applications
7. North America Companion Diagnostic Cancer Biomarkers Market
Analysis and Forecasts, 2018 – 2026
7.1. Overview
7.1.1. North America Market Revenue (US$ Mn)
7.2. North America Market Revenue (US$ Mn) and Forecasts, By
Product Type
7.2.1. Protein Biomarkers
7.2.2. Genetic Biomarkers
7.2.3. Other Cancer Biomarkers
7.3. North America Companion Diagnostic Cancer Biomarkers Market
Revenue (US$ Mn) and Forecasts, By Applications
7.3.1. Breast Cancer
7.3.2. Lung Cancer
7.3.3. Melanoma
7.3.4. Colorectal Cancer
7.3.5. Gastric
7.3.6. Others (Cervical, Kidney, Leukemia, etc.)
7.4. North America Companion Diagnostic Cancer Biomarkers Market
Revenue (US$ Mn) and Forecasts, By Country
7.4.1. U.S.
7.4.1.1. U.S. Companion Diagnostic Cancer Biomarkers Market Revenue
(US$ Mn) and Forecasts, By Product Type
7.4.1.1.1. Protein Biomarkers
7.4.1.1.2. Genetic Biomarkers
7.4.1.1.3. Other Cancer Biomarkers
7.4.1.2. U.S. Market Revenue (US$ Mn) and Forecasts, By Applications
7.4.1.2.1. Breast Cancer
7.4.1.2.2. Lung Cancer
7.4.1.2.3. Melanoma
7.4.1.2.4. Colorectal Cancer
7.4.1.2.5. Gastric
7.4.1.2.6. Others (Cervical, Kidney, Leukemia, etc.)
7.4.2. Rest of North America
7.4.2.1. Rest of North America Companion Diagnostic Cancer Biomarkers
Market Revenue (US$ Mn) and Forecasts, By Product Type
7.4.2.1.1. Protein Biomarkers
7.4.2.1.2. Genetic Biomarkers
7.4.2.1.3. Other Cancer Biomarkers
7.4.2.2. Rest of North America Companion Diagnostic Cancer Biomarkers
Market Revenue (US$ Mn) and Forecasts, By Applications
7.4.2.2.1. Breast Cancer
7.4.2.2.2. Lung Cancer
7.4.2.2.3. Melanoma
7.4.2.2.4. Colorectal Cancer
7.4.2.2.5. Gastric
7.4.2.2.6. Others (Cervical, Kidney, Leukemia, etc.)
7.5. Key Segment for Channeling Investments
7.5.1. By Country
7.5.2. By Product Type
7.5.3. By Applications
8. Europe Companion Diagnostic Cancer Biomarkers Market Analysis
and Forecasts, 2018 – 2026
8.1. Overview
8.1.1. Europe Market Revenue (US$ Mn)
8.2. Europe Companion Diagnostic Cancer Biomarkers Market Revenue
(US$ Mn) and Forecasts, By Product Type
8.2.1. Protein Biomarkers
8.2.2. Genetic Biomarkers
8.2.3. Other Cancer Biomarkers
8.3. Europe Companion Diagnostic Cancer Biomarkers Market Revenue
(US$ Mn) and Forecasts, By Applications
8.3.1. Breast Cancer
8.3.2. Lung Cancer
8.3.3. Melanoma
8.3.4. Colorectal Cancer
8.3.5. Gastric
8.3.6. Others (Cervical, Kidney, Leukemia, etc.)
8.4. Europe Companion Diagnostic Cancer Biomarkers Market Revenue
(US$ Mn) and Forecasts, By Country
8.4.1. France
8.4.1.1. France Companion Diagnostic Cancer Biomarkers Market Revenue
(US$ Mn) and Forecasts, By Product Type
8.4.1.1.1. Protein Biomarkers
8.4.1.1.2. Genetic Biomarkers
8.4.1.1.3. Other Cancer Biomarkers
8.4.1.2. France Market Revenue (US$ Mn) and Forecasts, By Applications
8.4.1.2.1. Breast Cancer
8.4.1.2.2. Lung Cancer
8.4.1.2.3. Melanoma
8.4.1.2.4. Colorectal Cancer
8.4.1.2.5. Gastric
8.4.1.2.6. Others (Cervical, Kidney, Leukemia, etc.)
8.4.2. The UK
8.4.2.1. The UK Companion Diagnostic Cancer Biomarkers Market Revenue
(US$ Mn) and Forecasts, By Product Type
8.4.2.1.1. Protein Biomarkers
8.4.2.1.2. Genetic Biomarkers
8.4.2.1.3. Other Cancer Biomarkers
8.4.2.2. The UK Companion Diagnostic Cancer Biomarkers Market Revenue
(US$ Mn) and Forecasts, By Applications
8.4.2.2.1. Breast Cancer
8.4.2.2.2. Lung Cancer
8.4.2.2.3. Melanoma
8.4.2.2.4. Colorectal Cancer
8.4.2.2.5. Gastric
8.4.2.2.6. Others (Cervical, Kidney, Leukemia, etc.)
8.4.3. Spain
8.4.3.1. Spain Companion Diagnostic Cancer Biomarkers Market Revenue
(US$ Mn) and Forecasts, By Product Type
8.4.3.1.1. Protein Biomarkers
8.4.3.1.2. Genetic Biomarkers
8.4.3.1.3. Other Cancer Biomarkers
8.4.3.2. Spain Market Revenue (US$ Mn) and Forecasts, By Applications
8.4.3.2.1. Breast Cancer
8.4.3.2.2. Lung Cancer
8.4.3.2.3. Melanoma
8.4.3.2.4. Colorectal Cancer
8.4.3.2.5. Gastric
8.4.3.2.6. Others (Cervical, Kidney, Leukemia, etc.)
8.4.4. Germany
8.4.4.1. Germany Companion Diagnostic Cancer Biomarkers Market Revenue
(US$ Mn) and Forecasts, By Product Type
8.4.4.1.1. Protein Biomarkers
8.4.4.1.2. Genetic Biomarkers
8.4.4.1.3. Other Cancer Biomarkers
8.4.4.2. Germany Market Revenue (US$ Mn) and Forecasts, By Applications
8.4.4.2.1. Breast Cancer
8.4.4.2.2. Lung Cancer
8.4.4.2.3. Melanoma
8.4.4.2.4. Colorectal Cancer
8.4.4.2.5. Gastric
8.4.4.2.6. Others (Cervical, Kidney, Leukemia, etc.)
8.4.5. Italy
8.4.5.1. Italy Companion Diagnostic Cancer Biomarkers Market Revenue
(US$ Mn) and Forecasts, By Product Type
8.4.5.1.1. Protein Biomarkers
8.4.5.1.2. Genetic Biomarkers
8.4.5.1.3. Other Cancer Biomarkers
8.4.5.2. Italy Market Revenue (US$ Mn) and Forecasts, By Applications
8.4.5.2.1. Breast Cancer
8.4.5.2.2. Lung Cancer
8.4.5.2.3. Melanoma
8.4.5.2.4. Colorectal Cancer
8.4.5.2.5. Gastric
8.4.5.2.6. Others (Cervical, Kidney, Leukemia, etc.)
8.4.6. Rest of Europe
8.4.6.1. Rest of Europe Companion Diagnostic Cancer Biomarkers Market
Revenue (US$ Mn) and Forecasts, By Product Type
8.4.6.1.1. Protein Biomarkers
8.4.6.1.2. Genetic Biomarkers
8.4.6.1.3. Other Cancer Biomarkers
8.4.6.2. Rest of Europe Companion Diagnostic Cancer Biomarkers Market
Revenue (US$ Mn) and Forecasts, By Applications
8.4.6.2.1. Breast Cancer
8.4.6.2.2. Lung Cancer
8.4.6.2.3. Melanoma
8.4.6.2.4. Colorectal Cancer
8.4.6.2.5. Gastric
8.4.6.2.6. Others (Cervical, Kidney, Leukemia, etc.)
8.5. Key Segment for Channeling Investments
8.5.1. By Country
8.5.2. By Product Type
8.5.3. By Applications
9. Asia Pacific Companion Diagnostic Cancer Biomarkers Market
Analysis and Forecasts, 2018 – 2026
9.1. Overview
9.1.1. Asia Pacific Market Revenue (US$ Mn)
9.2. Asia Pacific Companion Diagnostic Cancer Biomarkers Market
Revenue (US$ Mn) and Forecasts, By Product Type
9.2.1. Protein Biomarkers
9.2.2. Genetic Biomarkers
9.2.3. Other Cancer Biomarkers
9.3. Asia Pacific Market Revenue (US$ Mn) and Forecasts, By
Applications
9.3.1. Breast Cancer
9.3.2. Lung Cancer
9.3.3. Melanoma
9.3.4. Colorectal Cancer
9.3.5. Gastric
9.3.6. Others (Cervical, Kidney, Leukemia, etc.)
9.4. Asia Pacific Companion Diagnostic Cancer Biomarkers Market
Revenue (US$ Mn) and Forecasts, By Country
9.4.1. China
9.4.1.1. China Companion Diagnostic Cancer Biomarkers Market Revenue
(US$ Mn) and Forecasts, By Product Type
9.4.1.1.1. Protein Biomarkers
9.4.1.1.2. Genetic Biomarkers
9.4.1.1.3. Other Cancer Biomarkers
9.4.1.2. China Market Revenue (US$ Mn) and Forecasts, By Applications
9.4.1.2.1. Breast Cancer
9.4.1.2.2. Lung Cancer
9.4.1.2.3. Melanoma
9.4.1.2.4. Colorectal Cancer
9.4.1.2.5. Gastric
9.4.1.2.6. Others (Cervical, Kidney, Leukemia, etc.)
9.4.2. Japan
9.4.2.1. Japan Companion Diagnostic Cancer Biomarkers Market Revenue
(US$ Mn) and Forecasts, By Product Type
9.4.2.1.1. Protein Biomarkers
9.4.2.1.2. Genetic Biomarkers
9.4.2.1.3. Other Cancer Biomarkers
9.4.2.2. Japan Companion Diagnostic Cancer Biomarkers Market Revenue
(US$ Mn) and Forecasts, By Applications
9.4.2.2.1. Breast Cancer
9.4.2.2.2. Lung Cancer
9.4.2.2.3. Melanoma
9.4.2.2.4. Colorectal Cancer
9.4.2.2.5. Gastric
9.4.2.2.6. Others (Cervical, Kidney, Leukemia, etc.)
9.4.3. India
9.4.3.1. India Companion Diagnostic Cancer Biomarkers Market Revenue
(US$ Mn) and Forecasts, By Product Type
9.4.3.1.1. Protein Biomarkers
9.4.3.1.2. Genetic Biomarkers
9.4.3.1.3. Other Cancer Biomarkers
9.4.3.2. India Market Revenue (US$ Mn) and Forecasts, By Applications
9.4.3.2.1. Breast Cancer
9.4.3.2.2. Lung Cancer
9.4.3.2.3. Melanoma
9.4.3.2.4. Colorectal Cancer
9.4.3.2.5. Gastric
9.4.3.2.6. Others (Cervical, Kidney, Leukemia, etc.)
9.4.4. Southeast Asia
9.4.4.1. Southeast Asia Companion Diagnostic Cancer Biomarkers Market
Revenue (US$ Mn) and Forecasts, By Product Type
9.4.4.1.1. Protein Biomarkers
9.4.4.1.2. Genetic Biomarkers
9.4.4.1.3. Other Cancer Biomarkers
9.4.4.2. Southeast Asia Market Revenue (US$ Mn) and Forecasts, By
Applications
9.4.4.2.1. Breast Cancer
9.4.4.2.2. Lung Cancer
9.4.4.2.3. Melanoma
9.4.4.2.4. Colorectal Cancer
9.4.4.2.5. Gastric
9.4.4.2.6. Others (Cervical, Kidney, Leukemia, etc.)
9.4.5. Rest of Asia Pacific
9.4.5.1. Rest of Asia Pacific Companion Diagnostic Cancer Biomarkers
Market Revenue (US$ Mn) and Forecasts, By Product Type
9.4.5.1.1. Protein Biomarkers
9.4.5.1.2. Genetic Biomarkers
9.4.5.1.3. Other Cancer Biomarkers
9.4.5.2. Rest of Asia Pacific Companion Diagnostic Cancer Biomarkers
Market Revenue (US$ Mn) and Forecasts, By Applications
9.4.5.2.1. Breast Cancer
9.4.5.2.2. Lung Cancer
9.4.5.2.3. Melanoma
9.4.5.2.4. Colorectal Cancer
9.4.5.2.5. Gastric
9.4.5.2.6. Others (Cervical, Kidney, Leukemia, etc.)
9.5. Key Segment for Channeling Investments
9.5.1. By Country
9.5.2. By Product Type
9.5.3. By Applications
10. Middle East and Africa Companion Diagnostic Cancer Biomarkers
Market Analysis and Forecasts, 2018 – 2026
10.1. Overview
10.1.1. Middle East and Africa Market Revenue (US$ Mn)
10.2. Middle East and Africa Market Revenue (US$ Mn) and Forecasts,
By Product Type
10.2.1. Protein Biomarkers
10.2.2. Genetic Biomarkers
10.2.3. Other Cancer Biomarkers
10.3. Middle East and Africa Companion Diagnostic Cancer Biomarkers
Market Revenue (US$ Mn) and Forecasts, By Applications
10.3.1. Breast Cancer
10.3.2. Lung Cancer
10.3.3. Melanoma
10.3.4. Colorectal Cancer
10.3.5. Gastric
10.3.6. Others (Cervical, Kidney, Leukemia, etc.)
10.4. Middle East and Africa Companion Diagnostic Cancer Biomarkers
Market Revenue (US$ Mn) and Forecasts, By Country
10.4.1. GCC Countries
10.4.1.1. GCC Countries Companion Diagnostic Cancer Biomarkers Market
Revenue (US$ Mn) and Forecasts, By Product Type
10.4.1.1.1. Protein Biomarkers
10.4.1.1.2. Genetic Biomarkers
10.4.1.1.3. Other Cancer Biomarkers
10.4.1.2. GCC Countries Market Revenue (US$ Mn) and Forecasts, By
Applications
10.4.1.2.1. Breast Cancer
10.4.1.2.2. Lung Cancer
10.4.1.2.3. Melanoma
10.4.1.2.4. Colorectal Cancer
10.4.1.2.5. Gastric
10.4.1.2.6. Others (Cervical, Kidney, Leukemia, etc.)
10.4.2. Southern Africa
10.4.2.1. Southern Africa Companion Diagnostic Cancer Biomarkers Market
Revenue (US$ Mn) and Forecasts, By Product Type
10.4.2.1.1. Protein Biomarkers
10.4.2.1.2. Genetic Biomarkers
10.4.2.1.3. Other Cancer Biomarkers
10.4.2.2. Southern Africa Market Revenue (US$ Mn) and Forecasts, By
Applications
10.4.2.2.1. Breast Cancer
10.4.2.2.2. Lung Cancer
10.4.2.2.3. Melanoma
10.4.2.2.4. Colorectal Cancer
10.4.2.2.5. Gastric
10.4.2.2.6. Others (Cervical, Kidney, Leukemia, etc.)
10.4.3. Rest of MEA
10.4.3.1. Rest of MEA Companion Diagnostic Cancer Biomarkers Market
Revenue (US$ Mn) and Forecasts, By Product Type
10.4.3.1.1. Protein Biomarkers
10.4.3.1.2. Genetic Biomarkers
10.4.3.1.3. Other Cancer Biomarkers
10.4.3.2. Rest of MEA Companion Diagnostic Cancer Biomarkers Market
Revenue (US$ Mn) and Forecasts, By Applications
10.4.3.2.1. Breast Cancer
10.4.3.2.2. Lung Cancer
10.4.3.2.3. Melanoma
10.4.3.2.4. Colorectal Cancer
10.4.3.2.5. Gastric
10.4.3.2.6. Others (Cervical, Kidney, Leukemia, etc.)
10.5. Key Segment for Channeling Investments
10.5.1. By Country
10.5.2. By Product Type
10.5.3. By Applications
11. Latin America Companion Diagnostic Cancer Biomarkers Market
Analysis and Forecasts, 2018 – 2026
11.1. Overview
11.1.1. Latin America Market Revenue (US$ Mn)
11.2. Latin America Companion Diagnostic Cancer Biomarkers Market
Revenue (US$ Mn) and Forecasts, By Product Type
11.2.1. Protein Biomarkers
11.2.2. Genetic Biomarkers
11.2.3. Other Cancer Biomarkers
11.3. Latin America Companion Diagnostic Cancer Biomarkers Market
Revenue (US$ Mn) and Forecasts, By Applications
11.3.1. Breast Cancer
11.3.2. Lung Cancer
11.3.3. Melanoma
11.3.4. Colorectal Cancer
11.3.5. Gastric
11.3.6. Others (Cervical, Kidney, Leukemia, etc.)
11.4. Latin America Companion Diagnostic Cancer Biomarkers Market
Revenue (US$ Mn) and Forecasts, By Country
11.4.1. Brazil
11.4.1.1. Brazil Companion Diagnostic Cancer Biomarkers Market Revenue
(US$ Mn) and Forecasts, By Product Type
11.4.1.1.1. Protein Biomarkers
11.4.1.1.2. Genetic Biomarkers
11.4.1.1.3. Other Cancer Biomarkers
11.4.1.2. Brazil Market Revenue (US$ Mn) and Forecasts, By Applications
11.4.1.2.1. Breast Cancer
11.4.1.2.2. Lung Cancer
11.4.1.2.3. Melanoma
11.4.1.2.4. Colorectal Cancer
11.4.1.2.5. Gastric
11.4.1.2.6. Others (Cervical, Kidney, Leukemia, etc.)
11.4.2. Rest of Latin America
11.4.2.1. Rest of Latin America Companion Diagnostic Cancer Biomarkers
Market Revenue (US$ Mn) and Forecasts, By Product Type
11.4.2.1.1. Protein Biomarkers
11.4.2.1.2. Genetic Biomarkers
11.4.2.1.3. Other Cancer Biomarkers
11.4.2.2. Rest of Latin America Companion Diagnostic Cancer Biomarkers
Market Revenue (US$ Mn) and Forecasts, By Applications
11.4.2.2.1. Breast Cancer
11.4.2.2.2. Lung Cancer
11.4.2.2.3. Melanoma
11.4.2.2.4. Colorectal Cancer
11.4.2.2.5. Gastric
11.4.2.2.6. Others (Cervical, Kidney, Leukemia, etc.)
11.5. Key Segment for Channeling Investments
11.5.1. By Country
11.5.2. By Product Type
11.5.3. By Applications
12. Competitive Benchmarking
12.1. Player Positioning Analysis
12.2. Global Presence and Growth Strategies
13. Player Profiles
13.1. Abbott Laboratories, Inc.
13.1.1. Company Details
13.1.2. Company Overview
13.1.3. Product Offerings
13.1.4. Key Developments
13.1.5. Financial Analysis
13.1.6. SWOT Analysis
13.1.7. Business Strategies
13.2. Abnova Corporation
13.2.1. Company Details
13.2.2. Company Overview
13.2.3. Product Offerings
13.2.4. Key Developments
13.2.5. Financial Analysis
13.2.6. SWOT Analysis
13.2.7. Business Strategies
13.3. Agilent Technologies, Inc.
13.3.1. Company Details
13.3.2. Company Overview
13.3.3. Product Offerings
13.3.4. Key Developments
13.3.5. Financial Analysis
13.3.6. SWOT Analysis
13.3.7. Business Strategies
13.4. Almac Group
13.4.1. Company Details
13.4.2. Company Overview
13.4.3. Product Offerings
13.4.4. Key Developments
13.4.5. Financial Analysis
13.4.6. SWOT Analysis
13.4.7. Business Strategies
13.5. Arup Laboratories Inc.
13.5.1. Company Details
13.5.2. Company Overview
13.5.3. Product Offerings
13.5.4. Key Developments
13.5.5. Financial Analysis
13.5.6. SWOT Analysis
13.5.7. Business Strategies
13.6. Biomérieux SA
13.6.1. Company Details
13.6.2. Company Overview
13.6.3. Product Offerings
13.6.4. Key Developments
13.6.5. Financial Analysis
13.6.6. SWOT Analysis
13.6.7. Business Strategies
13.7. Danaher Corporation
13.7.1. Company Details
13.7.2. Company Overview
13.7.3. Product Offerings
13.7.4. Key Developments
13.7.5. Financial Analysis
13.7.6. SWOT Analysis
13.7.7. Business Strategies
13.8. Hoffmann-La Roche AG
13.8.1. Company Details
13.8.2. Company Overview
13.8.3. Product Offerings
13.8.4. Key Developments
13.8.5. Financial Analysis
13.8.6. SWOT Analysis
13.8.7. Business Strategies
13.9. Hologic Inc.
13.9.1. Company Details
13.9.2. Company Overview
13.9.3. Product Offerings
13.9.4. Key Developments
13.9.5. Financial Analysis
13.9.6. SWOT Analysis
13.9.7. Business Strategies
13.10. Illumina, Inc.
13.10.1. Company Details
13.10.2. Company Overview
13.10.3. Product Offerings
13.10.4. Key Developments
13.10.5. Financial Analysis
13.10.6. SWOT Analysis
13.10.7. Business Strategies
13.11. Myriad Genetics, Inc.
13.11.1. Company Details
13.11.2. Company Overview
13.11.3. Product Offerings
13.11.4. Key Developments
13.11.5. Financial Analysis
13.11.6. SWOT Analysis
13.11.7. Business Strategies
13.12. Novartis AG
13.12.1. Company Details
13.12.2. Company Overview
13.12.3. Product Offerings
13.12.4. Key Developments
13.12.5. Financial Analysis
13.12.6. SWOT Analysis
13.12.7. Business Strategies
13.13. Qiagen N.V.
13.13.1. Company Details
13.13.2. Company Overview
13.13.3. Product Offerings
13.13.4. Key Developments
13.13.5. Financial Analysis
13.13.6. SWOT Analysis
13.13.7. Business Strategies
13.14. Sysmex Corporation
13.14.1. Company Details
13.14.2. Company Overview
13.14.3. Product Offerings
13.14.4. Key Developments
13.14.5. Financial Analysis
13.14.6. SWOT Analysis
13.14.7. Business Strategies
13.15. Thermo Fisher Scientific Inc.
13.15.1. Company Details
13.15.2. Company Overview
13.15.3. Product Offerings
13.15.4. Key Developments
13.15.5. Financial Analysis
13.15.6. SWOT Analysis
13.15.7. Business Strategies
Note:
This ToC is tentative and can be changed according to the research study conducted
during the course of report completion.
At Absolute Markets Insights, we are engaged in building both global as well as country specific reports. As a result, the approach taken for deriving the estimation and forecast for a specific country is a bit unique and different in comparison to the global research studies. In this case, we not only study the concerned market factors & trends prevailing in a particular country (from secondary research) but we also tend to calculate the actual market size & forecast from the revenue generated from the market participants involved in manufacturing or distributing the any concerned product. These companies can also be service providers. For analyzing any country specifically, we do consider the growth factors prevailing under the states/cities/county for the same. For instance, if we are analyzing an industry specific to United States, we primarily need to study about the states present under the same(where the product/service has the highest growth). Similar analysis will be followed by other countries. Our scope of the report changes with different markets.
Our research study is mainly implement through a mix of both secondary and primary research. Various sources such as industry magazines, trade journals, and government websites and trade associations are reviewed for gathering precise data. Primary interviews are conducted to validate the market size derived from secondary research. Industry experts, major manufacturers and distributors are contacted for further validation purpose on the current market penetration and growth trends.
Prominent participants in our primary research process include:
- Key Opinion Leaders namely the CEOs, CSOs, VPs, purchasing managers, amongst others
- Research and development participants, distributors/suppliers and subject matter experts
Secondary Research includes data extracted from paid data sources:
- Reuters
- Factiva
- Bloomberg
- One Source
- Hoovers
Research Methodology

Key Inclusions


