
Desktop as a Service Market; by Desktop Type (Persistent, Non-Persistent); by Cloud Type (Private, Public, Hybrid); by Organization Size [Large Enterprises, Small and Medium-Sized Enterprises (SMEs)]; by Vertical [Telecom and IT, Manufacturing, Retail, Healthcare, Travel and Logistics, Banking, Financial Services, And Insurance (BFSI), Others], by Country (China, Japan, India, New Zealand, Australia, South Korea, Indonesia, Thailand, Malaysia, Singapore, Rest of Asia Pacific) – Asia Pacific Insights, Growth, Size, Comparative Analysis, Trends and Forecast, 2019–2027
Industry Trends
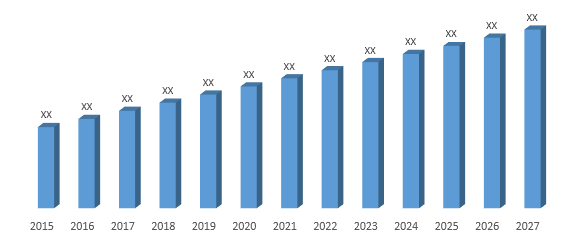
Desktop as a service is a form of virtual desktop infrastructure (VDI) by which one can access the data, store, and recover it from anywhere. In this service, the VDI is outsourced and handled by a third party service provider who manages the data storage, and upgrades, secures and back up of the data. Desktop as a service is normally delivered as a cloud service along with the apps required for use on the virtual desktop. The Asia Pacific desktop as a service market accounted for US$ 143.51 million in the year 2018 and is expected to generate a revenue of US$ 783.5 million by the end of 2027, at a growth rate of 20.82% over the forecast period. The high growth of the service is mainly due to reluctance from the small and medium enterprises to set up the infrastructure in house due to high costs of upfront investments required. Based on the desktop type, the desktop as a service market has been bifurcated into persistent and non-persistent. In 2018, persistent type desktops held a big lead in terms of market share over non-persistent type desktops. Also, persistent type desktops are projected to grow at a higher growth rate over the forecast period as these desktops enables users to store their own settings, files, and shortcuts on the desktop and also offer some administrative privileges.
Lack of technological expertise to implement all the necessary infrastructure in house, is another factor boosting the demand of desktop as a service market. On the basis of cloud type, the market is differentiated into private, public and hybrid. The hybrid cloud type dominated the market in 2018, with highest market share and is expected to continue to grow at the fastest pace over the forecast period. This is because these hybrid clouds combine the best services of both the private and public clouds and offer greater flexibility and more deployment options. For example, the customer can use the public cloud for high-volume, lower-security needs such as web-based email and the private cloud for highly important, business-critical processes like financial reporting.
While lack of some functionality compared to on premise VDI services may hamper the growth of desktop as a service market, the market in general is expected to have high growth opportunities over the forecast period due to development of technologically sustainable systems. For example, industry experts believe that almost every enterprise will need some sort of desktop as a service over the next 2 years, mainly due to growing concerns around security and increasing mobile workforce and a cloud desktop will provide the best answer for these concerns by distributing applications.
Depending on the organization size, desktop as a service market is divided into large enterprises and small and medium sized enterprises (SMEs). Small and medium sized enterprises held the highest market share in 2018 and are expected to continue to grow at a faster rate as compared to large enterprises over the forecast period. The main reason for this is, desktop as a service reduces their expenditure on hardware and lowers the system administration and maintenance costs. On the basis of vertical, the market is bifurcated into telecom and IT, manufacturing, retail, healthcare, travel and logistics, banking, financial services, and insurance (BFSI) and others. In 2018, telecom and IT held the highest market share, but banking, financial services and insurance (BFSI) is expected to grow at the highest growth rate over the forecast period, mainly due to high level of security required and lack of technological infrastructure to set up the service on premise. For instance, Lloyds Banking Group is currently set to roll out the Microsoft Managed Desktop across its entire business, as part of its commitment to digital transformation and to increase agility, provide on-demand scalability and improve operational resilience across the group companies.
Based on the region, Asia Pacific desktop as a service market has been categorized into countries such as, China, Japan, India, New Zealand, Australia, South Korea, Indonesia, Thailand, Malaysia, Singapore and rest of Asia Pacific. In 2018, China held the highest share in the desktop as a service market due to presence of high number of industries in the country. However, South Korea is expected to grow at the highest pace over the forecast period due to fast pace of technological developments in the country.
Asia Pacific Desktop as a Service Market Revenue and Forecast, (US$ Million), 2015 – 2027
Competitive Landscape
The report provides both, qualitative and quantitative research of desktop as a service market, as well as provides comprehensive insights and development methods adopted by the key contenders. The report also offers extensive research on the key players in this market and details on the competitiveness of these players. Key business strategies such as mergers and acquisitions (M&A), affiliations, collaborations, and contracts adopted by these major market participants are also recognized and analysed in the report. For each company, the report studies their global presence, competitors, service offerings, and specification amongst others.
Some of the players operating in the Asia pacific desktop as a service market are Birlasoft, Citrix Systems Inc., IBM Corporation, KEMP Technologies, Leostream Corporation, Microsoft, Oracle Corporation, Amazon, CISCO, NTT Communications Corporation, VMware Inc., QlikTech among others.

Asia Pacific Desktop as a Service Market:
- By Desktop Type
- Persistent
- Non-Persistent
- By Cloud Type
- Private
- Public
- Hybrid
- By Organization Size
- Large Enterprises
- Small and Medium-Sized Enterprises (SMEs)
- By Vertical
- Telecom and IT
- Manufacturing
- Retail
- Healthcare
- Travel and Logistics
- Banking, Financial Services, and Insurance (BFSI)
- Others
- By Country
- China
- Japan
- India
- New Zealand
- Australia
- South Korea
- Indonesia
- Thailand
- Malaysia
- Singapore
- Rest of Southeast Asia
- Rest of Asia Pacific
Table of Contents
![]()
1. Market Scope
1.1. Market
Segmentation
1.2. Years
Considered
1.2.1. Historic
Years: 2013 - 2017
1.2.2. Base
Year: 2018
1.2.3. Forecast
Years: 2019 – 2027
2. Key Target Audiences
3. Research Methodology
3.1. Primary
Research
3.1.1. Research
Questionnaire
3.1.2. Asia
Pacific Percentage Breakdown
3.1.3. Primary
Interviews: Key Opinion Leaders (KOLs)
3.2. Secondary
Research
3.2.1. Paid
Databases
3.2.2. Secondary
Sources
3.3. Market
Size Estimates
3.3.1. Top-Down
Approach
3.3.2. Bottom-Up
Approach
3.4. Data
Triangulation Methodology
3.5. Research
Assumptions
4. Recommendations and Insights from AMI’s Perspective**
5. Holistic Overview of Desktop as a Service Market
6. Market Synopsis:
Desktop as a Service Market
7. Desktop as a Service Market Analysis: Qualitative Perspective
7.1. Introduction
7.1.1. Product
Definition
7.1.2. Industry
Development
7.2. Market
Dynamics
7.2.1. Drivers
7.2.2. Restraints
7.2.3. Opportunities
7.3. Trends in
Desktop as a Service Market
7.4. Market
Determinants Radar Chart
7.5. Macro-Economic
and Micro-Economic Indicators: Desktop as a Service Market
7.6. Porter’s
Five Force Analysis
8. Asia Pacific Desktop as a Service Market Analysis and
Forecasts, 2019 – 2027
8.1. Overview
8.1.1. Asia
Pacific Desktop as a Service Market Revenue (US$ Mn)
8.2. Asia
Pacific Desktop as a Service Market Revenue (US$ Mn) and Forecasts, By Desktop
Type
8.2.1. Persistent
8.2.1.1. Definition
8.2.1.2. Market Penetration, 2018
8.2.1.3. Market Estimation, 2013 – 2018
8.2.1.4. Market Forecast, 2019 – 2027
8.2.1.5. Compound Annual Growth Rate (CAGR)
8.2.1.6. Regional Bifurcation
8.2.1.6.1. China
8.2.1.6.1.1. Market
Estimation, 2013 – 2018
8.2.1.6.1.2. Market
Forecast, 2019 – 2027
8.2.1.6.2. Japan
8.2.1.6.2.1. Market
Estimation, 2013 – 2018
8.2.1.6.2.2. Market
Forecast, 2019 – 2027
8.2.1.6.3. India
8.2.1.6.3.1. Market
Estimation, 2013 – 2018
8.2.1.6.3.2. Market
Forecast, 2019 – 2027
8.2.1.6.4. New
Zealand
8.2.1.6.4.1. Market
Estimation, 2013 – 2018
8.2.1.6.4.2. Market
Forecast, 2019 – 2027
8.2.1.6.5. Australia
8.2.1.6.5.1. Market
Estimation, 2013 – 2018
8.2.1.6.5.2. Market
Forecast, 2019 – 2027
8.2.1.6.6. South
Korea
8.2.1.6.6.1. Market
Estimation, 2013 – 2018
8.2.1.6.6.2. Market
Forecast, 2019 – 2027
8.2.1.6.7. Southeast
Asia
8.2.1.6.7.1. Market
Estimation, 2013 – 2018
8.2.1.6.7.2. Market
Forecast, 2019 – 2027
8.2.1.6.8. Rest
of Asia Pacific
8.2.1.6.8.1. Market
Estimation, 2013 – 2018
8.2.1.6.8.2. Market
Forecast, 2019 – 2027
8.2.2. Non-Persistent
8.2.2.1. Definition
8.2.2.2. Market Penetration, 2018
8.2.2.3. Market Estimation, 2013 – 2018
8.2.2.4. Market Forecast, 2019 – 2027
8.2.2.5. Compound Annual Growth Rate (CAGR)
8.2.2.6. Regional Bifurcation
8.2.2.6.1. China
8.2.2.6.1.1. Market
Estimation, 2013 – 2018
8.2.2.6.1.2. Market
Forecast, 2019 – 2027
8.2.2.6.2. Japan
8.2.2.6.2.1. Market
Estimation, 2013 – 2018
8.2.2.6.2.2. Market
Forecast, 2019 – 2027
8.2.2.6.3. India
8.2.2.6.3.1. Market
Estimation, 2013 – 2018
8.2.2.6.3.2. Market
Forecast, 2019 – 2027
8.2.2.6.4. New
Zealand
8.2.2.6.4.1. Market
Estimation, 2013 – 2018
8.2.2.6.4.2. Market
Forecast, 2019 – 2027
8.2.2.6.5. Australia
8.2.2.6.5.1. Market
Estimation, 2013 – 2018
8.2.2.6.5.2. Market
Forecast, 2019 – 2027
8.2.2.6.6. South
Korea
8.2.2.6.6.1. Market
Estimation, 2013 – 2018
8.2.2.6.6.2. Market
Forecast, 2019 – 2027
8.2.2.6.7. Southeast
Asia
8.2.2.6.7.1. Market
Estimation, 2013 – 2018
8.2.2.6.7.2. Market
Forecast, 2019 – 2027
8.2.2.6.8. Rest
of Asia Pacific
8.2.2.6.8.1. Market
Estimation, 2013 – 2018
8.2.2.6.8.2. Market
Forecast, 2019 – 2027
8.3. Key
Segment for Channeling Investments
8.3.1. By
Desktop Type
9. Asia Pacific Desktop as a Service Market Analysis and
Forecasts, 2019 – 2027
9.1. Overview
9.2. Asia
Pacific Desktop as a Service Market Revenue (US$ Mn) and Forecasts, By Cloud
Type
9.2.1. Private
9.2.1.1. Definition
9.2.1.2. Market Penetration, 2018
9.2.1.3. Market Estimation, 2013 – 2018
9.2.1.4. Market Forecast, 2019 – 2027
9.2.1.5. Compound Annual Growth Rate (CAGR)
9.2.1.6. Regional Bifurcation
9.2.1.6.1. China
9.2.1.6.1.1. Market
Estimation, 2013 – 2018
9.2.1.6.1.2. Market
Forecast, 2019 – 2027
9.2.1.6.2. Japan
9.2.1.6.2.1. Market
Estimation, 2013 – 2018
9.2.1.6.2.2. Market
Forecast, 2019 – 2027
9.2.1.6.3. India
9.2.1.6.3.1. Market
Estimation, 2013 – 2018
9.2.1.6.3.2. Market
Forecast, 2019 – 2027
9.2.1.6.4. New
Zealand
9.2.1.6.4.1. Market
Estimation, 2013 – 2018
9.2.1.6.4.2. Market
Forecast, 2019 – 2027
9.2.1.6.5. Australia
9.2.1.6.5.1. Market
Estimation, 2013 – 2018
9.2.1.6.5.2. Market
Forecast, 2019 – 2027
9.2.1.6.6. South
Korea
9.2.1.6.6.1. Market
Estimation, 2013 – 2018
9.2.1.6.6.2. Market
Forecast, 2019 – 2027
9.2.1.6.7. Southeast
Asia
9.2.1.6.7.1. Market
Estimation, 2013 – 2018
9.2.1.6.7.2. Market
Forecast, 2019 – 2027
9.2.1.6.8. Rest
of Asia Pacific
9.2.1.6.8.1. Market
Estimation, 2013 – 2018
9.2.1.6.8.2. Market
Forecast, 2019 – 2027
9.2.2. Public
9.2.2.1. Definition
9.2.2.2. Market Penetration, 2018
9.2.2.3. Market Estimation, 2013 – 2018
9.2.2.4. Market Forecast, 2019 – 2027
9.2.2.5. Compound Annual Growth Rate (CAGR)
9.2.2.6. Regional Bifurcation
9.2.2.6.1. China
9.2.2.6.1.1. Market
Estimation, 2013 – 2018
9.2.2.6.1.2. Market
Forecast, 2019 – 2027
9.2.2.6.2. Japan
9.2.2.6.2.1. Market
Estimation, 2013 – 2018
9.2.2.6.2.2. Market
Forecast, 2019 – 2027
9.2.2.6.3. India
9.2.2.6.3.1. Market
Estimation, 2013 – 2018
9.2.2.6.3.2. Market
Forecast, 2019 – 2027
9.2.2.6.4. New Zealand
9.2.2.6.4.1. Market
Estimation, 2013 – 2018
9.2.2.6.4.2. Market
Forecast, 2019 – 2027
9.2.2.6.5. Australia
9.2.2.6.5.1. Market
Estimation, 2013 – 2018
9.2.2.6.5.2. Market
Forecast, 2019 – 2027
9.2.2.6.6. South
Korea
9.2.2.6.6.1. Market
Estimation, 2013 – 2018
9.2.2.6.6.2. Market
Forecast, 2019 – 2027
9.2.2.6.7. Southeast
Asia
9.2.2.6.7.1. Market
Estimation, 2013 – 2018
9.2.2.6.7.2. Market
Forecast, 2019 – 2027
9.2.2.6.8. Rest
of Asia Pacific
9.2.2.6.8.1. Market
Estimation, 2013 – 2018
9.2.2.6.8.2. Market
Forecast, 2019 – 2027
9.2.3. Hybrid
9.2.3.1. Definition
9.2.3.2. Market Penetration, 2018
9.2.3.3. Market Estimation, 2013 – 2018
9.2.3.4. Market Forecast, 2019 – 2027
9.2.3.5. Compound Annual Growth Rate (CAGR)
9.2.3.6. Regional Bifurcation
9.2.3.6.1. China
9.2.3.6.1.1. Market
Estimation, 2013 – 2018
9.2.3.6.1.2. Market
Forecast, 2019 – 2027
9.2.3.6.2. Japan
9.2.3.6.2.1. Market
Estimation, 2013 – 2018
9.2.3.6.2.2. Market
Forecast, 2019 – 2027
9.2.3.6.3. India
9.2.3.6.3.1. Market
Estimation, 2013 – 2018
9.2.3.6.3.2. Market
Forecast, 2019 – 2027
9.2.3.6.4. New
Zealand
9.2.3.6.4.1. Market
Estimation, 2013 – 2018
9.2.3.6.4.2. Market
Forecast, 2019 – 2027
9.2.3.6.5. Australia
9.2.3.6.5.1. Market
Estimation, 2013 – 2018
9.2.3.6.5.2. Market
Forecast, 2019 – 2027
9.2.3.6.6. South
Korea
9.2.3.6.6.1. Market
Estimation, 2013 – 2018
9.2.3.6.6.2. Market
Forecast, 2019 – 2027
9.2.3.6.7. Southeast
Asia
9.2.3.6.7.1. Market
Estimation, 2013 – 2018
9.2.3.6.7.2. Market
Forecast, 2019 – 2027
9.2.3.6.8. Rest
of Asia Pacific
9.2.3.6.8.1. Market
Estimation, 2013 – 2018
9.2.3.6.8.2. Market
Forecast, 2019 – 2027
9.3. Key
Segment for Channeling Investments
9.3.1. By Cloud
Type
10. Asia Pacific Desktop as a Service Market Analysis and
Forecasts, 2019 – 2027
10.1. Overview
10.2. Asia
Pacific Desktop as a Service Market Revenue (US$ Mn) and Forecasts, By
Organization Size
10.2.1. Large
Enterprises
10.2.1.1. Definition
10.2.1.2. Market Penetration, 2018
10.2.1.3. Market Estimation, 2013 – 2018
10.2.1.4. Market Forecast, 2019 – 2027
10.2.1.5. Compound Annual Growth Rate (CAGR)
10.2.1.6. Regional Bifurcation
10.2.1.6.1. China
10.2.1.6.1.1. Market
Estimation, 2013 – 2018
10.2.1.6.1.2. Market
Forecast, 2019 – 2027
10.2.1.6.2. Japan
10.2.1.6.2.1. Market
Estimation, 2013 – 2018
10.2.1.6.2.2. Market
Forecast, 2019 – 2027
10.2.1.6.3. India
10.2.1.6.3.1. Market
Estimation, 2013 – 2018
10.2.1.6.3.2. Market
Forecast, 2019 – 2027
10.2.1.6.4. New
Zealand
10.2.1.6.4.1. Market
Estimation, 2013 – 2018
10.2.1.6.4.2. Market
Forecast, 2019 – 2027
10.2.1.6.5. Australia
10.2.1.6.5.1. Market
Estimation, 2013 – 2018
10.2.1.6.5.2. Market
Forecast, 2019 – 2027
10.2.1.6.6. South
Korea
10.2.1.6.6.1. Market
Estimation, 2013 – 2018
10.2.1.6.6.2. Market
Forecast, 2019 – 2027
10.2.1.6.7. Southeast
Asia
10.2.1.6.7.1. Market
Estimation, 2013 – 2018
10.2.1.6.7.2. Market
Forecast, 2019 – 2027
10.2.1.6.8. Rest
of Asia Pacific
10.2.1.6.8.1. Market
Estimation, 2013 – 2018
10.2.1.6.8.2. Market
Forecast, 2019 – 2027
10.2.2. Small
and Medium-Sized Enterprises (SMEs)
10.2.2.1. Definition
10.2.2.2. Market Penetration, 2018
10.2.2.3. Market Estimation, 2013 – 2018
10.2.2.4. Market Forecast, 2019 – 2027
10.2.2.5. Compound Annual Growth Rate (CAGR)
10.2.2.6. Regional Bifurcation
10.2.2.6.1. China
10.2.2.6.1.1. Market
Estimation, 2013 – 2018
10.2.2.6.1.2. Market
Forecast, 2019 – 2027
10.2.2.6.2. Japan
10.2.2.6.2.1. Market
Estimation, 2013 – 2018
10.2.2.6.2.2. Market
Forecast, 2019 – 2027
10.2.2.6.3. India
10.2.2.6.3.1. Market
Estimation, 2013 – 2018
10.2.2.6.3.2. Market
Forecast, 2019 – 2027
10.2.2.6.4. New
Zealand
10.2.2.6.4.1. Market
Estimation, 2013 – 2018
10.2.2.6.4.2. Market
Forecast, 2019 – 2027
10.2.2.6.5. Australia
10.2.2.6.5.1. Market
Estimation, 2013 – 2018
10.2.2.6.5.2. Market
Forecast, 2019 – 2027
10.2.2.6.6. South
Korea
10.2.2.6.6.1. Market
Estimation, 2013 – 2018
10.2.2.6.6.2. Market
Forecast, 2019 – 2027
10.2.2.6.7. Southeast
Asia
10.2.2.6.7.1. Market
Estimation, 2013 – 2018
10.2.2.6.7.2. Market
Forecast, 2019 – 2027
10.2.2.6.8. Rest
of Asia Pacific
10.2.2.6.8.1. Market
Estimation, 2013 – 2018
10.2.2.6.8.2. Market
Forecast, 2019 – 2027
10.3. Key
Segment for Channeling Investments
10.3.1. By
Organization Size
11. Asia Pacific Desktop as a Service Market Analysis and
Forecasts, 2019 – 2027
11.1. Overview
11.2. Asia
Pacific Desktop as a Service Market Revenue (US$ Mn) and Forecasts, By Vertical
11.2.1. Telecom
and IT
11.2.1.1. Definition
11.2.1.2. Market Penetration, 2018
11.2.1.3. Market Estimation, 2013 – 2018
11.2.1.4. Market Forecast, 2019 – 2027
11.2.1.5. Compound Annual Growth Rate (CAGR)
11.2.1.6. Regional Bifurcation
11.2.1.6.1. China
11.2.1.6.1.1. Market
Estimation, 2013 – 2018
11.2.1.6.1.2. Market
Forecast, 2019 – 2027
11.2.1.6.2. Japan
11.2.1.6.2.1. Market
Estimation, 2013 – 2018
11.2.1.6.2.2. Market
Forecast, 2019 – 2027
11.2.1.6.3. India
11.2.1.6.3.1. Market
Estimation, 2013 – 2018
11.2.1.6.3.2. Market
Forecast, 2019 – 2027
11.2.1.6.4. New
Zealand
11.2.1.6.4.1. Market
Estimation, 2013 – 2018
11.2.1.6.4.2. Market
Forecast, 2019 – 2027
11.2.1.6.5. Australia
11.2.1.6.5.1. Market
Estimation, 2013 – 2018
11.2.1.6.5.2. Market
Forecast, 2019 – 2027
11.2.1.6.6. South
Korea
11.2.1.6.6.1. Market
Estimation, 2013 – 2018
11.2.1.6.6.2. Market
Forecast, 2019 – 2027
11.2.1.6.7. Southeast
Asia
11.2.1.6.7.1. Market
Estimation, 2013 – 2018
11.2.1.6.7.2. Market
Forecast, 2019 – 2027
11.2.1.6.8. Rest
of Asia Pacific
11.2.1.6.8.1. Market
Estimation, 2013 – 2018
11.2.1.6.8.2. Market
Forecast, 2019 – 2027
11.2.2. Manufacturing
11.2.2.1. Definition
11.2.2.2. Market Penetration, 2018
11.2.2.3. Market Estimation, 2013 – 2018
11.2.2.4. Market Forecast, 2019 – 2027
11.2.2.5. Compound Annual Growth Rate (CAGR)
11.2.2.6. Regional Bifurcation
11.2.2.6.1. China
11.2.2.6.1.1. Market
Estimation, 2013 – 2018
11.2.2.6.1.2. Market
Forecast, 2019 – 2027
11.2.2.6.2. Japan
11.2.2.6.2.1. Market
Estimation, 2013 – 2018
11.2.2.6.2.2. Market
Forecast, 2019 – 2027
11.2.2.6.3. India
11.2.2.6.3.1. Market
Estimation, 2013 – 2018
11.2.2.6.3.2. Market
Forecast, 2019 – 2027
11.2.2.6.4. New
Zealand
11.2.2.6.4.1. Market
Estimation, 2013 – 2018
11.2.2.6.4.2. Market
Forecast, 2019 – 2027
11.2.2.6.5. Australia
11.2.2.6.5.1. Market
Estimation, 2013 – 2018
11.2.2.6.5.2. Market
Forecast, 2019 – 2027
11.2.2.6.6. South
Korea
11.2.2.6.6.1. Market
Estimation, 2013 – 2018
11.2.2.6.6.2. Market
Forecast, 2019 – 2027
11.2.2.6.7. Southeast
Asia
11.2.2.6.7.1. Market
Estimation, 2013 – 2018
11.2.2.6.7.2. Market
Forecast, 2019 – 2027
11.2.2.6.8. Rest
of Asia Pacific
11.2.2.6.8.1. Market
Estimation, 2013 – 2018
11.2.2.6.8.2. Market
Forecast, 2019 – 2027
11.2.3. Retail
11.2.3.1. Definition
11.2.3.2. Market Penetration, 2018
11.2.3.3. Market Estimation, 2013 – 2018
11.2.3.4. Market Forecast, 2019 – 2027
11.2.3.5. Compound Annual Growth Rate (CAGR)
11.2.3.6. Regional Bifurcation
11.2.3.6.1. China
11.2.3.6.1.1. Market
Estimation, 2013 – 2018
11.2.3.6.1.2. Market
Forecast, 2019 – 2027
11.2.3.6.2. Japan
11.2.3.6.2.1. Market
Estimation, 2013 – 2018
11.2.3.6.2.2. Market
Forecast, 2019 – 2027
11.2.3.6.3. India
11.2.3.6.3.1. Market
Estimation, 2013 – 2018
11.2.3.6.3.2. Market
Forecast, 2019 – 2027
11.2.3.6.4. New
Zealand
11.2.3.6.4.1. Market
Estimation, 2013 – 2018
11.2.3.6.4.2. Market
Forecast, 2019 – 2027
11.2.3.6.5. Australia
11.2.3.6.5.1. Market
Estimation, 2013 – 2018
11.2.3.6.5.2. Market
Forecast, 2019 – 2027
11.2.3.6.6. South
Korea
11.2.3.6.6.1. Market
Estimation, 2013 – 2018
11.2.3.6.6.2. Market
Forecast, 2019 – 2027
11.2.3.6.7. Southeast
Asia
11.2.3.6.7.1. Market
Estimation, 2013 – 2018
11.2.3.6.7.2. Market
Forecast, 2019 – 2027
11.2.3.6.8. Rest
of Asia Pacific
11.2.3.6.8.1. Market
Estimation, 2013 – 2018
11.2.3.6.8.2. Market
Forecast, 2019 – 2027
11.2.4. Healthcare
11.2.4.1. Definition
11.2.4.2. Market Penetration, 2018
11.2.4.3. Market Estimation, 2013 – 2018
11.2.4.4. Market Forecast, 2019 – 2027
11.2.4.5. Compound Annual Growth Rate (CAGR)
11.2.4.6. Regional Bifurcation
11.2.4.6.1. China
11.2.4.6.1.1. Market
Estimation, 2013 – 2018
11.2.4.6.1.2. Market
Forecast, 2019 – 2027
11.2.4.6.2. Japan
11.2.4.6.2.1. Market
Estimation, 2013 – 2018
11.2.4.6.2.2. Market
Forecast, 2019 – 2027
11.2.4.6.3. India
11.2.4.6.3.1. Market
Estimation, 2013 – 2018
11.2.4.6.3.2. Market
Forecast, 2019 – 2027
11.2.4.6.4. New
Zealand
11.2.4.6.4.1. Market
Estimation, 2013 – 2018
11.2.4.6.4.2. Market
Forecast, 2019 – 2027
11.2.4.6.5. Australia
11.2.4.6.5.1. Market
Estimation, 2013 – 2018
11.2.4.6.5.2. Market
Forecast, 2019 – 2027
11.2.4.6.6. South
Korea
11.2.4.6.6.1. Market
Estimation, 2013 – 2018
11.2.4.6.6.2. Market
Forecast, 2019 – 2027
11.2.4.6.7. Southeast
Asia
11.2.4.6.7.1. Market
Estimation, 2013 – 2018
11.2.4.6.7.2. Market
Forecast, 2019 – 2027
11.2.4.6.8. Rest
of Asia Pacific
11.2.4.6.8.1. Market
Estimation, 2013 – 2018
11.2.4.6.8.2. Market
Forecast, 2019 – 2027
11.2.5. Travel
and Logistics
11.2.5.1. Definition
11.2.5.2. Market Penetration, 2018
11.2.5.3. Market Estimation, 2013 – 2018
11.2.5.4. Market Forecast, 2019 – 2027
11.2.5.5. Compound Annual Growth Rate (CAGR)
11.2.5.6. Regional Bifurcation
11.2.5.6.1. China
11.2.5.6.1.1. Market
Estimation, 2013 – 2018
11.2.5.6.1.2. Market
Forecast, 2019 – 2027
11.2.5.6.2. Japan
11.2.5.6.2.1. Market
Estimation, 2013 – 2018
11.2.5.6.2.2. Market
Forecast, 2019 – 2027
11.2.5.6.3. India
11.2.5.6.3.1. Market
Estimation, 2013 – 2018
11.2.5.6.3.2. Market
Forecast, 2019 – 2027
11.2.5.6.4. New
Zealand
11.2.5.6.4.1. Market
Estimation, 2013 – 2018
11.2.5.6.4.2. Market
Forecast, 2019 – 2027
11.2.5.6.5. Australia
11.2.5.6.5.1. Market
Estimation, 2013 – 2018
11.2.5.6.5.2. Market
Forecast, 2019 – 2027
11.2.5.6.6. South
Korea
11.2.5.6.6.1. Market
Estimation, 2013 – 2018
11.2.5.6.6.2. Market
Forecast, 2019 – 2027
11.2.5.6.7. Southeast
Asia
11.2.5.6.7.1. Market
Estimation, 2013 – 2018
11.2.5.6.7.2. Market
Forecast, 2019 – 2027
11.2.5.6.8. Rest
of Asia Pacific
11.2.5.6.8.1. Market
Estimation, 2013 – 2018
11.2.5.6.8.2. Market
Forecast, 2019 – 2027
11.2.6. Banking,
Financial Services, And Insurance (BFSI)
11.2.6.1. Definition
11.2.6.2. Market Penetration, 2018
11.2.6.3. Market Estimation, 2013 – 2018
11.2.6.4. Market Forecast, 2019 – 2027
11.2.6.5. Compound Annual Growth Rate (CAGR)
11.2.6.6. Regional Bifurcation
11.2.6.6.1. China
11.2.6.6.1.1. Market
Estimation, 2013 – 2018
11.2.6.6.1.2. Market
Forecast, 2019 – 2027
11.2.6.6.2. Japan
11.2.6.6.2.1. Market
Estimation, 2013 – 2018
11.2.6.6.2.2. Market
Forecast, 2019 – 2027
11.2.6.6.3. India
11.2.6.6.3.1. Market
Estimation, 2013 – 2018
11.2.6.6.3.2. Market
Forecast, 2019 – 2027
11.2.6.6.4. New
Zealand
11.2.6.6.4.1. Market
Estimation, 2013 – 2018
11.2.6.6.4.2. Market
Forecast, 2019 – 2027
11.2.6.6.5. Australia
11.2.6.6.5.1. Market
Estimation, 2013 – 2018
11.2.6.6.5.2. Market
Forecast, 2019 – 2027
11.2.6.6.6. South
Korea
11.2.6.6.6.1. Market
Estimation, 2013 – 2018
11.2.6.6.6.2. Market
Forecast, 2019 – 2027
11.2.6.6.7. Southeast
Asia
11.2.6.6.7.1. Market
Estimation, 2013 – 2018
11.2.6.6.7.2. Market
Forecast, 2019 – 2027
11.2.6.6.8. Rest
of Asia Pacific
11.2.6.6.8.1. Market
Estimation, 2013 – 2018
11.2.6.6.8.2. Market
Forecast, 2019 – 2027
11.2.7. Others
11.2.7.1. Definition
11.2.7.2. Market Penetration, 2018
11.2.7.3. Market Estimation, 2013 – 2018
11.2.7.4. Market Forecast, 2019 – 2027
11.2.7.5. Compound Annual Growth Rate (CAGR)
11.2.7.6. Regional Bifurcation
11.2.7.6.1. China
11.2.7.6.1.1. Market
Estimation, 2013 – 2018
11.2.7.6.1.2. Market
Forecast, 2019 – 2027
11.2.7.6.2. Japan
11.2.7.6.2.1. Market
Estimation, 2013 – 2018
11.2.7.6.2.2. Market
Forecast, 2019 – 2027
11.2.7.6.3. India
11.2.7.6.3.1. Market
Estimation, 2013 – 2018
11.2.7.6.3.2. Market
Forecast, 2019 – 2027
11.2.7.6.4. New
Zealand
11.2.7.6.4.1. Market
Estimation, 2013 – 2018
11.2.7.6.4.2. Market
Forecast, 2019 – 2027
11.2.7.6.5. Australia
11.2.7.6.5.1. Market
Estimation, 2013 – 2018
11.2.7.6.5.2. Market
Forecast, 2019 – 2027
11.2.7.6.6. South
Korea
11.2.7.6.6.1. Market
Estimation, 2013 – 2018
11.2.7.6.6.2. Market
Forecast, 2019 – 2027
11.2.7.6.7. Southeast
Asia
11.2.7.6.7.1. Market
Estimation, 2013 – 2018
11.2.7.6.7.2. Market
Forecast, 2019 – 2027
11.2.7.6.8. Rest
of Asia Pacific
11.2.7.6.8.1. Market
Estimation, 2013 – 2018
11.2.7.6.8.2. Market
Forecast, 2019 – 2027
11.3. Key
Segment for Channeling Investments
11.3.1. By
Vertical
12. Asia Pacific Desktop as a Service Market Analysis and
Forecasts, 2019 - 2027
12.1. Overview
12.1.1. Asia
Pacific Desktop as a Service Market Revenue (US$ Mn)
12.2. Asia
Pacific Desktop as a Service Market Revenue (US$ Mn) and Forecasts, By Desktop
Type
12.2.1. Persistent
12.2.2. Non-Persistent
12.3. Asia
Pacific Desktop as a Service Market Revenue (US$ Mn) and Forecasts, By Cloud
Type
12.3.1. Private
12.3.2. Public
12.3.3. Hybrid
12.4. Asia
Pacific Desktop as a Service Market Revenue (US$ Mn) and Forecasts, By
Organization Size
12.4.1. Large
Enterprises
12.4.2. Small
and Medium-Sized Enterprises (SMEs)
12.5. Asia
Pacific Desktop as a Service Market Revenue (US$ Mn) and Forecasts, By Vertical
12.5.1. Telecom
and IT
12.5.2. Manufacturing
12.5.3. Retail
12.5.4. Healthcare
12.5.5. Travel
and Logistics
12.5.6. Banking,
Financial Services, And Insurance (BFSI)
12.5.7. Others
12.6. Asia
Pacific Desktop as a Service Market Revenue (US$ Mn), By Country
12.6.1. China
12.6.1.1. China Desktop as a Service Market Revenue (US$ Mn) and
Forecasts, By Desktop Type
12.6.1.1.1. Persistent
12.6.1.1.2. Non-Persistent
12.6.1.2. China Desktop as a Service Market Revenue (US$ Mn) and
Forecasts, By Cloud Type
12.6.1.2.1. Private
12.6.1.2.2. Public
12.6.1.2.3. Hybrid
12.6.1.3. China Desktop as a Service Market Revenue (US$ Mn) and
Forecasts, By Organization Size
12.6.1.3.1. Large
Enterprises
12.6.1.3.2. Small
and Medium-Sized Enterprises (SMEs)
12.6.1.4. China Desktop as a Service Market Revenue (US$ Mn) and
Forecasts, By Vertical
12.6.1.4.1. Telecom
and IT
12.6.1.4.2. Manufacturing
12.6.1.4.3. Retail
12.6.1.4.4. Healthcare
12.6.1.4.5. Travel
and Logistics
12.6.1.4.6. Banking,
Financial Services, And Insurance (BFSI)
12.6.1.4.7. Others
12.6.2. Japan
12.6.2.1. Japan Desktop as a Service Market Revenue (US$ Mn) and
Forecasts, By Desktop Type
12.6.2.1.1. Persistent
12.6.2.1.2. Non-Persistent
12.6.2.2. Japan Desktop as a Service Market Revenue (US$ Mn) and
Forecasts, By Cloud Type
12.6.2.2.1. Private
12.6.2.2.2. Public
12.6.2.2.3. Hybrid
12.6.2.3. Japan Desktop as a Service Market Revenue (US$ Mn) and
Forecasts, By Organization Size
12.6.2.3.1. Large
Enterprises
12.6.2.3.2. Small
and Medium-Sized Enterprises (SMEs)
12.6.2.4. Japan Desktop as a Service Market Revenue (US$ Mn) and
Forecasts, By Vertical
12.6.2.4.1. Telecom
and IT
12.6.2.4.2. Manufacturing
12.6.2.4.3. Retail
12.6.2.4.4. Healthcare
12.6.2.4.5. Travel
and Logistics
12.6.2.4.6. Banking,
Financial Services, And Insurance (BFSI)
12.6.2.4.7. Others
12.6.3. India
12.6.3.1. India Desktop as a Service Market Revenue (US$ Mn) and
Forecasts, By Desktop Type
12.6.3.1.1. Persistent
12.6.3.1.2. Non-Persistent
12.6.3.2. India Desktop as a Service Market Revenue (US$ Mn) and
Forecasts, By Cloud Type
12.6.3.2.1. Private
12.6.3.2.2. Public
12.6.3.2.3. Hybrid
12.6.3.3. India Desktop as a Service Market Revenue (US$ Mn) and
Forecasts, By Organization Size
12.6.3.3.1. Large
Enterprises
12.6.3.3.2. Small
and Medium-Sized Enterprises (SMEs)
12.6.3.4. India Desktop as a Service Market Revenue (US$ Mn) and
Forecasts, By Vertical
12.6.3.4.1. Telecom
and IT
12.6.3.4.2. Manufacturing
12.6.3.4.3. Retail
12.6.3.4.4. Healthcare
12.6.3.4.5. Travel
and Logistics
12.6.3.4.6. Banking,
Financial Services, And Insurance (BFSI)
12.6.3.4.7. Others
12.6.4. New
Zealand
12.6.4.1. New Zealand Desktop as a Service Market Revenue (US$ Mn) and
Forecasts, By Desktop Type
12.6.4.1.1. Persistent
12.6.4.1.2. Non-Persistent
12.6.4.2. New Zealand Desktop as a Service Market Revenue (US$ Mn) and
Forecasts, By Cloud Type
12.6.4.2.1. Private
12.6.4.2.2. Public
12.6.4.2.3. Hybrid
12.6.4.3. New Zealand Desktop as a Service Market Revenue (US$ Mn) and
Forecasts, By Organization Size
12.6.4.3.1. Large
Enterprises
12.6.4.3.2. Small
and Medium-Sized Enterprises (SMEs)
12.6.4.4. New Zealand Desktop as a Service Market Revenue (US$ Mn) and
Forecasts, By Vertical
12.6.4.4.1. Telecom
and IT
12.6.4.4.2. Manufacturing
12.6.4.4.3. Retail
12.6.4.4.4. Healthcare
12.6.4.4.5. Travel
and Logistics
12.6.4.4.6. Banking,
Financial Services, And Insurance (BFSI)
12.6.4.4.7. Others
12.6.5. Australia
12.6.5.1. Australia Desktop as a Service Market Revenue (US$ Mn) and
Forecasts, By Desktop Type
12.6.5.1.1. Persistent
12.6.5.1.2. Non-Persistent
12.6.5.2. Australia Desktop as a Service Market Revenue (US$ Mn) and
Forecasts, By Cloud Type
12.6.5.2.1. Private
12.6.5.2.2. Public
12.6.5.2.3. Hybrid
12.6.5.3. Australia Desktop as a Service Market Revenue (US$ Mn) and
Forecasts, By Organization Size
12.6.5.3.1. Large
Enterprises
12.6.5.3.2. Small
and Medium-Sized Enterprises (SMEs)
12.6.5.4. Australia Desktop as a Service Market Revenue (US$ Mn) and
Forecasts, By Vertical
12.6.5.4.1. Telecom
and IT
12.6.5.4.2. Manufacturing
12.6.5.4.3. Retail
12.6.5.4.4. Healthcare
12.6.5.4.5. Travel
and Logistics
12.6.5.4.6. Banking,
Financial Services, And Insurance (BFSI)
12.6.5.4.7. Others
12.6.6. South
Korea
12.6.6.1. South Korea Desktop as a Service Market Revenue (US$ Mn) and
Forecasts, By Desktop Type
12.6.6.1.1. Persistent
12.6.6.1.2. Non-Persistent
12.6.6.2. South Korea Desktop as a Service Market Revenue (US$ Mn) and
Forecasts, By Cloud Type
12.6.6.2.1. Private
12.6.6.2.2. Public
12.6.6.2.3. Hybrid
12.6.6.3. South Korea Desktop as a Service Market Revenue (US$ Mn) and
Forecasts, By Organization Size
12.6.6.3.1. Large
Enterprises
12.6.6.3.2. Small
and Medium-Sized Enterprises (SMEs)
12.6.6.4. South Korea Desktop as a Service Market Revenue (US$ Mn) and Forecasts,
By Vertical
12.6.6.4.1. Telecom
and IT
12.6.6.4.2. Manufacturing
12.6.6.4.3. Retail
12.6.6.4.4. Healthcare
12.6.6.4.5. Travel
and Logistics
12.6.6.4.6. Banking,
Financial Services, And Insurance (BFSI)
12.6.6.4.7. Others
12.6.7. Southeast
Asia
12.6.7.1. Southeast Asia Desktop as a Service Market Revenue (US$ Mn)
and Forecasts, By Desktop Type
12.6.7.1.1. Persistent
12.6.7.1.2. Non-Persistent
12.6.7.2. Southeast Asia Desktop as a Service Market Revenue (US$ Mn)
and Forecasts, By Cloud Type
12.6.7.2.1. Private
12.6.7.2.2. Public
12.6.7.2.3. Hybrid
12.6.7.3. Southeast Asia Desktop as a Service Market Revenue (US$ Mn)
and Forecasts, By Organization Size
12.6.7.3.1. Large
Enterprises
12.6.7.3.2. Small
and Medium-Sized Enterprises (SMEs)
12.6.7.4. Southeast Asia Desktop as a Service Market Revenue (US$ Mn)
and Forecasts, By Vertical
12.6.7.4.1. Telecom
and IT
12.6.7.4.2. Manufacturing
12.6.7.4.3. Retail
12.6.7.4.4. Healthcare
12.6.7.4.5. Travel
and Logistics
12.6.7.4.6. Banking,
Financial Services, And Insurance (BFSI)
12.6.7.4.7. Others
12.6.7.5. Southeast Asia Desktop as a Service Market Revenue (US$ Mn)
and Forecasts, By Country
12.6.7.5.1. Indonesia
12.6.7.5.2. Thailand
12.6.7.5.3. Malaysia
12.6.7.5.4. Singapore
12.6.7.5.5. Rest
of Southeast Asia
12.6.8. Rest of
Asia Pacific
12.6.8.1. Rest of Asia Pacific Desktop as a Service Market Revenue (US$
Mn) and Forecasts, By Desktop Type
12.6.8.1.1. Persistent
12.6.8.1.2. Non-Persistent
12.6.8.2. Rest of Asia Pacific Desktop as a Service Market Revenue (US$
Mn) and Forecasts, By Cloud Type
12.6.8.2.1. Private
12.6.8.2.2. Public
12.6.8.2.3. Hybrid
12.6.8.3. Rest of Asia Pacific Desktop as a Service Market Revenue (US$
Mn) and Forecasts, By Organization Size
12.6.8.3.1. Large
Enterprises
12.6.8.3.2. Small
and Medium-Sized Enterprises (SMEs)
12.6.8.4. Rest of Asia Pacific Desktop as a Service Market Revenue (US$
Mn) and Forecasts, By Vertical
12.6.8.4.1. Telecom
and IT
12.6.8.4.2. Manufacturing
12.6.8.4.3. Retail
12.6.8.4.4. Healthcare
12.6.8.4.5. Travel
and Logistics
12.6.8.4.6. Banking,
Financial Services, And Insurance (BFSI)
12.6.8.4.7. Others
12.7. Key
Segment for Channeling Investments
12.7.1. By
Country
12.7.2. By
Desktop Type
12.7.3. By
Cloud Type
12.7.4. By
Organization Size
12.7.5. By
Vertical
13. Competitive Benchmarking
13.1. Market
Share Analysis, 2018
13.2. Asia
Pacific Presence and Growth Strategies
13.2.1. Mergers
and Acquisitions
13.2.2. Product
Launches
13.2.3. Investments
Trends
13.2.4. R&D
Initiatives
14. Player Profiles
14.1. Amazon
14.1.1. Company
Details
14.1.2. Company
Overview
14.1.3. Product
Offerings
14.1.4. Key
Developments
14.1.5. Financial
Analysis
14.1.6. SWOT
Analysis
14.1.7. Business
Strategies
14.2. Birlasoft
14.2.1. Company
Details
14.2.2. Company
Overview
14.2.3. Product
Offerings
14.2.4. Key
Developments
14.2.5. Financial
Analysis
14.2.6. SWOT
Analysis
14.2.7. Business
Strategies
14.3. CISCO
14.3.1. Company
Details
14.3.2. Company
Overview
14.3.3. Product
Offerings
14.3.4. Key
Developments
14.3.5. Financial
Analysis
14.3.6. SWOT
Analysis
14.3.7. Business
Strategies
14.4. Citrix
Systems Inc.
14.4.1. Company
Details
14.4.2. Company
Overview
14.4.3. Product
Offerings
14.4.4. Key
Developments
14.4.5. Financial
Analysis
14.4.6. SWOT
Analysis
14.4.7. Business
Strategies
14.5. IBM
Corporation
14.5.1. Company
Details
14.5.2. Company
Overview
14.5.3. Product
Offerings
14.5.4. Key
Developments
14.5.5. Financial
Analysis
14.5.6. SWOT
Analysis
14.5.7. Business
Strategies
14.6. KEMP
Technologies
14.6.1. Company
Details
14.6.2. Company
Overview
14.6.3. Product
Offerings
14.6.4. Key
Developments
14.6.5. Financial
Analysis
14.6.6. SWOT
Analysis
14.6.7. Business
Strategies
14.7. Leostream
Corporation
14.7.1. Company
Details
14.7.2. Company
Overview
14.7.3. Product
Offerings
14.7.4. Key
Developments
14.7.5. Financial
Analysis
14.7.6. SWOT
Analysis
14.7.7. Business
Strategies
14.8. Microsoft
14.8.1. Company
Details
14.8.2. Company
Overview
14.8.3. Product
Offerings
14.8.4. Key
Developments
14.8.5. Financial
Analysis
14.8.6. SWOT
Analysis
14.8.7. Business
Strategies
14.9. NTT
Communications Corporation
14.9.1. Company
Details
14.9.2. Company
Overview
14.9.3. Product
Offerings
14.9.4. Key
Developments
14.9.5. Financial
Analysis
14.9.6. SWOT Analysis
14.9.7. Business
Strategies
14.10. Oracle
Corporation
14.10.1. Company
Details
14.10.2. Company
Overview
14.10.3. Product
Offerings
14.10.4. Key
Developments
14.10.5. Financial
Analysis
14.10.6. SWOT
Analysis
14.10.7. Business
Strategies
14.11. QlikTech
14.11.1. Company
Details
14.11.2. Company
Overview
14.11.3. Product
Offerings
14.11.4. Key
Developments
14.11.5. Financial
Analysis
14.11.6. SWOT
Analysis
14.11.7. Business
Strategies
14.12. VMware
Inc.
14.12.1. Company
Details
14.12.2. Company
Overview
14.12.3. Product
Offerings
14.12.4. Key
Developments
14.12.5. Financial
Analysis
14.12.6. SWOT
Analysis
14.12.7. Business
Strategies
14.13. Other
Market Participants
Key Findings
Note: This ToC is tentative
and can be changed according to the research study conducted during the course
of report completion.
**Exclusive for Multi-User and
Enterprise User.
At Absolute Markets Insights, we are engaged in building both global as well as country specific reports. As a result, the approach taken for deriving the estimation and forecast for a specific country is a bit unique and different in comparison to the global research studies. In this case, we not only study the concerned market factors & trends prevailing in a particular country (from secondary research) but we also tend to calculate the actual market size & forecast from the revenue generated from the market participants involved in manufacturing or distributing the any concerned product. These companies can also be service providers. For analyzing any country specifically, we do consider the growth factors prevailing under the states/cities/county for the same. For instance, if we are analyzing an industry specific to United States, we primarily need to study about the states present under the same(where the product/service has the highest growth). Similar analysis will be followed by other countries. Our scope of the report changes with different markets.
Our research study is mainly implement through a mix of both secondary and primary research. Various sources such as industry magazines, trade journals, and government websites and trade associations are reviewed for gathering precise data. Primary interviews are conducted to validate the market size derived from secondary research. Industry experts, major manufacturers and distributors are contacted for further validation purpose on the current market penetration and growth trends.
Prominent participants in our primary research process include:
- Key Opinion Leaders namely the CEOs, CSOs, VPs, purchasing managers, amongst others
- Research and development participants, distributors/suppliers and subject matter experts
Secondary Research includes data extracted from paid data sources:
- Reuters
- Factiva
- Bloomberg
- One Source
- Hoovers
Research Methodology

Key Inclusions


