
Global Augmented Reality and Virtual Reality Market by Offering (Hardware (Standalone (Sensors (Accelerometers, Gyroscopes, Magnetometers, Proximity Sensors, Others), Semiconductor Components (Integrated Circuits, Processors/Controllers), Cameras, Position Trackers)) Integrated (Head-mounted Displays, Head-up Displays, Gesture-tracking Devices, Projectors and Display Walls, Others)), Software (3D Modelling Software, Visualization Software, Remote Collaboration Software, Documentation Software, Workflow Optimization Software, Navigation Software, Others), Services (Professional Services, Managed Services)) by AR/VR Technology (Monitor-based Technology, Near-eye-based Technology, Mobile Augmented Reality, Non-immersive Technology, Semi-immersive Technology, Fully Immersive Technology) by End User (Individual, Businesses (Aerospace and Defense, Education, Gaming and Entertainment, Healthcare, Travel and Tourism, Transportation and Logistics, Others)), by Region (U.S., Canada, Mexico, Rest of North America, France, The UK, Spain, Germany, Italy, Nordic Countries, Benelux Union, Rest of Europe, China, Japan, India, New Zealand, Australia, South Korea, Southeast Asia, Rest of Asia Pacific, Saudi Arabia, UAE, Egypt, Kuwait, South Africa, Rest of Middle East & Africa, Brazil, Argentina, Rest of Latin America) – Global Insights, Growth, Size, Comparative Analysis, Trends and Forecast, 2019 – 2027
Market Overview/Industry Trends
Augmented reality (AR) refers to interactive involvement with an enhanced computer-generated perceptual information and object present in the real world. The principal value of augmented reality is the way in which components of the digital world blends into an individual’s perception of the real world, not only in terms of data, but through the integration of sensations. On the other hand, virtual reality refers to a three-dimensional, digital environment which can be explored by an individual. In virtual reality, the individual becomes a part of the digitally created world and is able to operate objects or perform a series of actions. An individual experiences virtual reality with the help of a device commonly known as head mounted device which is used across various industry verticals such as gaming, aviation, engineering, and healthcare amongst others. The increasing penetration of head-mounted display (HMDs) in gaming and entertainment sector is driving the augmented reality and virtual reality market. These devices are used across the gaming industry to provide a better experience to individuals even though he/she is not playing in the real world. For instance, No Man's Sky is a virtual reality enhanced game where an individual explores spaces with the help of playstation 4’s VR headset. Additionally, with increasing preferences of millennials to play games with such real effects is further driving its adoption thereby, contributing to the growth of the augmented reality and virtual reality market.
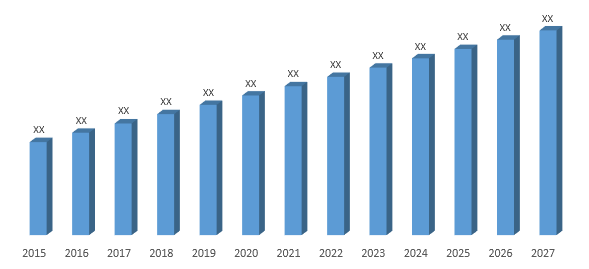
In terms of revenue, the global augmented reality and virtual reality market was valued at be US$ 36.88 Bn in 2018 and is expected to grow at a CAGR of 19.45% over the forecast period (2019-2017). The study evaluates the market based on revenue across the major regions, which have been further bifurcated into countries.
Global Augmented Reality and Virtual Reality Market Revenue & Forecast, (US$ Billion), 2015 – 2027
Offering Outlook:
Hardware segment in the augmented reality and virtual reality market accounted for the largest share in 2018. The hardware available in the augmented reality and virtual reality market plays a major role in the application of the technologies across various industries such as entertainment, gaming and healthcare amongst others. These devices are used in the gaming industry to provide a real life experience to the players with the help of head mounted display. Moreover, these devices require specialized displays to operate, thereby, increasing per unit price and generating more revenue compared to the software and services offered by the companies. On the other hand augmented reality smart glasses are used to increase the efficiency of workers by ensuring digital integration for operations, maintenance and quality assurance. Owing to this increased adoption of augmented reality and virtual reality hardware devices, the overall augmented reality and virtual reality market is expected to grow at a rapid space over the forecast period.
AR/VR Technology Outlook:
Mobile augmented reality segment is expected to show lucrative growth in the augmented reality and virtual reality market over the forecast period (2019-2027). This growth is attributed to the increased penetration of smart phones. The mobile augmented reality uses technology that can move from one place to another. Due to its high mobility, the technology is being adopted by companies to provide better customer experience and satisfaction. For instance, Sephora, which is a makeup retailer, has launched its augmented reality application Sephora Virtual Artist which helps individuals to test looks and makeups before purchasing. The app scans the face of an individual, with accurate lips and eyes sharpness and enables them to try out different looks. Similarly, Rolex has also developed a virtual try on application where customers can try different styles of watches and models before purchasing the same. These applications are not helping the companies to understand consumer preference, but are also helping consumers to make the right purchase decision and improve overall buying experience. This is increasing the adoption of the mobile augmented reality across different verticals, thereby contributing to the overall growth of the augmented reality and virtual reality market.
End User Outlook:
Businesses accounted for the major share in the augmented reality and virtual reality market in 2018. Various businesses are using or applying augmented reality and virtual reality technology in the process or the products they offer. The major industries that use these technologies are gaming and entertainment, healthcare, aerospace & defense, education, etc. Education is expected to increase its adoption of these technologies owing to the increased preferences of institutions to give real-time training to its students. For instance, Avantis Systems Ltd provides class VR solutions in Franklin High School, Michigan. This is helping schools in creating better student engagement, learning experience and understanding. The school applies these solutions across various subjects such as mathematics, science, social science, and geography amongst others. Similarly, California recently opened a virtual reality learning center for medical students. In this institute the students with the help of Oculus DK2 can travel inside the human body instead of just theoretically reading about them. Owing to the increased adoption of these technologies across the education sector, the overall augmented reality and virtual reality market is expected to grow over the forecast period.
Region Outlook:
Europe is expected to grow rapidly over the forecast period in the augmented reality and virtual reality market in 2018 followed by Asia Pacific region. This growth can be attributed by the presence of major companies across the European region. Currently there are approximately 800 plus companies that offer augmented reality and virtual reality solutions across the globe, out of which approximately 150 plus companies are based out of the United Kingdom. Additionally with the growing applications of these technologies the United Kingdom is experiencing the growth of AR and VR startups in the region. It homes some of the top AR and VR startups such as WAVEOPTICS, IGLOO, ZEROLIGHT, FREEFLY VR (PROTEUS LABS), IMPROBABLE, NDREAMS and ZAPPAR amongst others. Owing to the constantly rising investment by Europe based startups, the augmented reality and virtual reality market in the region is expected to grow at an increasing rate over the forecast period.
Competitive landscape
Some of the players operating in the augmented reality and virtual reality market are Aero Glass, Chetu Inc, CSE Software Inc., EON Reality, Facebook Technologies, LLC (Oculus), Fpt Software, Google, LLC, Jasoren, KELLTON TECH, Lenovo, Microsoft, Mindtree Limited, Oxagile, PTC, Sigma Software, Sony Interactive Entertainment Inc, Spin VR Corp., TechViz, Upskill, Vuzix Corporation, and Wikitude GmbH amongst others. These companies are focused on expanding their product portfolio and footprint globally. They are also strategically focusing on offering customized solutions to their clients. For instance, Sigma Software offers its augmented reality and virtual reality hardware and software across regions and various industry verticals such as media and entertainment, fashion, and designing & engineering amongst others.
The report provides both, qualitative and quantitative research of augmented reality and virtual reality market, as well as provides comprehensive insights and development methods adopted by the key contenders. The report also offers extensive research on the key players in this market and details on the competitiveness of these players. Key business strategies such as mergers and acquisitions (M&A), affiliations, collaborations, and contracts adopted by these major market participants are also recognized and analyzed in the report. For each company, the report studies their global presence, competitors, service offerings and specification amongst others.

Global Augmented Reality and Virtual Reality Market:
- By Offerings
- Hardware
- Standalone
- Sensors
- Accelerometers
- Gyroscopes
- Magnetometers
- Proximity Sensors
- Others
- Semiconductor Components
- Integrated Circuits
- Processors/Controllers
- Cameras
- Position Trackers
- Others
- Sensors
- Integrated
- Head-mounted Displays
- Head-up Displays
- Gesture-tracking Devices
- Projectors and Display Walls
- Standalone
- Software
- 3D Modelling Software
- Visualization Software
- Remote Collaboration Software
- Documentation Software
- Workflow Optimization Software
- Navigation Software
- Others
- Services
- Professional Services
- Managed Services
- Hardware
- By AR/VR Technology
- Monitor-based Technology
- Near-eye-based Technology
- Mobile Augmented Reality
- Non-immersive Technology
- Semi-immersive Technology
- Fully Immersive Technology
- By End User
- Individual
- Businesses
- Aerospace and Defense
- Education
- Gaming and Entertainment
- Healthcare
- Travel and Tourism
- Transportation and Logistics
- Others
- By Geography
- North America
- US
- Canada
- Mexico
- Rest of North America
- Europe
- France
- The UK
- Spain
- Germany
- Italy
- Nordic Countries
- Denmark
- Finland
- Iceland
- Sweden
- Norway
- Benelux Union
- Belgium
- The Netherlands
- Luxembourg
- Rest of Europe
- Asia Pacific
- China
- Japan
- India
- New Zealand
- Australia
- South Korea
- Southeast Asia
- Indonesia
- Thailand
- Malaysia
- Singapore
- Rest of Southeast Asia
- Rest of Asia Pacific
- Middle East and Africa
- Saudi Arabia
- UAE
- Egypt
- Kuwait
- South Africa
- Rest of Middle East & Africa
- Latin America
- Brazil
- Argentina
- Rest of Latin America
- North America
Table of Contents
![]()
1. Market Scope
1.1. Market Segmentation
1.2. Years Considered
1.2.1. Historic Years: 2015 -
2017
1.2.2. Base Year: 2018
1.2.3. Forecast Years: 2019 –
2027
2. Key Target Audiences
3. Research Methodology
3.1. Primary Research
3.1.1. Research Questionnaire
3.1.2. Global Percentage
Breakdown
3.1.3. Primary Interviews: Key
Opinion Leaders (KOLs)
3.2. Secondary Research
3.2.1. Paid Databases
3.2.2. Secondary Sources
3.3. Market Size Estimates
3.3.1. Top-Down Approach
3.3.2. Bottom-Up Approach
3.4. Data Triangulation
Methodology
3.5. Research Assumptions
4. Recommendations and Insights from AMI’s Perspective**
5. Holistic Overview of Augmented Reality and Virtual Reality
Market
6. Market Synopsis:
Augmented Reality and Virtual Reality Market
7. Augmented Reality and Virtual Reality Market Analysis:
Qualitative Perspective
7.1. Introduction
7.1.1. Product Definition
7.1.2. Industry Development
7.2. Market Dynamics
7.2.1. Drivers
7.2.2. Restraints
7.2.3. Opportunities
7.2.4. Challenges
7.3. Trends in Augmented
Reality and Virtual Reality Market
7.4. Market Determinants Radar
Chart
7.5. Macro-Economic and
Micro-Economic Indicators: Augmented Reality and Virtual Reality Market
7.6. Porter’s Five Force
Analysis
8. Global Augmented Reality and Virtual Reality Market Analysis
and Forecasts, 2019 – 2027
8.1. Overview
8.1.1. Global Augmented Reality
and Virtual Reality Market Revenue (US$ Mn)
8.2. Global Augmented Reality
and Virtual Reality Market Revenue (US$ Mn) and Forecasts, By Offerings
8.2.1. Hardware (Definition,
Market Estimation and Penetration, 2015 – 2018, Market Estimation (2015 –
2018), Market Forecast (2019 – 2027), Compound Annual Growth Rate (CAGR),
Regional Bifurcation (North America, Europe, Asia Pacific, Middle East and
Africa, Latin America) and Information on Standalone, Integrated)
8.2.1.1.
Standalone
8.2.1.1.1. Sensors
8.2.1.1.1.1. Accelerometers
8.2.1.1.1.2. Gyroscopes
8.2.1.1.1.3. Magnetometers
8.2.1.1.1.4. Proximity Sensors
8.2.1.1.1.5. Others
8.2.1.1.2. Semiconductor Components
8.2.1.1.2.1. Integrated Circuits
8.2.1.1.2.2. Processors/Controllers
8.2.1.1.2.3. Cameras
8.2.1.1.2.4. Position Trackers
8.2.1.1.2.5. Others
8.2.1.2.
Integrated
8.2.1.2.1.
Head-mounted Displays
8.2.1.2.2.
Head-up Displays
8.2.1.2.3.
Gesture-tracking Devices
8.2.1.2.4.
Projectors & Display Walls
8.2.2. Software (Definition,
Market Estimation and Penetration, 2015 – 2018, Market Estimation (2015 –
2018), Market Forecast (2019 – 2027), Compound Annual Growth Rate (CAGR),
Regional Bifurcation (North America, Europe, Asia Pacific, Middle East and
Africa, Latin America) and Information on 3D Modelling Software, Visualization
Software, Remote Collaboration Software, Documentation Software, Workflow
Optimization Software, Navigation Software, Others)
8.2.2.1.
3D Modelling Software
8.2.2.2.
Visualization Software
8.2.2.3.
Remote Collaboration Software
8.2.2.4.
Documentation Software
8.2.2.5.
Workflow Optimization Software
8.2.2.6.
Navigation Software
8.2.2.7.
Others
8.2.3. Services (Definition,
Market Estimation and Penetration, 2015 – 2018, Market Estimation (2015 –
2018), Market Forecast (2019 – 2027), Compound Annual Growth Rate (CAGR),
Regional Bifurcation (North America, Europe, Asia Pacific, Middle East and
Africa, Latin America) and Information on Professional Services, Managed
Services)
8.2.3.1.
Professional Services
8.2.3.2.
Managed Services
8.3. Key Segment for
Channeling Investments
8.3.1. By Offerings
9. Global Augmented Reality and Virtual Reality Market Analysis
and Forecasts, 2019 – 2027
9.1. Overview
9.2. Global Augmented Reality
and Virtual Reality Market Revenue (US$ Mn) and Forecasts, By AR/VR Technology
9.2.1. Monitor-based Technology
9.2.1.1.
Definition
9.2.1.2.
Market Estimation and
Penetration, 2015 – 2018
9.2.1.3.
Market Forecast, 2019 – 2027
9.2.1.4.
Compound Annual Growth Rate
(CAGR)
9.2.1.5.
Regional Bifurcation
9.2.1.5.1.
North America
9.2.1.5.1.1. Market Estimation,
2015 – 2018
9.2.1.5.1.2. Market Forecast,
2019 – 2027
9.2.1.5.2.
Europe
9.2.1.5.2.1. Market Estimation,
2015 – 2018
9.2.1.5.2.2. Market Forecast,
2019 – 2027
9.2.1.5.3.
Asia Pacific
9.2.1.5.3.1. Market Estimation,
2015 – 2018
9.2.1.5.3.2. Market Forecast,
2019 – 2027
9.2.1.5.4.
Middle East and Africa
9.2.1.5.4.1. Market Estimation,
2015 – 2018
9.2.1.5.4.2. Market Forecast,
2019 – 2027
9.2.1.5.5.
Latin America
9.2.1.5.5.1. Market Estimation,
2015 – 2018
9.2.1.5.5.2. Market Forecast,
2019 – 2027
9.2.2. Near-eye-based
Technology
9.2.2.1.
Definition
9.2.2.2.
Market Estimation and
Penetration, 2015 – 2018
9.2.2.3.
Market Forecast, 2019 – 2027
9.2.2.4.
Compound Annual Growth Rate
(CAGR)
9.2.2.5.
Regional Bifurcation
9.2.2.5.1.
North America
9.2.2.5.1.1. Market Estimation,
2015 – 2018
9.2.2.5.1.2. Market Forecast,
2019 – 2027
9.2.2.5.2.
Europe
9.2.2.5.2.1. Market Estimation,
2015 – 2018
9.2.2.5.2.2. Market Forecast,
2019 – 2027
9.2.2.5.3.
Asia Pacific
9.2.2.5.3.1. Market Estimation,
2015 – 2018
9.2.2.5.3.2. Market Forecast,
2019 – 2027
9.2.2.5.4.
Middle East and Africa
9.2.2.5.4.1. Market Estimation,
2015 – 2018
9.2.2.5.4.2. Market Forecast,
2019 – 2027
9.2.2.5.5.
Latin America
9.2.2.5.5.1. Market Estimation,
2015 – 2018
9.2.2.5.5.2. Market Forecast,
2019 – 2027
9.2.3. Mobile Augmented Reality
9.2.3.1.
Definition
9.2.3.2.
Market Estimation and
Penetration, 2015 – 2018
9.2.3.3.
Market Forecast, 2019 – 2027
9.2.3.4.
Compound Annual Growth Rate
(CAGR)
9.2.3.5.
Regional Bifurcation
9.2.3.5.1.
North America
9.2.3.5.1.1. Market Estimation,
2015 – 2018
9.2.3.5.1.2. Market Forecast,
2019 – 2027
9.2.3.5.2.
Europe
9.2.3.5.2.1. Market Estimation,
2015 – 2018
9.2.3.5.2.2. Market Forecast,
2019 – 2027
9.2.3.5.3.
Asia Pacific
9.2.3.5.3.1. Market Estimation,
2015 – 2018
9.2.3.5.3.2. Market Forecast,
2019 – 2027
9.2.3.5.4.
Middle East and Africa
9.2.3.5.4.1. Market Estimation,
2015 – 2018
9.2.3.5.4.2. Market Forecast,
2019 – 2027
9.2.3.5.5.
Latin America
9.2.3.5.5.1. Market Estimation,
2015 – 2018
9.2.3.5.5.2. Market Forecast,
2019 – 2027
9.2.4. Non-immersive Technology
9.2.4.1.
Definition
9.2.4.2.
Market Estimation and
Penetration, 2015 – 2018
9.2.4.3.
Market Forecast, 2019 – 2027
9.2.4.4.
Compound Annual Growth Rate
(CAGR)
9.2.4.5.
Regional Bifurcation
9.2.4.5.1.
North America
9.2.4.5.1.1. Market Estimation,
2015 – 2018
9.2.4.5.1.2. Market Forecast,
2019 – 2027
9.2.4.5.2.
Europe
9.2.4.5.2.1. Market Estimation,
2015 – 2018
9.2.4.5.2.2. Market Forecast,
2019 – 2027
9.2.4.5.3.
Asia Pacific
9.2.4.5.3.1. Market Estimation,
2015 – 2018
9.2.4.5.3.2. Market Forecast,
2019 – 2027
9.2.4.5.4.
Middle East and Africa
9.2.4.5.4.1. Market Estimation,
2015 – 2018
9.2.4.5.4.2. Market Forecast,
2019 – 2027
9.2.4.5.5.
Latin America
9.2.4.5.5.1. Market Estimation,
2015 – 2018
9.2.4.5.5.2. Market Forecast,
2019 – 2027
9.2.5. Semi-immersive
Technology
9.2.5.1.
Definition
9.2.5.2.
Market Estimation and
Penetration, 2015 – 2018
9.2.5.3.
Market Forecast, 2019 – 2027
9.2.5.4.
Compound Annual Growth Rate
(CAGR)
9.2.5.5.
Regional Bifurcation
9.2.5.5.1.
North America
9.2.5.5.1.1. Market Estimation,
2015 – 2018
9.2.5.5.1.2. Market Forecast,
2019 – 2027
9.2.5.5.2.
Europe
9.2.5.5.2.1. Market Estimation,
2015 – 2018
9.2.5.5.2.2. Market Forecast,
2019 – 2027
9.2.5.5.3.
Asia Pacific
9.2.5.5.3.1. Market Estimation,
2015 – 2018
9.2.5.5.3.2. Market Forecast,
2019 – 2027
9.2.5.5.4.
Middle East and Africa
9.2.5.5.4.1. Market Estimation,
2015 – 2018
9.2.5.5.4.2. Market Forecast,
2019 – 2027
9.2.5.5.5.
Latin America
9.2.5.5.5.1. Market Estimation,
2015 – 2018
9.2.5.5.5.2. Market Forecast,
2019 – 2027
9.2.6. Fully Immersive
Technology
9.2.6.1.
Definition
9.2.6.2.
Market Estimation and
Penetration, 2015 – 2018
9.2.6.3.
Market Forecast, 2019 – 2027
9.2.6.4.
Compound Annual Growth Rate
(CAGR)
9.2.6.5.
Regional Bifurcation
9.2.6.5.1.
North America
9.2.6.5.1.1. Market Estimation,
2015 – 2018
9.2.6.5.1.2. Market Forecast,
2019 – 2027
9.2.6.5.2.
Europe
9.2.6.5.2.1. Market Estimation,
2015 – 2018
9.2.6.5.2.2. Market Forecast,
2019 – 2027
9.2.6.5.3.
Asia Pacific
9.2.6.5.3.1. Market Estimation,
2015 – 2018
9.2.6.5.3.2. Market Forecast,
2019 – 2027
9.2.6.5.4.
Middle East and Africa
9.2.6.5.4.1. Market Estimation,
2015 – 2018
9.2.6.5.4.2. Market Forecast,
2019 – 2027
9.2.6.5.5.
Latin America
9.2.6.5.5.1. Market Estimation,
2015 – 2018
9.2.6.5.5.2. Market Forecast,
2019 – 2027
9.3. Key Segment for
Channeling Investments
9.3.1. By AR/VR Technology
10. Global Augmented Reality and Virtual Reality Market Analysis
and Forecasts, 2019 – 2027
10.1. Overview
10.2. Global Augmented Reality
and Virtual Reality Market Revenue (US$ Mn) and Forecasts, By End User
10.2.1. Individual
10.2.1.1.
Definition
10.2.1.2.
Market Estimation and
Penetration, 2015 – 2018
10.2.1.3.
Market Forecast, 2019 – 2027
10.2.1.4.
Compound Annual Growth Rate
(CAGR)
10.2.1.5.
Regional Bifurcation
10.2.1.5.1.
North America
10.2.1.5.1.1. Market
Estimation, 2015 – 2018
10.2.1.5.1.2. Market Forecast,
2019 – 2027
10.2.1.5.2.
Europe
10.2.1.5.2.1. Market
Estimation, 2015 – 2018
10.2.1.5.2.2. Market Forecast,
2019 – 2027
10.2.1.5.3.
Asia Pacific
10.2.1.5.3.1. Market
Estimation, 2015 – 2018
10.2.1.5.3.2. Market Forecast,
2019 – 2027
10.2.1.5.4.
Middle East and Africa
10.2.1.5.4.1. Market
Estimation, 2015 – 2018
10.2.1.5.4.2. Market Forecast,
2019 – 2027
10.2.1.5.5.
Latin America
10.2.1.5.5.1. Market
Estimation, 2015 – 2018
10.2.1.5.5.2. Market Forecast,
2019 – 2027
10.2.2. Businesses (Definition,
Market Estimation and Penetration, 2015 – 2018, Market Estimation (2015 – 2018),
Market Forecast (2019 – 2027), Compound Annual Growth Rate (CAGR), Regional
Bifurcation (North America, Europe, Asia Pacific, Middle East and Africa, Latin
America) and Information on Aerospace & Defense, Education, Gaming &
Entertainment, Healthcare, Travel & Tourism, Transportation &
Logistics, Others)
10.2.2.1.
Aerospace & Defense
10.2.2.2.
Education
10.2.2.3.
Gaming & Entertainment
10.2.2.4.
Healthcare
10.2.2.5.
Travel & Tourism
10.2.2.6.
Transportation & Logistics
10.2.2.7.
Others
10.3. Key Segment for
Channeling Investments
10.3.1. By End User
11. North America Augmented Reality and Virtual Reality Market
Analysis and Forecasts, 2019 - 2027
11.1. Overview
11.1.1. North America Augmented
Reality and Virtual Reality Market Revenue (US$ Mn)
11.2. North America Augmented
Reality and Virtual Reality Market Revenue (US$ Mn) and Forecasts, By Offerings
11.2.1. Hardware
11.2.1.1.
Standalone
11.2.1.1.1. Sensors
11.2.1.1.1.1. Accelerometers
11.2.1.1.1.2. Gyroscopes
11.2.1.1.1.3. Magnetometers
11.2.1.1.1.4. Proximity Sensors
11.2.1.1.1.5. Others
11.2.1.1.2. Semiconductor Components
11.2.1.1.2.1. Integrated Circuits
11.2.1.1.2.2. Processors/Controllers
11.2.1.1.2.3. Cameras
11.2.1.1.2.4. Position Trackers
11.2.1.1.2.5. Others
11.2.1.2.
Integrated
11.2.1.2.1.
Head-mounted Displays
11.2.1.2.2.
Head-up Displays
11.2.1.2.3.
Gesture-tracking Devices
11.2.1.2.4.
Projectors & Display Walls
11.2.2. Software
11.2.2.1.
3D Modelling Software
11.2.2.2.
Visualization Software
11.2.2.3.
Remote Collaboration Software
11.2.2.4.
Documentation Software
11.2.2.5.
Workflow Optimization Software
11.2.2.6.
Navigation Software
11.2.2.7.
Others
11.2.3. Services
11.2.3.1.
Professional Services
11.2.3.2.
Managed Services
11.3. North America Augmented
Reality and Virtual Reality Market Revenue (US$ Mn) and Forecasts, By AR/VR
Technology
11.3.1. Monitor-based
Technology
11.3.2. Near-eye-based
Technology
11.3.3. Mobile Augmented
Reality
11.3.4. Non-immersive
Technology
11.3.5. Semi-immersive
Technology
11.3.6. Fully Immersive
Technology
11.4. North America Augmented
Reality and Virtual Reality Market Revenue (US$ Mn) and Forecasts, By End User
11.4.1. Individual
11.4.2. Businesses
11.4.2.1.
Aerospace & Defense
11.4.2.2.
Education
11.4.2.3.
Gaming & Entertainment
11.4.2.4.
Healthcare
11.4.2.5.
Travel & Tourism
11.4.2.6.
Transportation & Logistics
11.4.2.7.
Others
11.5. North America Augmented
Reality and Virtual Reality Market Revenue (US$ Mn) and Forecasts, By Country
11.5.1. U.S
11.5.1.1.
U.S Augmented Reality and
Virtual Reality Market Revenue (US$ Mn) and Forecasts, By Offerings
11.5.1.1.1.
Hardware
11.5.1.1.1.1. Standalone
11.5.1.1.1.1.1. Sensors
11.5.1.1.1.1.1.1. Accelerometers
11.5.1.1.1.1.1.2. Gyroscopes
11.5.1.1.1.1.1.3. Magnetometers
11.5.1.1.1.1.1.4. Proximity Sensors
11.5.1.1.1.1.1.5. Others
11.5.1.1.1.1.2. Semiconductor Components
11.5.1.1.1.1.2.1. Integrated Circuits
11.5.1.1.1.1.2.2. Processors/Controllers
11.5.1.1.1.1.2.3. Cameras
11.5.1.1.1.1.2.4. Position
Trackers
11.5.1.1.1.1.2.5. Others
11.5.1.1.1.2. Integrated
11.5.1.1.1.2.1. Head-mounted
Displays
11.5.1.1.1.2.2. Head-up
Displays
11.5.1.1.1.2.3. Gesture-tracking
Devices
11.5.1.1.1.2.4. Projectors
& Display Walls
11.5.1.1.2.
Software
11.5.1.1.2.1. 3D Modelling
Software
11.5.1.1.2.2. Visualization
Software
11.5.1.1.2.3. Remote
Collaboration Software
11.5.1.1.2.4. Documentation
Software
11.5.1.1.2.5. Workflow
Optimization Software
11.5.1.1.2.6. Navigation
Software
11.5.1.1.2.7. Others
11.5.1.1.3.
Services
11.5.1.1.3.1. Professional
Services
11.5.1.1.3.2. Managed Services
11.5.1.2.
U.S Augmented Reality and
Virtual Reality Market Revenue (US$ Mn) and Forecasts, By AR/VR Technology
11.5.1.2.1.
Monitor-based Technology
11.5.1.2.2.
Near-eye-based Technology
11.5.1.2.3.
Mobile Augmented Reality
11.5.1.2.4.
Non-immersive Technology
11.5.1.2.5.
Semi-immersive Technology
11.5.1.2.6.
Fully Immersive Technology
11.5.1.3.
U.S Augmented Reality and
Virtual Reality Market Revenue (US$ Mn) and Forecasts, By End User
11.5.1.3.1.
Individual
11.5.1.3.2.
Businesses
11.5.1.3.2.1. Aerospace &
Defense
11.5.1.3.2.2. Education
11.5.1.3.2.3. Gaming &
Entertainment
11.5.1.3.2.4. Healthcare
11.5.1.3.2.5. Travel &
Tourism
11.5.1.3.2.6. Transportation
& Logistics
11.5.1.3.2.7. Others
11.5.2. Canada
11.5.2.1.
Canada Augmented Reality and
Virtual Reality Market Revenue (US$ Mn) and Forecasts, By Offerings
11.5.2.1.1.
Hardware
11.5.2.1.1.1. Standalone
11.5.2.1.1.1.1. Sensors
11.5.2.1.1.1.1.1. Accelerometers
11.5.2.1.1.1.1.2. Gyroscopes
11.5.2.1.1.1.1.3. Magnetometers
11.5.2.1.1.1.1.4. Proximity Sensors
11.5.2.1.1.1.1.5. Others
11.5.2.1.1.1.2. Semiconductor Components
11.5.2.1.1.1.2.1. Integrated Circuits
11.5.2.1.1.1.2.2. Processors/Controllers
11.5.2.1.1.1.2.3. Cameras
11.5.2.1.1.1.2.4. Position
Trackers
11.5.2.1.1.1.2.5. Others
11.5.2.1.1.2. Integrated
11.5.2.1.1.2.1. Head-mounted Displays
11.5.2.1.1.2.2. Head-up
Displays
11.5.2.1.1.2.3. Gesture-tracking
Devices
11.5.2.1.1.2.4. Projectors
& Display Walls
11.5.2.1.2.
Software
11.5.2.1.2.1. 3D Modelling
Software
11.5.2.1.2.2. Visualization
Software
11.5.2.1.2.3. Remote
Collaboration Software
11.5.2.1.2.4. Documentation
Software
11.5.2.1.2.5. Workflow
Optimization Software
11.5.2.1.2.6. Navigation
Software
11.5.2.1.2.7. Others
11.5.2.1.3.
Services
11.5.2.1.3.1. Professional
Services
11.5.2.1.3.2. Managed Services
11.5.2.2.
Canada Augmented Reality and
Virtual Reality Market Revenue (US$ Mn) and Forecasts, By AR/VR Technology
11.5.2.2.1.
Monitor-based Technology
11.5.2.2.2.
Near-eye-based Technology
11.5.2.2.3.
Mobile Augmented Reality
11.5.2.2.4.
Non-immersive Technology
11.5.2.2.5.
Semi-immersive Technology
11.5.2.2.6.
Fully Immersive Technology
11.5.2.3.
Canada Augmented Reality and
Virtual Reality Market Revenue (US$ Mn) and Forecasts, By End User
11.5.2.3.1.
Individual
11.5.2.3.2.
Businesses
11.5.2.3.2.1. Aerospace &
Defense
11.5.2.3.2.2. Education
11.5.2.3.2.3. Gaming &
Entertainment
11.5.2.3.2.4. Healthcare
11.5.2.3.2.5. Travel &
Tourism
11.5.2.3.2.6. Transportation
& Logistics
11.5.2.3.2.7. Others
11.5.3. Mexico
11.5.3.1.
Mexico Augmented Reality and
Virtual Reality Market Revenue (US$ Mn) and Forecasts, By Offerings
11.5.3.1.1.
Hardware
11.5.3.1.1.1. Standalone
11.5.3.1.1.1.1. Sensors
11.5.3.1.1.1.1.1. Accelerometers
11.5.3.1.1.1.1.2. Gyroscopes
11.5.3.1.1.1.1.3. Magnetometers
11.5.3.1.1.1.1.4. Proximity Sensors
11.5.3.1.1.1.1.5. Others
11.5.3.1.1.1.2. Semiconductor Components
11.5.3.1.1.1.2.1. Integrated Circuits
11.5.3.1.1.1.2.2. Processors/Controllers
11.5.3.1.1.1.2.3. Cameras
11.5.3.1.1.1.2.4. Position
Trackers
11.5.3.1.1.1.2.5. Others
11.5.3.1.1.2. Integrated
11.5.3.1.1.2.1. Head-mounted
Displays
11.5.3.1.1.2.2. Head-up
Displays
11.5.3.1.1.2.3. Gesture-tracking
Devices
11.5.3.1.1.2.4. Projectors
& Display Walls
11.5.3.1.2.
Software
11.5.3.1.2.1. 3D Modelling
Software
11.5.3.1.2.2. Visualization
Software
11.5.3.1.2.3. Remote
Collaboration Software
11.5.3.1.2.4. Documentation
Software
11.5.3.1.2.5. Workflow
Optimization Software
11.5.3.1.2.6. Navigation
Software
11.5.3.1.2.7. Others
11.5.3.1.3.
Services
11.5.3.1.3.1. Professional
Services
11.5.3.1.3.2. Managed Services
11.5.3.2.
Mexico Augmented Reality and
Virtual Reality Market Revenue (US$ Mn) and Forecasts, By AR/VR Technology
11.5.3.2.1.
Monitor-based Technology
11.5.3.2.2.
Near-eye-based Technology
11.5.3.2.3.
Mobile Augmented Reality
11.5.3.2.4.
Non-immersive Technology
11.5.3.2.5.
Semi-immersive Technology
11.5.3.2.6.
Fully Immersive Technology
11.5.3.3.
Mexico Augmented Reality and
Virtual Reality Market Revenue (US$ Mn) and Forecasts, By End User
11.5.3.3.1.
Individual
11.5.3.3.2.
Businesses
11.5.3.3.2.1. Aerospace &
Defense
11.5.3.3.2.2. Education
11.5.3.3.2.3. Gaming &
Entertainment
11.5.3.3.2.4. Healthcare
11.5.3.3.2.5. Travel &
Tourism
11.5.3.3.2.6. Transportation
& Logistics
11.5.3.3.2.7. Others
11.5.4. Rest of North America
11.5.4.1.
Rest of North America Augmented
Reality and Virtual Reality Market Revenue (US$ Mn) and Forecasts, By Offerings
11.5.4.1.1.
Hardware
11.5.4.1.1.1. Standalone
11.5.4.1.1.1.1. Sensors
11.5.4.1.1.1.1.1. Accelerometers
11.5.4.1.1.1.1.2. Gyroscopes
11.5.4.1.1.1.1.3. Magnetometers
11.5.4.1.1.1.1.4. Proximity Sensors
11.5.4.1.1.1.1.5. Others
11.5.4.1.1.1.2. Semiconductor Components
11.5.4.1.1.1.2.1. Integrated Circuits
11.5.4.1.1.1.2.2. Processors/Controllers
11.5.4.1.1.1.2.3. Cameras
11.5.4.1.1.1.2.4. Position
Trackers
11.5.4.1.1.1.2.5. Others
11.5.4.1.1.2. Integrated
11.5.4.1.1.2.1. Head-mounted
Displays
11.5.4.1.1.2.2. Head-up
Displays
11.5.4.1.1.2.3. Gesture-tracking
Devices
11.5.4.1.1.2.4. Projectors
& Display Walls
11.5.4.1.2.
Software
11.5.4.1.2.1. 3D Modelling
Software
11.5.4.1.2.2. Visualization
Software
11.5.4.1.2.3. Remote
Collaboration Software
11.5.4.1.2.4. Documentation
Software
11.5.4.1.2.5. Workflow
Optimization Software
11.5.4.1.2.6. Navigation
Software
11.5.4.1.2.7. Others
11.5.4.1.3.
Services
11.5.4.1.3.1. Professional
Services
11.5.4.1.3.2. Managed Services
11.5.4.2.
Rest of North America Augmented
Reality and Virtual Reality Market Revenue (US$ Mn) and Forecasts, By AR/VR
Technology
11.5.4.2.1.
Monitor-based Technology
11.5.4.2.2.
Near-eye-based Technology
11.5.4.2.3.
Mobile Augmented Reality
11.5.4.2.4.
Non-immersive Technology
11.5.4.2.5.
Semi-immersive Technology
11.5.4.2.6.
Fully Immersive Technology
11.5.4.3.
Rest of North America Augmented
Reality and Virtual Reality Market Revenue (US$ Mn) and Forecasts, By End User
11.5.4.3.1.
Individual
11.5.4.3.2.
Businesses
11.5.4.3.2.1. Aerospace &
Defense
11.5.4.3.2.2. Education
11.5.4.3.2.3. Gaming &
Entertainment
11.5.4.3.2.4. Healthcare
11.5.4.3.2.5. Travel &
Tourism
11.5.4.3.2.6. Transportation &
Logistics
11.5.4.3.2.7. Others
11.6. Key Segment for
Channeling Investments
11.6.1. By Country
11.6.2. By Offerings
11.6.3. By AR/VR Technology
11.6.4. By End User
12. Europe Augmented Reality and Virtual Reality Market Analysis
and Forecasts, 2019 - 2027
12.1. Overview
12.1.1. Europe Augmented
Reality and Virtual Reality Market Revenue (US$ Mn)
12.2. Europe Augmented Reality
and Virtual Reality Market Revenue (US$ Mn) and Forecasts, By Offerings
12.2.1. Hardware
12.2.1.1.
Standalone
12.2.1.1.1. Sensors
12.2.1.1.1.1. Accelerometers
12.2.1.1.1.2. Gyroscopes
12.2.1.1.1.3. Magnetometers
12.2.1.1.1.4. Proximity Sensors
12.2.1.1.1.5. Others
12.2.1.1.2. Semiconductor Components
12.2.1.1.2.1. Integrated Circuits
12.2.1.1.2.2. Processors/Controllers
12.2.1.1.2.3. Cameras
12.2.1.1.2.4. Position Trackers
12.2.1.1.2.5. Others
12.2.1.2.
Integrated
12.2.1.2.1.
Head-mounted Displays
12.2.1.2.2.
Head-up Displays
12.2.1.2.3.
Gesture-tracking Devices
12.2.1.2.4.
Projectors & Display Walls
12.2.2. Software
12.2.2.1.
3D Modelling Software
12.2.2.2.
Visualization Software
12.2.2.3.
Remote Collaboration Software
12.2.2.4.
Documentation Software
12.2.2.5.
Workflow Optimization Software
12.2.2.6.
Navigation Software
12.2.2.7.
Others
12.2.3. Services
12.2.3.1.
Professional Services
12.2.3.2.
Managed Services
12.3. Europe Augmented Reality
and Virtual Reality Market Revenue (US$ Mn) and Forecasts, By AR/VR Technology
12.3.1. Monitor-based Technology
12.3.2. Near-eye-based
Technology
12.3.3. Mobile Augmented
Reality
12.3.4. Non-immersive
Technology
12.3.5. Semi-immersive
Technology
12.3.6. Fully Immersive
Technology
12.4. Europe Augmented Reality
and Virtual Reality Market Revenue (US$ Mn) and Forecasts, By End User
12.4.1. Individual
12.4.2. Businesses
12.4.2.1.
Aerospace & Defense
12.4.2.2.
Education
12.4.2.3.
Gaming & Entertainment
12.4.2.4.
Healthcare
12.4.2.5.
Travel & Tourism
12.4.2.6.
Transportation & Logistics
12.4.2.7.
Others
12.5. Europe Augmented Reality
and Virtual Reality Market Revenue (US$ Mn) and Forecasts, By Country
12.5.1. France
12.5.1.1.
France Augmented Reality and
Virtual Reality Market Revenue (US$ Mn) and Forecasts, By Offerings
12.5.1.1.1.
Hardware
12.5.1.1.1.1. Standalone
12.5.1.1.1.1.1. Sensors
12.5.1.1.1.1.1.1. Accelerometers
12.5.1.1.1.1.1.2. Gyroscopes
12.5.1.1.1.1.1.3. Magnetometers
12.5.1.1.1.1.1.4. Proximity Sensors
12.5.1.1.1.1.1.5. Others
12.5.1.1.1.1.2. Semiconductor Components
12.5.1.1.1.1.2.1. Integrated Circuits
12.5.1.1.1.1.2.2. Processors/Controllers
12.5.1.1.1.1.2.3. Cameras
12.5.1.1.1.1.2.4. Position
Trackers
12.5.1.1.1.1.2.5. Others
12.5.1.1.1.2. Integrated
12.5.1.1.1.2.1. Head-mounted
Displays
12.5.1.1.1.2.2. Head-up
Displays
12.5.1.1.1.2.3. Gesture-tracking
Devices
12.5.1.1.1.2.4. Projectors
& Display Walls
12.5.1.1.2.
Software
12.5.1.1.2.1. 3D Modelling
Software
12.5.1.1.2.2. Visualization
Software
12.5.1.1.2.3. Remote
Collaboration Software
12.5.1.1.2.4. Documentation
Software
12.5.1.1.2.5. Workflow
Optimization Software
12.5.1.1.2.6. Navigation Software
12.5.1.1.2.7. Others
12.5.1.1.3.
Services
12.5.1.1.3.1. Professional
Services
12.5.1.1.3.2. Managed Services
12.5.1.2.
France Augmented Reality and
Virtual Reality Market Revenue (US$ Mn) and Forecasts, By AR/VR Technology
12.5.1.2.1.
Monitor-based Technology
12.5.1.2.2.
Near-eye-based Technology
12.5.1.2.3.
Mobile Augmented Reality
12.5.1.2.4.
Non-immersive Technology
12.5.1.2.5.
Semi-immersive Technology
12.5.1.2.6.
Fully Immersive Technology
12.5.1.3.
France Augmented Reality and
Virtual Reality Market Revenue (US$ Mn) and Forecasts, By End User
12.5.1.3.1.
Individual
12.5.1.3.2.
Businesses
12.5.1.3.2.1. Aerospace &
Defense
12.5.1.3.2.2. Education
12.5.1.3.2.3. Gaming &
Entertainment
12.5.1.3.2.4. Healthcare
12.5.1.3.2.5. Travel &
Tourism
12.5.1.3.2.6. Transportation
& Logistics
12.5.1.3.2.7. Others
12.5.2. The UK
12.5.2.1.
The UK Augmented Reality and
Virtual Reality Market Revenue (US$ Mn) and Forecasts, By Offerings
12.5.2.1.1.
Hardware
12.5.2.1.1.1. Standalone
12.5.2.1.1.1.1. Sensors
12.5.2.1.1.1.1.1. Accelerometers
12.5.2.1.1.1.1.2. Gyroscopes
12.5.2.1.1.1.1.3. Magnetometers
12.5.2.1.1.1.1.4. Proximity Sensors
12.5.2.1.1.1.1.5. Others
12.5.2.1.1.1.2. Semiconductor Components
12.5.2.1.1.1.2.1. Integrated Circuits
12.5.2.1.1.1.2.2. Processors/Controllers
12.5.2.1.1.1.2.3. Cameras
12.5.2.1.1.1.2.4. Position
Trackers
12.5.2.1.1.1.2.5. Others
12.5.2.1.1.2. Integrated
12.5.2.1.1.2.1. Head-mounted
Displays
12.5.2.1.1.2.2. Head-up
Displays
12.5.2.1.1.2.3. Gesture-tracking
Devices
12.5.2.1.1.2.4. Projectors
& Display Walls
12.5.2.1.2.
Software
12.5.2.1.2.1. 3D Modelling
Software
12.5.2.1.2.2. Visualization
Software
12.5.2.1.2.3. Remote Collaboration
Software
12.5.2.1.2.4. Documentation
Software
12.5.2.1.2.5. Workflow
Optimization Software
12.5.2.1.2.6. Navigation
Software
12.5.2.1.2.7. Others
12.5.2.1.3.
Services
12.5.2.1.3.1. Professional
Services
12.5.2.1.3.2. Managed Services
12.5.2.2.
The UK Augmented Reality and
Virtual Reality Market Revenue (US$ Mn) and Forecasts, By AR/VR Technology
12.5.2.2.1.
Monitor-based Technology
12.5.2.2.2.
Near-eye-based Technology
12.5.2.2.3.
Mobile Augmented Reality
12.5.2.2.4.
Non-immersive Technology
12.5.2.2.5.
Semi-immersive Technology
12.5.2.2.6.
Fully Immersive Technology
12.5.2.3.
The UK Augmented Reality and
Virtual Reality Market Revenue (US$ Mn) and Forecasts, By End User
12.5.2.3.1.
Individual
12.5.2.3.2.
Businesses
12.5.2.3.2.1. Aerospace &
Defense
12.5.2.3.2.2. Education
12.5.2.3.2.3. Gaming &
Entertainment
12.5.2.3.2.4. Healthcare
12.5.2.3.2.5. Travel &
Tourism
12.5.2.3.2.6. Transportation
& Logistics
12.5.2.3.2.7. Others
12.5.3. Spain
12.5.3.1.
Spain Augmented Reality and
Virtual Reality Market Revenue (US$ Mn) and Forecasts, By Offerings
12.5.3.1.1.
Hardware
12.5.3.1.1.1. Standalone
12.5.3.1.1.1.1. Sensors
12.5.3.1.1.1.1.1. Accelerometers
12.5.3.1.1.1.1.2. Gyroscopes
12.5.3.1.1.1.1.3. Magnetometers
12.5.3.1.1.1.1.4. Proximity Sensors
12.5.3.1.1.1.1.5. Others
12.5.3.1.1.1.2. Semiconductor Components
12.5.3.1.1.1.2.1. Integrated Circuits
12.5.3.1.1.1.2.2. Processors/Controllers
12.5.3.1.1.1.2.3. Cameras
12.5.3.1.1.1.2.4. Position
Trackers
12.5.3.1.1.1.2.5. Others
12.5.3.1.1.2. Integrated
12.5.3.1.1.2.1. Head-mounted
Displays
12.5.3.1.1.2.2. Head-up
Displays
12.5.3.1.1.2.3. Gesture-tracking
Devices
12.5.3.1.1.2.4. Projectors
& Display Walls
12.5.3.1.2.
Software
12.5.3.1.2.1. 3D Modelling
Software
12.5.3.1.2.2. Visualization
Software
12.5.3.1.2.3. Remote
Collaboration Software
12.5.3.1.2.4. Documentation
Software
12.5.3.1.2.5. Workflow
Optimization Software
12.5.3.1.2.6. Navigation
Software
12.5.3.1.2.7. Others
12.5.3.1.3.
Services
12.5.3.1.3.1. Professional
Services
12.5.3.1.3.2. Managed Services
12.5.3.2.
Spain Augmented Reality and
Virtual Reality Market Revenue (US$ Mn) and Forecasts, By AR/VR Technology
12.5.3.2.1.
Monitor-based Technology
12.5.3.2.2.
Near-eye-based Technology
12.5.3.2.3.
Mobile Augmented Reality
12.5.3.2.4.
Non-immersive Technology
12.5.3.2.5.
Semi-immersive Technology
12.5.3.2.6.
Fully Immersive Technology
12.5.3.3.
Spain Augmented Reality and
Virtual Reality Market Revenue (US$ Mn) and Forecasts, By End User
12.5.3.3.1.
Individual
12.5.3.3.2.
Businesses
12.5.3.3.2.1. Aerospace &
Defense
12.5.3.3.2.2. Education
12.5.3.3.2.3. Gaming &
Entertainment
12.5.3.3.2.4. Healthcare
12.5.3.3.2.5. Travel &
Tourism
12.5.3.3.2.6. Transportation
& Logistics
12.5.3.3.2.7. Others
12.5.4. Germany
12.5.4.1.
Germany Augmented Reality and
Virtual Reality Market Revenue (US$ Mn) and Forecasts, By Offerings
12.5.4.1.1.
Hardware
12.5.4.1.1.1. Standalone
12.5.4.1.1.1.1. Sensors
12.5.4.1.1.1.1.1. Accelerometers
12.5.4.1.1.1.1.2. Gyroscopes
12.5.4.1.1.1.1.3. Magnetometers
12.5.4.1.1.1.1.4. Proximity Sensors
12.5.4.1.1.1.1.5. Others
12.5.4.1.1.1.2. Semiconductor Components
12.5.4.1.1.1.2.1. Integrated Circuits
12.5.4.1.1.1.2.2. Processors/Controllers
12.5.4.1.1.1.2.3. Cameras
12.5.4.1.1.1.2.4. Position
Trackers
12.5.4.1.1.1.2.5. Others
12.5.4.1.1.2. Integrated
12.5.4.1.1.2.1. Head-mounted
Displays
12.5.4.1.1.2.2. Head-up
Displays
12.5.4.1.1.2.3. Gesture-tracking
Devices
12.5.4.1.1.2.4. Projectors
& Display Walls
12.5.4.1.2.
Software
12.5.4.1.2.1. 3D Modelling
Software
12.5.4.1.2.2. Visualization
Software
12.5.4.1.2.3. Remote
Collaboration Software
12.5.4.1.2.4. Documentation
Software
12.5.4.1.2.5. Workflow
Optimization Software
12.5.4.1.2.6. Navigation
Software
12.5.4.1.2.7. Others
12.5.4.1.3.
Services
12.5.4.1.3.1. Professional
Services
12.5.4.1.3.2. Managed Services
12.5.4.2.
Germany Augmented Reality and
Virtual Reality Market Revenue (US$ Mn) and Forecasts, By AR/VR Technology
12.5.4.2.1.
Monitor-based Technology
12.5.4.2.2.
Near-eye-based Technology
12.5.4.2.3.
Mobile Augmented Reality
12.5.4.2.4.
Non-immersive Technology
12.5.4.2.5.
Semi-immersive Technology
12.5.4.2.6.
Fully Immersive Technology
12.5.4.3.
Germany Augmented Reality and
Virtual Reality Market Revenue (US$ Mn) and Forecasts, By End User
12.5.4.3.1.
Individual
12.5.4.3.2.
Businesses
12.5.4.3.2.1. Aerospace &
Defense
12.5.4.3.2.2. Education
12.5.4.3.2.3. Gaming &
Entertainment
12.5.4.3.2.4. Healthcare
12.5.4.3.2.5. Travel &
Tourism
12.5.4.3.2.6. Transportation
& Logistics
12.5.4.3.2.7. Others
12.5.5. Italy
12.5.5.1.
Italy Augmented Reality and
Virtual Reality Market Revenue (US$ Mn) and Forecasts, By Offerings
12.5.5.1.1.
Hardware
12.5.5.1.1.1. Standalone
12.5.5.1.1.1.1. Sensors
12.5.5.1.1.1.1.1. Accelerometers
12.5.5.1.1.1.1.2. Gyroscopes
12.5.5.1.1.1.1.3. Magnetometers
12.5.5.1.1.1.1.4. Proximity Sensors
12.5.5.1.1.1.1.5. Others
12.5.5.1.1.1.2. Semiconductor Components
12.5.5.1.1.1.2.1. Integrated Circuits
12.5.5.1.1.1.2.2. Processors/Controllers
12.5.5.1.1.1.2.3. Cameras
12.5.5.1.1.1.2.4. Position
Trackers
12.5.5.1.1.1.2.5. Others
12.5.5.1.1.2. Integrated
12.5.5.1.1.2.1. Head-mounted
Displays
12.5.5.1.1.2.2. Head-up
Displays
12.5.5.1.1.2.3. Gesture-tracking
Devices
12.5.5.1.1.2.4. Projectors
& Display Walls
12.5.5.1.2.
Software
12.5.5.1.2.1. 3D Modelling
Software
12.5.5.1.2.2. Visualization Software
12.5.5.1.2.3. Remote
Collaboration Software
12.5.5.1.2.4. Documentation
Software
12.5.5.1.2.5. Workflow
Optimization Software
12.5.5.1.2.6. Navigation
Software
12.5.5.1.2.7. Others
12.5.5.1.3.
Services
12.5.5.1.3.1. Professional
Services
12.5.5.1.3.2. Managed Services
12.5.5.2.
Italy Augmented Reality and
Virtual Reality Market Revenue (US$ Mn) and Forecasts, By AR/VR Technology
12.5.5.2.1.
Monitor-based Technology
12.5.5.2.2.
Near-eye-based Technology
12.5.5.2.3.
Mobile Augmented Reality
12.5.5.2.4.
Non-immersive Technology
12.5.5.2.5.
Semi-immersive Technology
12.5.5.2.6.
Fully Immersive Technology
12.5.5.3.
Italy Augmented Reality and
Virtual Reality Market Revenue (US$ Mn) and Forecasts, By End User
12.5.5.3.1.
Individual
12.5.5.3.2.
Businesses
12.5.5.3.2.1. Aerospace &
Defense
12.5.5.3.2.2. Education
12.5.5.3.2.3. Gaming &
Entertainment
12.5.5.3.2.4. Healthcare
12.5.5.3.2.5. Travel &
Tourism
12.5.5.3.2.6. Transportation
& Logistics
12.5.5.3.2.7. Others
12.5.6. Nordic Countries
12.5.6.1.
Nordic Countries Augmented
Reality and Virtual Reality Market Revenue (US$ Mn) and Forecasts, By Offerings
12.5.6.1.1.
Hardware
12.5.6.1.1.1. Standalone
12.5.6.1.1.1.1. Sensors
12.5.6.1.1.1.1.1. Accelerometers
12.5.6.1.1.1.1.2. Gyroscopes
12.5.6.1.1.1.1.3. Magnetometers
12.5.6.1.1.1.1.4. Proximity Sensors
12.5.6.1.1.1.1.5. Others
12.5.6.1.1.1.2. Semiconductor Components
12.5.6.1.1.1.2.1. Integrated Circuits
12.5.6.1.1.1.2.2. Processors/Controllers
12.5.6.1.1.1.2.3. Cameras
12.5.6.1.1.1.2.4. Position
Trackers
12.5.6.1.1.1.2.5. Others
12.5.6.1.1.2. Integrated
12.5.6.1.1.2.1. Head-mounted
Displays
12.5.6.1.1.2.2. Head-up
Displays
12.5.6.1.1.2.3. Gesture-tracking
Devices
12.5.6.1.1.2.4. Projectors
& Display Walls
12.5.6.1.2.
Software
12.5.6.1.2.1. 3D Modelling
Software
12.5.6.1.2.2. Visualization
Software
12.5.6.1.2.3. Remote
Collaboration Software
12.5.6.1.2.4. Documentation
Software
12.5.6.1.2.5. Workflow
Optimization Software
12.5.6.1.2.6. Navigation
Software
12.5.6.1.2.7. Others
12.5.6.1.3.
Services
12.5.6.1.3.1. Professional Services
12.5.6.1.3.2. Managed Services
12.5.6.2.
Nordic Countries Augmented
Reality and Virtual Reality Market Revenue (US$ Mn) and Forecasts, By AR/VR
Technology
12.5.6.2.1.
Monitor-based Technology
12.5.6.2.2.
Near-eye-based Technology
12.5.6.2.3.
Mobile Augmented Reality
12.5.6.2.4.
Non-immersive Technology
12.5.6.2.5.
Semi-immersive Technology
12.5.6.2.6.
Fully Immersive Technology
12.5.6.3.
Nordic Countries Augmented
Reality and Virtual Reality Market Revenue (US$ Mn) and Forecasts, By End User
12.5.6.3.1.
Individual
12.5.6.3.2.
Businesses
12.5.6.3.2.1. Aerospace &
Defense
12.5.6.3.2.2. Education
12.5.6.3.2.3. Gaming &
Entertainment
12.5.6.3.2.4. Healthcare
12.5.6.3.2.5. Travel &
Tourism
12.5.6.3.2.6. Transportation
& Logistics
12.5.6.3.2.7. Others
12.5.6.4.
Nordic Countries Augmented
Reality and Virtual Reality Market Revenue (US$ Mn) and Forecasts, By Country
12.5.6.4.1.
Denmark
12.5.6.4.2.
Finland
12.5.6.4.3.
Iceland
12.5.6.4.4.
Sweden
12.5.6.4.5.
Norway
12.5.7. Benelux Union
12.5.7.1.
Benelux Union Augmented Reality
and Virtual Reality Market Revenue (US$ Mn) and Forecasts, By Offerings
12.5.7.1.1.
Hardware
12.5.7.1.1.1. Standalone
12.5.7.1.1.1.1. Sensors
12.5.7.1.1.1.1.1. Accelerometers
12.5.7.1.1.1.1.2. Gyroscopes
12.5.7.1.1.1.1.3. Magnetometers
12.5.7.1.1.1.1.4. Proximity Sensors
12.5.7.1.1.1.1.5. Others
12.5.7.1.1.1.2. Semiconductor Components
12.5.7.1.1.1.2.1. Integrated Circuits
12.5.7.1.1.1.2.2. Processors/Controllers
12.5.7.1.1.1.2.3. Cameras
12.5.7.1.1.1.2.4. Position
Trackers
12.5.7.1.1.1.2.5. Others
12.5.7.1.1.2. Integrated
12.5.7.1.1.2.1. Head-mounted Displays
12.5.7.1.1.2.2. Head-up
Displays
12.5.7.1.1.2.3. Gesture-tracking
Devices
12.5.7.1.1.2.4. Projectors
& Display Walls
12.5.7.1.2.
Software
12.5.7.1.2.1. 3D Modelling
Software
12.5.7.1.2.2. Visualization
Software
12.5.7.1.2.3. Remote
Collaboration Software
12.5.7.1.2.4. Documentation
Software
12.5.7.1.2.5. Workflow
Optimization Software
12.5.7.1.2.6. Navigation
Software
12.5.7.1.2.7. Others
12.5.7.1.3.
Services
12.5.7.1.3.1. Professional
Services
12.5.7.1.3.2. Managed Services
12.5.7.2.
Benelux Union Augmented Reality
and Virtual Reality Market Revenue (US$ Mn) and Forecasts, By AR/VR Technology
12.5.7.2.1.
Monitor-based Technology
12.5.7.2.2.
Near-eye-based Technology
12.5.7.2.3.
Mobile Augmented Reality
12.5.7.2.4.
Non-immersive Technology
12.5.7.2.5.
Semi-immersive Technology
12.5.7.2.6.
Fully Immersive Technology
12.5.7.3.
Benelux Union Augmented Reality
and Virtual Reality Market Revenue (US$ Mn) and Forecasts, By End User
12.5.7.3.1.
Individual
12.5.7.3.2.
Businesses
12.5.7.3.2.1. Aerospace &
Defense
12.5.7.3.2.2. Education
12.5.7.3.2.3. Gaming &
Entertainment
12.5.7.3.2.4. Healthcare
12.5.7.3.2.5. Travel &
Tourism
12.5.7.3.2.6. Transportation
& Logistics
12.5.7.3.2.7. Others
12.5.7.4.
Benelux Union Augmented Reality
and Virtual Reality Market Revenue (US$ Mn) and Forecasts, By Country
12.5.7.4.1.
Belgium
12.5.7.4.2.
The Netherlands
12.5.7.4.3.
Luxembourg
12.5.8. Rest of Europe
12.5.8.1.
Rest of Europe Augmented Reality
and Virtual Reality Market Revenue (US$ Mn) and Forecasts, By Offerings
12.5.8.1.1.
Hardware
12.5.8.1.1.1. Standalone
12.5.8.1.1.1.1. Sensors
12.5.8.1.1.1.1.1. Accelerometers
12.5.8.1.1.1.1.2. Gyroscopes
12.5.8.1.1.1.1.3. Magnetometers
12.5.8.1.1.1.1.4. Proximity Sensors
12.5.8.1.1.1.1.5. Others
12.5.8.1.1.1.2. Semiconductor Components
12.5.8.1.1.1.2.1. Integrated Circuits
12.5.8.1.1.1.2.2. Processors/Controllers
12.5.8.1.1.1.2.3. Cameras
12.5.8.1.1.1.2.4. Position
Trackers
12.5.8.1.1.1.2.5. Others
12.5.8.1.1.2. Integrated
12.5.8.1.1.2.1. Head-mounted
Displays
12.5.8.1.1.2.2. Head-up
Displays
12.5.8.1.1.2.3. Gesture-tracking
Devices
12.5.8.1.1.2.4. Projectors
& Display Walls
12.5.8.1.2.
Software
12.5.8.1.2.1. 3D Modelling
Software
12.5.8.1.2.2. Visualization
Software
12.5.8.1.2.3. Remote
Collaboration Software
12.5.8.1.2.4. Documentation
Software
12.5.8.1.2.5. Workflow
Optimization Software
12.5.8.1.2.6. Navigation
Software
12.5.8.1.2.7. Others
12.5.8.1.3.
Services
12.5.8.1.3.1. Professional
Services
12.5.8.1.3.2. Managed Services
12.5.8.2.
Rest of Europe Augmented Reality
and Virtual Reality Market Revenue (US$ Mn) and Forecasts, By AR/VR Technology
12.5.8.2.1.
Monitor-based Technology
12.5.8.2.2.
Near-eye-based Technology
12.5.8.2.3.
Mobile Augmented Reality
12.5.8.2.4.
Non-immersive Technology
12.5.8.2.5.
Semi-immersive Technology
12.5.8.2.6.
Fully Immersive Technology
12.5.8.3.
Rest of Europe Augmented Reality
and Virtual Reality Market Revenue (US$ Mn) and Forecasts, By End User
12.5.8.3.1.
Individual
12.5.8.3.2.
Businesses
12.5.8.3.2.1. Aerospace &
Defense
12.5.8.3.2.2. Education
12.5.8.3.2.3. Gaming &
Entertainment
12.5.8.3.2.4. Healthcare
12.5.8.3.2.5. Travel &
Tourism
12.5.8.3.2.6. Transportation
& Logistics
12.5.8.3.2.7. Others
12.6. Key Segment for
Channeling Investments
12.6.1. By Country
12.6.2. By Offerings
12.6.3. By AR/VR Technology
12.6.4. By End User
13. Asia Pacific Augmented Reality and Virtual Reality Market
Analysis and Forecasts, 2019 - 2027
13.1. Overview
13.1.1. Asia Pacific Augmented
Reality and Virtual Reality Market Revenue (US$ Mn)
13.2. Asia Pacific Augmented
Reality and Virtual Reality Market Revenue (US$ Mn) and Forecasts, By Offerings
13.2.1. Hardware
13.2.1.1.
Standalone
13.2.1.1.1. Sensors
13.2.1.1.1.1. Accelerometers
13.2.1.1.1.2. Gyroscopes
13.2.1.1.1.3. Magnetometers
13.2.1.1.1.4. Proximity Sensors
13.2.1.1.1.5. Others
13.2.1.1.2. Semiconductor Components
13.2.1.1.2.1. Integrated Circuits
13.2.1.1.2.2. Processors/Controllers
13.2.1.1.2.3. Cameras
13.2.1.1.2.4. Position Trackers
13.2.1.1.2.5. Others
13.2.1.2.
Integrated
13.2.1.2.1.
Head-mounted Displays
13.2.1.2.2.
Head-up Displays
13.2.1.2.3.
Gesture-tracking Devices
13.2.1.2.4.
Projectors & Display Walls
13.2.2. Software
13.2.2.1.
3D Modelling Software
13.2.2.2.
Visualization Software
13.2.2.3.
Remote Collaboration Software
13.2.2.4.
Documentation Software
13.2.2.5.
Workflow Optimization Software
13.2.2.6.
Navigation Software
13.2.2.7.
Others
13.2.3. Services
13.2.3.1.
Professional Services
13.2.3.2.
Managed Services
13.3. Asia Pacific Augmented
Reality and Virtual Reality Market Revenue (US$ Mn) and Forecasts, By AR/VR
Technology
13.3.1. Monitor-based
Technology
13.3.2. Near-eye-based
Technology
13.3.3. Mobile Augmented
Reality
13.3.4. Non-immersive
Technology
13.3.5. Semi-immersive
Technology
13.3.6. Fully Immersive
Technology
13.4. Asia Pacific Augmented
Reality and Virtual Reality Market Revenue (US$ Mn) and Forecasts, By End User
13.4.1. Individual
13.4.2. Businesses
13.4.2.1.
Aerospace & Defense
13.4.2.2.
Education
13.4.2.3.
Gaming & Entertainment
13.4.2.4.
Healthcare
13.4.2.5.
Travel & Tourism
13.4.2.6.
Transportation & Logistics
13.4.2.7.
Others
13.5. Asia Pacific Augmented
Reality and Virtual Reality Market Revenue (US$ Mn) and Forecasts, By Country
13.5.1. China
13.5.1.1.
China Augmented Reality and
Virtual Reality Market Revenue (US$ Mn) and Forecasts, By Offerings
13.5.1.1.1.
Hardware
13.5.1.1.1.1. Standalone
13.5.1.1.1.1.1. Sensors
13.5.1.1.1.1.1.1. Accelerometers
13.5.1.1.1.1.1.2. Gyroscopes
13.5.1.1.1.1.1.3. Magnetometers
13.5.1.1.1.1.1.4. Proximity Sensors
13.5.1.1.1.1.1.5. Others
13.5.1.1.1.1.2. Semiconductor Components
13.5.1.1.1.1.2.1. Integrated Circuits
13.5.1.1.1.1.2.2. Processors/Controllers
13.5.1.1.1.1.2.3. Cameras
13.5.1.1.1.1.2.4. Position
Trackers
13.5.1.1.1.1.2.5. Others
13.5.1.1.1.2. Integrated
13.5.1.1.1.2.1. Head-mounted
Displays
13.5.1.1.1.2.2. Head-up
Displays
13.5.1.1.1.2.3. Gesture-tracking
Devices
13.5.1.1.1.2.4. Projectors
& Display Walls
13.5.1.1.2.
Software
13.5.1.1.2.1. 3D Modelling
Software
13.5.1.1.2.2. Visualization
Software
13.5.1.1.2.3. Remote
Collaboration Software
13.5.1.1.2.4. Documentation
Software
13.5.1.1.2.5. Workflow
Optimization Software
13.5.1.1.2.6. Navigation
Software
13.5.1.1.2.7. Others
13.5.1.1.3.
Services
13.5.1.1.3.1. Professional
Services
13.5.1.1.3.2. Managed Services
13.5.1.2.
China Augmented Reality and
Virtual Reality Market Revenue (US$ Mn) and Forecasts, By AR/VR Technology
13.5.1.2.1.
Monitor-based Technology
13.5.1.2.2.
Near-eye-based Technology
13.5.1.2.3.
Mobile Augmented Reality
13.5.1.2.4.
Non-immersive Technology
13.5.1.2.5.
Semi-immersive Technology
13.5.1.2.6.
Fully Immersive Technology
13.5.1.3.
China Augmented Reality and
Virtual Reality Market Revenue (US$ Mn) and Forecasts, By End User
13.5.1.3.1.
Individual
13.5.1.3.2.
Businesses
13.5.1.3.2.1. Aerospace &
Defense
13.5.1.3.2.2. Education
13.5.1.3.2.3. Gaming &
Entertainment
13.5.1.3.2.4. Healthcare
13.5.1.3.2.5. Travel &
Tourism
13.5.1.3.2.6. Transportation
& Logistics
13.5.1.3.2.7. Others
13.5.2. Japan
13.5.2.1.
Japan Augmented Reality and
Virtual Reality Market Revenue (US$ Mn) and Forecasts, By Offerings
13.5.2.1.1.
Hardware
13.5.2.1.1.1. Standalone
13.5.2.1.1.1.1. Sensors
13.5.2.1.1.1.1.1. Accelerometers
13.5.2.1.1.1.1.2. Gyroscopes
13.5.2.1.1.1.1.3. Magnetometers
13.5.2.1.1.1.1.4. Proximity Sensors
13.5.2.1.1.1.1.5. Others
13.5.2.1.1.1.2. Semiconductor Components
13.5.2.1.1.1.2.1. Integrated Circuits
13.5.2.1.1.1.2.2. Processors/Controllers
13.5.2.1.1.1.2.3. Cameras
13.5.2.1.1.1.2.4. Position
Trackers
13.5.2.1.1.1.2.5. Others
13.5.2.1.1.2. Integrated
13.5.2.1.1.2.1. Head-mounted
Displays
13.5.2.1.1.2.2. Head-up
Displays
13.5.2.1.1.2.3. Gesture-tracking
Devices
13.5.2.1.1.2.4. Projectors
& Display Walls
13.5.2.1.2.
Software
13.5.2.1.2.1. 3D Modelling
Software
13.5.2.1.2.2. Visualization
Software
13.5.2.1.2.3. Remote
Collaboration Software
13.5.2.1.2.4. Documentation
Software
13.5.2.1.2.5. Workflow
Optimization Software
13.5.2.1.2.6. Navigation
Software
13.5.2.1.2.7. Others
13.5.2.1.3.
Services
13.5.2.1.3.1. Professional
Services
13.5.2.1.3.2. Managed Services
13.5.2.2.
Japan Augmented Reality and
Virtual Reality Market Revenue (US$ Mn) and Forecasts, By AR/VR Technology
13.5.2.2.1.
Monitor-based Technology
13.5.2.2.2.
Near-eye-based Technology
13.5.2.2.3.
Mobile Augmented Reality
13.5.2.2.4.
Non-immersive Technology
13.5.2.2.5.
Semi-immersive Technology
13.5.2.2.6.
Fully Immersive Technology
13.5.2.3.
Japan Augmented Reality and
Virtual Reality Market Revenue (US$ Mn) and Forecasts, By End User
13.5.2.3.1.
Individual
13.5.2.3.2.
Businesses
13.5.2.3.2.1. Aerospace &
Defense
13.5.2.3.2.2. Education
13.5.2.3.2.3. Gaming &
Entertainment
13.5.2.3.2.4. Healthcare
13.5.2.3.2.5. Travel &
Tourism
13.5.2.3.2.6. Transportation
& Logistics
13.5.2.3.2.7. Others
13.5.3. India
13.5.3.1.
India Augmented Reality and
Virtual Reality Market Revenue (US$ Mn) and Forecasts, By Offerings
13.5.3.1.1.
Hardware
13.5.3.1.1.1. Standalone
13.5.3.1.1.1.1. Sensors
13.5.3.1.1.1.1.1. Accelerometers
13.5.3.1.1.1.1.2. Gyroscopes
13.5.3.1.1.1.1.3. Magnetometers
13.5.3.1.1.1.1.4. Proximity Sensors
13.5.3.1.1.1.1.5. Others
13.5.3.1.1.1.2. Semiconductor Components
13.5.3.1.1.1.2.1. Integrated Circuits
13.5.3.1.1.1.2.2. Processors/Controllers
13.5.3.1.1.1.2.3. Cameras
13.5.3.1.1.1.2.4. Position
Trackers
13.5.3.1.1.1.2.5. Others
13.5.3.1.1.2. Integrated
13.5.3.1.1.2.1. Head-mounted
Displays
13.5.3.1.1.2.2. Head-up
Displays
13.5.3.1.1.2.3. Gesture-tracking
Devices
13.5.3.1.1.2.4. Projectors
& Display Walls
13.5.3.1.2.
Software
13.5.3.1.2.1. 3D Modelling
Software
13.5.3.1.2.2. Visualization
Software
13.5.3.1.2.3. Remote
Collaboration Software
13.5.3.1.2.4. Documentation
Software
13.5.3.1.2.5. Workflow
Optimization Software
13.5.3.1.2.6. Navigation
Software
13.5.3.1.2.7. Others
13.5.3.1.3.
Services
13.5.3.1.3.1. Professional Services
13.5.3.1.3.2. Managed Services
13.5.3.2.
India Augmented Reality and
Virtual Reality Market Revenue (US$ Mn) and Forecasts, By AR/VR Technology
13.5.3.2.1.
Monitor-based Technology
13.5.3.2.2.
Near-eye-based Technology
13.5.3.2.3.
Mobile Augmented Reality
13.5.3.2.4.
Non-immersive Technology
13.5.3.2.5.
Semi-immersive Technology
13.5.3.2.6.
Fully Immersive Technology
13.5.3.3.
India Augmented Reality and
Virtual Reality Market Revenue (US$ Mn) and Forecasts, By End User
13.5.3.3.1.
Individual
13.5.3.3.2.
Businesses
13.5.3.3.2.1. Aerospace &
Defense
13.5.3.3.2.2. Education
13.5.3.3.2.3. Gaming &
Entertainment
13.5.3.3.2.4. Healthcare
13.5.3.3.2.5. Travel &
Tourism
13.5.3.3.2.6. Transportation
& Logistics
13.5.3.3.2.7. Others
13.5.4. New Zealand
13.5.4.1.
New Zealand Augmented Reality
and Virtual Reality Market Revenue (US$ Mn) and Forecasts, By Offerings
13.5.4.1.1.
Hardware
13.5.4.1.1.1. Standalone
13.5.4.1.1.1.1. Sensors
13.5.4.1.1.1.1.1. Accelerometers
13.5.4.1.1.1.1.2. Gyroscopes
13.5.4.1.1.1.1.3. Magnetometers
13.5.4.1.1.1.1.4. Proximity Sensors
13.5.4.1.1.1.1.5. Others
13.5.4.1.1.1.2. Semiconductor Components
13.5.4.1.1.1.2.1. Integrated Circuits
13.5.4.1.1.1.2.2. Processors/Controllers
13.5.4.1.1.1.2.3. Cameras
13.5.4.1.1.1.2.4. Position
Trackers
13.5.4.1.1.1.2.5. Others
13.5.4.1.1.2. Integrated
13.5.4.1.1.2.1. Head-mounted
Displays
13.5.4.1.1.2.2. Head-up
Displays
13.5.4.1.1.2.3. Gesture-tracking
Devices
13.5.4.1.1.2.4. Projectors
& Display Walls
13.5.4.1.2.
Software
13.5.4.1.2.1. 3D Modelling
Software
13.5.4.1.2.2. Visualization
Software
13.5.4.1.2.3. Remote
Collaboration Software
13.5.4.1.2.4. Documentation
Software
13.5.4.1.2.5. Workflow
Optimization Software
13.5.4.1.2.6. Navigation
Software
13.5.4.1.2.7. Others
13.5.4.1.3.
Services
13.5.4.1.3.1. Professional
Services
13.5.4.1.3.2. Managed Services
13.5.4.2.
New Zealand Augmented Reality
and Virtual Reality Market Revenue (US$ Mn) and Forecasts, By AR/VR Technology
13.5.4.2.1.
Monitor-based Technology
13.5.4.2.2.
Near-eye-based Technology
13.5.4.2.3.
Mobile Augmented Reality
13.5.4.2.4.
Non-immersive Technology
13.5.4.2.5.
Semi-immersive Technology
13.5.4.2.6.
Fully Immersive Technology
13.5.4.3.
New Zealand Augmented Reality
and Virtual Reality Market Revenue (US$ Mn) and Forecasts, By End User
13.5.4.3.1.
Individual
13.5.4.3.2.
Businesses
13.5.4.3.2.1. Aerospace &
Defense
13.5.4.3.2.2. Education
13.5.4.3.2.3. Gaming &
Entertainment
13.5.4.3.2.4. Healthcare
13.5.4.3.2.5. Travel &
Tourism
13.5.4.3.2.6. Transportation
& Logistics
13.5.4.3.2.7. Others
13.5.5. Australia
13.5.5.1.
Australia Augmented Reality and
Virtual Reality Market Revenue (US$ Mn) and Forecasts, By Offerings
13.5.5.1.1.
Hardware
13.5.5.1.1.1. Standalone
13.5.5.1.1.1.1. Sensors
13.5.5.1.1.1.1.1. Accelerometers
13.5.5.1.1.1.1.2. Gyroscopes
13.5.5.1.1.1.1.3. Magnetometers
13.5.5.1.1.1.1.4. Proximity Sensors
13.5.5.1.1.1.1.5. Others
13.5.5.1.1.1.2. Semiconductor Components
13.5.5.1.1.1.2.1. Integrated Circuits
13.5.5.1.1.1.2.2. Processors/Controllers
13.5.5.1.1.1.2.3. Cameras
13.5.5.1.1.1.2.4. Position
Trackers
13.5.5.1.1.1.2.5. Others
13.5.5.1.1.2. Integrated
13.5.5.1.1.2.1. Head-mounted
Displays
13.5.5.1.1.2.2. Head-up
Displays
13.5.5.1.1.2.3. Gesture-tracking
Devices
13.5.5.1.1.2.4. Projectors
& Display Walls
13.5.5.1.2.
Software
13.5.5.1.2.1. 3D Modelling
Software
13.5.5.1.2.2. Visualization
Software
13.5.5.1.2.3. Remote
Collaboration Software
13.5.5.1.2.4. Documentation
Software
13.5.5.1.2.5. Workflow
Optimization Software
13.5.5.1.2.6. Navigation
Software
13.5.5.1.2.7. Others
13.5.5.1.3.
Services
13.5.5.1.3.1. Professional
Services
13.5.5.1.3.2. Managed Services
13.5.5.2.
Australia Augmented Reality and
Virtual Reality Market Revenue (US$ Mn) and Forecasts, By AR/VR Technology
13.5.5.2.1.
Monitor-based Technology
13.5.5.2.2.
Near-eye-based Technology
13.5.5.2.3.
Mobile Augmented Reality
13.5.5.2.4.
Non-immersive Technology
13.5.5.2.5.
Semi-immersive Technology
13.5.5.2.6.
Fully Immersive Technology
13.5.5.3.
Australia Augmented Reality and
Virtual Reality Market Revenue (US$ Mn) and Forecasts, By End User
13.5.5.3.1.
Individual
13.5.5.3.2.
Businesses
13.5.5.3.2.1. Aerospace &
Defense
13.5.5.3.2.2. Education
13.5.5.3.2.3. Gaming &
Entertainment
13.5.5.3.2.4. Healthcare
13.5.5.3.2.5. Travel &
Tourism
13.5.5.3.2.6. Transportation
& Logistics
13.5.5.3.2.7. Others
13.5.6. South Korea
13.5.6.1.
South Korea Augmented Reality and
Virtual Reality Market Revenue (US$ Mn) and Forecasts, By Offerings
13.5.6.1.1.
Hardware
13.5.6.1.1.1. Standalone
13.5.6.1.1.1.1. Sensors
13.5.6.1.1.1.1.1. Accelerometers
13.5.6.1.1.1.1.2. Gyroscopes
13.5.6.1.1.1.1.3. Magnetometers
13.5.6.1.1.1.1.4. Proximity Sensors
13.5.6.1.1.1.1.5. Others
13.5.6.1.1.1.2. Semiconductor Components
13.5.6.1.1.1.2.1. Integrated Circuits
13.5.6.1.1.1.2.2. Processors/Controllers
13.5.6.1.1.1.2.3. Cameras
13.5.6.1.1.1.2.4. Position Trackers
13.5.6.1.1.1.2.5. Others
13.5.6.1.1.2. Integrated
13.5.6.1.1.2.1. Head-mounted
Displays
13.5.6.1.1.2.2. Head-up
Displays
13.5.6.1.1.2.3. Gesture-tracking
Devices
13.5.6.1.1.2.4. Projectors
& Display Walls
13.5.6.1.2.
Software
13.5.6.1.2.1. 3D Modelling
Software
13.5.6.1.2.2. Visualization
Software
13.5.6.1.2.3. Remote
Collaboration Software
13.5.6.1.2.4. Documentation
Software
13.5.6.1.2.5. Workflow
Optimization Software
13.5.6.1.2.6. Navigation
Software
13.5.6.1.2.7. Others
13.5.6.1.3.
Services
13.5.6.1.3.1. Professional
Services
13.5.6.1.3.2. Managed Services
13.5.6.2.
South Korea Augmented Reality
and Virtual Reality Market Revenue (US$ Mn) and Forecasts, By AR/VR Technology
13.5.6.2.1.
Monitor-based Technology
13.5.6.2.2.
Near-eye-based Technology
13.5.6.2.3.
Mobile Augmented Reality
13.5.6.2.4.
Non-immersive Technology
13.5.6.2.5.
Semi-immersive Technology
13.5.6.2.6.
Fully Immersive Technology
13.5.6.3.
South Korea Augmented Reality
and Virtual Reality Market Revenue (US$ Mn) and Forecasts, By End User
13.5.6.3.1.
Individual
13.5.6.3.2.
Businesses
13.5.6.3.2.1. Aerospace &
Defense
13.5.6.3.2.2. Education
13.5.6.3.2.3. Gaming & Entertainment
13.5.6.3.2.4. Healthcare
13.5.6.3.2.5. Travel &
Tourism
13.5.6.3.2.6. Transportation
& Logistics
13.5.6.3.2.7. Others
13.5.7. Southeast Asia
13.5.7.1.
Southeast Asia Augmented Reality
and Virtual Reality Market Revenue (US$ Mn) and Forecasts, By Offerings
13.5.7.1.1.
Hardware
13.5.7.1.1.1. Standalone
13.5.7.1.1.1.1. Sensors
13.5.7.1.1.1.1.1. Accelerometers
13.5.7.1.1.1.1.2. Gyroscopes
13.5.7.1.1.1.1.3. Magnetometers
13.5.7.1.1.1.1.4. Proximity Sensors
13.5.7.1.1.1.1.5. Others
13.5.7.1.1.1.2. Semiconductor Components
13.5.7.1.1.1.2.1. Integrated Circuits
13.5.7.1.1.1.2.2. Processors/Controllers
13.5.7.1.1.1.2.3. Cameras
13.5.7.1.1.1.2.4. Position
Trackers
13.5.7.1.1.1.2.5. Others
13.5.7.1.1.2. Integrated
13.5.7.1.1.2.1. Head-mounted
Displays
13.5.7.1.1.2.2. Head-up
Displays
13.5.7.1.1.2.3. Gesture-tracking
Devices
13.5.7.1.1.2.4. Projectors
& Display Walls
13.5.7.1.2.
Software
13.5.7.1.2.1. 3D Modelling
Software
13.5.7.1.2.2. Visualization
Software
13.5.7.1.2.3. Remote
Collaboration Software
13.5.7.1.2.4. Documentation
Software
13.5.7.1.2.5. Workflow
Optimization Software
13.5.7.1.2.6. Navigation
Software
13.5.7.1.2.7. Others
13.5.7.1.3.
Services
13.5.7.1.3.1. Professional
Services
13.5.7.1.3.2. Managed Services
13.5.7.2.
Southeast Asia Augmented Reality
and Virtual Reality Market Revenue (US$ Mn) and Forecasts, By AR/VR Technology
13.5.7.2.1.
Monitor-based Technology
13.5.7.2.2.
Near-eye-based Technology
13.5.7.2.3.
Mobile Augmented Reality
13.5.7.2.4.
Non-immersive Technology
13.5.7.2.5.
Semi-immersive Technology
13.5.7.2.6.
Fully Immersive Technology
13.5.7.3.
Southeast Asia Augmented Reality
and Virtual Reality Market Revenue (US$ Mn) and Forecasts, By End User
13.5.7.3.1.
Individual
13.5.7.3.2.
Businesses
13.5.7.3.2.1. Aerospace &
Defense
13.5.7.3.2.2. Education
13.5.7.3.2.3. Gaming &
Entertainment
13.5.7.3.2.4. Healthcare
13.5.7.3.2.5. Travel &
Tourism
13.5.7.3.2.6. Transportation
& Logistics
13.5.7.3.2.7. Others
13.5.7.4.
Southeast Asia Augmented Reality
and Virtual Reality Market Revenue (US$ Mn) and Forecasts, By Country
13.5.7.4.1.
Indonesia
13.5.7.4.2.
Thailand
13.5.7.4.3.
Malaysia
13.5.7.4.4.
Singapore
13.5.7.4.5.
Rest of Southeast Asia
13.5.8. Rest of Asia Pacific
13.5.8.1.
Rest of Asia Pacific Augmented
Reality and Virtual Reality Market Revenue (US$ Mn) and Forecasts, By Offerings
13.5.8.1.1.
Hardware
13.5.8.1.1.1. Standalone
13.5.8.1.1.1.1. Sensors
13.5.8.1.1.1.1.1. Accelerometers
13.5.8.1.1.1.1.2. Gyroscopes
13.5.8.1.1.1.1.3. Magnetometers
13.5.8.1.1.1.1.4. Proximity Sensors
13.5.8.1.1.1.1.5. Others
13.5.8.1.1.1.2. Semiconductor Components
13.5.8.1.1.1.2.1. Integrated Circuits
13.5.8.1.1.1.2.2. Processors/Controllers
13.5.8.1.1.1.2.3. Cameras
13.5.8.1.1.1.2.4. Position
Trackers
13.5.8.1.1.1.2.5. Others
13.5.8.1.1.2. Integrated
13.5.8.1.1.2.1. Head-mounted
Displays
13.5.8.1.1.2.2. Head-up
Displays
13.5.8.1.1.2.3. Gesture-tracking
Devices
13.5.8.1.1.2.4. Projectors
& Display Walls
13.5.8.1.2.
Software
13.5.8.1.2.1. 3D Modelling
Software
13.5.8.1.2.2. Visualization
Software
13.5.8.1.2.3. Remote
Collaboration Software
13.5.8.1.2.4. Documentation
Software
13.5.8.1.2.5. Workflow
Optimization Software
13.5.8.1.2.6. Navigation
Software
13.5.8.1.2.7. Others
13.5.8.1.3.
Services
13.5.8.1.3.1. Professional
Services
13.5.8.1.3.2. Managed Services
13.5.8.2.
Rest of Asia Pacific Augmented
Reality and Virtual Reality Market Revenue (US$ Mn) and Forecasts, By AR/VR
Technology
13.5.8.2.1.
Monitor-based Technology
13.5.8.2.2.
Near-eye-based Technology
13.5.8.2.3.
Mobile Augmented Reality
13.5.8.2.4.
Non-immersive Technology
13.5.8.2.5.
Semi-immersive Technology
13.5.8.2.6.
Fully Immersive Technology
13.5.8.3.
Rest of Asia Pacific Augmented
Reality and Virtual Reality Market Revenue (US$ Mn) and Forecasts, By End User
13.5.8.3.1.
Individual
13.5.8.3.2.
Businesses
13.5.8.3.2.1. Aerospace &
Defense
13.5.8.3.2.2. Education
13.5.8.3.2.3. Gaming &
Entertainment
13.5.8.3.2.4. Healthcare
13.5.8.3.2.5. Travel &
Tourism
13.5.8.3.2.6. Transportation
& Logistics
13.5.8.3.2.7. Others
13.6. Key Segment for
Channeling Investments
13.6.1. By Country
13.6.2. By Offerings
13.6.3. By AR/VR Technology
13.6.4. By End User
14. Middle East and Africa Augmented Reality and Virtual Reality
Market Analysis and Forecasts, 2019 - 2027
14.1. Overview
14.1.1. Middle East and Africa
Augmented Reality and Virtual Reality Market Revenue (US$ Mn)
14.2. Middle East and Africa
Augmented Reality and Virtual Reality Market Revenue (US$ Mn) and Forecasts, By
Offerings
14.2.1. Hardware
14.2.1.1.
Standalone
14.2.1.1.1. Sensors
14.2.1.1.1.1. Accelerometers
14.2.1.1.1.2. Gyroscopes
14.2.1.1.1.3. Magnetometers
14.2.1.1.1.4. Proximity Sensors
14.2.1.1.1.5. Others
14.2.1.1.2. Semiconductor Components
14.2.1.1.2.1. Integrated Circuits
14.2.1.1.2.2. Processors/Controllers
14.2.1.1.2.3. Cameras
14.2.1.1.2.4. Position Trackers
14.2.1.1.2.5. Others
14.2.1.2.
Integrated
14.2.1.2.1.
Head-mounted Displays
14.2.1.2.2.
Head-up Displays
14.2.1.2.3.
Gesture-tracking Devices
14.2.1.2.4.
Projectors & Display Walls
14.2.2. Software
14.2.2.1.
3D Modelling Software
14.2.2.2.
Visualization Software
14.2.2.3.
Remote Collaboration Software
14.2.2.4.
Documentation Software
14.2.2.5.
Workflow Optimization Software
14.2.2.6.
Navigation Software
14.2.2.7.
Others
14.2.3. Services
14.2.3.1.
Professional Services
14.2.3.2.
Managed Services
14.3. Middle East and Africa
Augmented Reality and Virtual Reality Market Revenue (US$ Mn) and Forecasts, By
AR/VR Technology
14.3.1. Monitor-based
Technology
14.3.2. Near-eye-based
Technology
14.3.3. Mobile Augmented
Reality
14.3.4. Non-immersive
Technology
14.3.5. Semi-immersive
Technology
14.3.6. Fully Immersive
Technology
14.4. Middle East and Africa
Augmented Reality and Virtual Reality Market Revenue (US$ Mn) and Forecasts, By
End User
14.4.1. Individual
14.4.2. Businesses
14.4.2.1.
Aerospace & Defense
14.4.2.2.
Education
14.4.2.3.
Gaming & Entertainment
14.4.2.4.
Healthcare
14.4.2.5.
Travel & Tourism
14.4.2.6.
Transportation & Logistics
14.4.2.7.
Others
14.5. Middle East and Africa
Augmented Reality and Virtual Reality Market Revenue (US$ Mn) and Forecasts, By
Country
14.5.1. Saudi Arabia
14.5.1.1.
Saudi Arabia Augmented Reality
and Virtual Reality Market Revenue (US$ Mn) and Forecasts, By Offerings
14.5.1.1.1.
Hardware
14.5.1.1.1.1. Standalone
14.5.1.1.1.1.1. Sensors
14.5.1.1.1.1.1.1. Accelerometers
14.5.1.1.1.1.1.2. Gyroscopes
14.5.1.1.1.1.1.3. Magnetometers
14.5.1.1.1.1.1.4. Proximity Sensors
14.5.1.1.1.1.1.5. Others
14.5.1.1.1.1.2. Semiconductor Components
14.5.1.1.1.1.2.1. Integrated Circuits
14.5.1.1.1.1.2.2. Processors/Controllers
14.5.1.1.1.1.2.3. Cameras
14.5.1.1.1.1.2.4. Position
Trackers
14.5.1.1.1.1.2.5. Others
14.5.1.1.1.2. Integrated
14.5.1.1.1.2.1. Head-mounted
Displays
14.5.1.1.1.2.2. Head-up
Displays
14.5.1.1.1.2.3. Gesture-tracking
Devices
14.5.1.1.1.2.4. Projectors
& Display Walls
14.5.1.1.2.
Software
14.5.1.1.2.1. 3D Modelling
Software
14.5.1.1.2.2. Visualization
Software
14.5.1.1.2.3. Remote
Collaboration Software
14.5.1.1.2.4. Documentation
Software
14.5.1.1.2.5. Workflow
Optimization Software
14.5.1.1.2.6. Navigation
Software
14.5.1.1.2.7. Others
14.5.1.1.3.
Services
14.5.1.1.3.1. Professional
Services
14.5.1.1.3.2. Managed Services
14.5.1.2.
Saudi Arabia Augmented Reality
and Virtual Reality Market Revenue (US$ Mn) and Forecasts, By AR/VR Technology
14.5.1.2.1.
Monitor-based Technology
14.5.1.2.2.
Near-eye-based Technology
14.5.1.2.3.
Mobile Augmented Reality
14.5.1.2.4.
Non-immersive Technology
14.5.1.2.5.
Semi-immersive Technology
14.5.1.2.6.
Fully Immersive Technology
14.5.1.3.
Saudi Arabia Augmented Reality
and Virtual Reality Market Revenue (US$ Mn) and Forecasts, By End User
14.5.1.3.1.
Individual
14.5.1.3.2.
Businesses
14.5.1.3.2.1. Aerospace &
Defense
14.5.1.3.2.2. Education
14.5.1.3.2.3. Gaming &
Entertainment
14.5.1.3.2.4. Healthcare
14.5.1.3.2.5. Travel &
Tourism
14.5.1.3.2.6. Transportation
& Logistics
14.5.1.3.2.7. Others
14.5.2. UAE
14.5.2.1.
UAE Augmented Reality and
Virtual Reality Market Revenue (US$ Mn) and Forecasts, By Offerings
14.5.2.1.1.
Hardware
14.5.2.1.1.1. Standalone
14.5.2.1.1.1.1. Sensors
14.5.2.1.1.1.1.1. Accelerometers
14.5.2.1.1.1.1.2. Gyroscopes
14.5.2.1.1.1.1.3. Magnetometers
14.5.2.1.1.1.1.4. Proximity Sensors
14.5.2.1.1.1.1.5. Others
14.5.2.1.1.1.2. Semiconductor Components
14.5.2.1.1.1.2.1. Integrated Circuits
14.5.2.1.1.1.2.2. Processors/Controllers
14.5.2.1.1.1.2.3. Cameras
14.5.2.1.1.1.2.4. Position
Trackers
14.5.2.1.1.1.2.5. Others
14.5.2.1.1.2. Integrated
14.5.2.1.1.2.1. Head-mounted
Displays
14.5.2.1.1.2.2. Head-up
Displays
14.5.2.1.1.2.3. Gesture-tracking
Devices
14.5.2.1.1.2.4. Projectors
& Display Walls
14.5.2.1.2.
Software
14.5.2.1.2.1. 3D Modelling
Software
14.5.2.1.2.2. Visualization
Software
14.5.2.1.2.3. Remote
Collaboration Software
14.5.2.1.2.4. Documentation
Software
14.5.2.1.2.5. Workflow
Optimization Software
14.5.2.1.2.6. Navigation
Software
14.5.2.1.2.7. Others
14.5.2.1.3.
Services
14.5.2.1.3.1. Professional
Services
14.5.2.1.3.2. Managed Services
14.5.2.2.
UAE Augmented Reality and Virtual
Reality Market Revenue (US$ Mn) and Forecasts, By AR/VR Technology
14.5.2.2.1.
Monitor-based Technology
14.5.2.2.2.
Near-eye-based Technology
14.5.2.2.3.
Mobile Augmented Reality
14.5.2.2.4.
Non-immersive Technology
14.5.2.2.5.
Semi-immersive Technology
14.5.2.2.6.
Fully Immersive Technology
14.5.2.3.
UAE Augmented Reality and Virtual
Reality Market Revenue (US$ Mn) and Forecasts, By End User
14.5.2.3.1.
Individual
14.5.2.3.2.
Businesses
14.5.2.3.2.1. Aerospace &
Defense
14.5.2.3.2.2. Education
14.5.2.3.2.3. Gaming &
Entertainment
14.5.2.3.2.4. Healthcare
14.5.2.3.2.5. Travel &
Tourism
14.5.2.3.2.6. Transportation
& Logistics
14.5.2.3.2.7. Others
14.5.3. Egypt
14.5.3.1.
Egypt Augmented Reality and
Virtual Reality Market Revenue (US$ Mn) and Forecasts, By Offerings
14.5.3.1.1.
Hardware
14.5.3.1.1.1. Standalone
14.5.3.1.1.1.1. Sensors
14.5.3.1.1.1.1.1. Accelerometers
14.5.3.1.1.1.1.2. Gyroscopes
14.5.3.1.1.1.1.3. Magnetometers
14.5.3.1.1.1.1.4. Proximity Sensors
14.5.3.1.1.1.1.5. Others
14.5.3.1.1.1.2. Semiconductor Components
14.5.3.1.1.1.2.1. Integrated Circuits
14.5.3.1.1.1.2.2. Processors/Controllers
14.5.3.1.1.1.2.3. Cameras
14.5.3.1.1.1.2.4. Position
Trackers
14.5.3.1.1.1.2.5. Others
14.5.3.1.1.1.3. Others
14.5.3.1.1.2. Integrated
14.5.3.1.1.2.1. Head-mounted
Displays
14.5.3.1.1.2.2. Head-up
Displays
14.5.3.1.1.2.3. Gesture-tracking
Devices
14.5.3.1.1.2.4. Projectors
& Display Walls
14.5.3.1.2.
Software
14.5.3.1.2.1. 3D Modelling
Software
14.5.3.1.2.2. Visualization
Software
14.5.3.1.2.3. Remote
Collaboration Software
14.5.3.1.2.4. Documentation
Software
14.5.3.1.2.5. Workflow
Optimization Software
14.5.3.1.2.6. Navigation Software
14.5.3.1.2.7. Others
14.5.3.1.3.
Services
14.5.3.1.3.1. Professional
Services
14.5.3.1.3.2. Managed Services
14.5.3.2.
Egypt Augmented Reality and
Virtual Reality Market Revenue (US$ Mn) and Forecasts, By AR/VR Technology
14.5.3.2.1.
Monitor-based Technology
14.5.3.2.2.
Near-eye-based Technology
14.5.3.2.3.
Mobile Augmented Reality
14.5.3.2.4.
Non-immersive Technology
14.5.3.2.5.
Semi-immersive Technology
14.5.3.2.6.
Fully Immersive Technology
14.5.3.3.
Egypt Augmented Reality and
Virtual Reality Market Revenue (US$ Mn) and Forecasts, By End User
14.5.3.3.1.
Individual
14.5.3.3.2.
Businesses
14.5.3.3.2.1. Aerospace &
Defense
14.5.3.3.2.2. Education
14.5.3.3.2.3. Gaming &
Entertainment
14.5.3.3.2.4. Healthcare
14.5.3.3.2.5. Travel & Tourism
14.5.3.3.2.6. Transportation
& Logistics
14.5.3.3.2.7. Others
14.5.4. Kuwait
14.5.4.1.
Kuwait Augmented Reality and
Virtual Reality Market Revenue (US$ Mn) and Forecasts, By Offerings
14.5.4.1.1.
Hardware
14.5.4.1.1.1. Standalone
14.5.4.1.1.1.1. Sensors
14.5.4.1.1.1.1.1. Accelerometers
14.5.4.1.1.1.1.2. Gyroscopes
14.5.4.1.1.1.1.3. Magnetometers
14.5.4.1.1.1.1.4. Proximity Sensors
14.5.4.1.1.1.1.5. Others
14.5.4.1.1.1.2. Semiconductor Components
14.5.4.1.1.1.2.1. Integrated Circuits
14.5.4.1.1.1.2.2. Processors/Controllers
14.5.4.1.1.1.2.3. Cameras
14.5.4.1.1.1.2.4. Position
Trackers
14.5.4.1.1.1.2.5. Others
14.5.4.1.1.2. Integrated
14.5.4.1.1.2.1. Head-mounted
Displays
14.5.4.1.1.2.2. Head-up
Displays
14.5.4.1.1.2.3. Gesture-tracking
Devices
14.5.4.1.1.2.4. Projectors
& Display Walls
14.5.4.1.2.
Software
14.5.4.1.2.1. 3D Modelling
Software
14.5.4.1.2.2. Visualization
Software
14.5.4.1.2.3. Remote Collaboration
Software
14.5.4.1.2.4. Documentation
Software
14.5.4.1.2.5. Workflow
Optimization Software
14.5.4.1.2.6. Navigation
Software
14.5.4.1.2.7. Others
14.5.4.1.3.
Services
14.5.4.1.3.1. Professional
Services
14.5.4.1.3.2. Managed Services
14.5.4.2.
Kuwait Augmented Reality and
Virtual Reality Market Revenue (US$ Mn) and Forecasts, By AR/VR Technology
14.5.4.2.1.
Monitor-based Technology
14.5.4.2.2.
Near-eye-based Technology
14.5.4.2.3.
Mobile Augmented Reality
14.5.4.2.4.
Non-immersive Technology
14.5.4.2.5.
Semi-immersive Technology
14.5.4.2.6.
Fully Immersive Technology
14.5.4.3.
Kuwait Augmented Reality and
Virtual Reality Market Revenue (US$ Mn) and Forecasts, By End User
14.5.4.3.1.
Individual
14.5.4.3.2.
Businesses
14.5.4.3.2.1. Aerospace &
Defense
14.5.4.3.2.2. Education
14.5.4.3.2.3. Gaming &
Entertainment
14.5.4.3.2.4. Healthcare
14.5.4.3.2.5. Travel &
Tourism
14.5.4.3.2.6. Transportation
& Logistics
14.5.4.3.2.7. Others
14.5.5. South Africa
14.5.5.1.
South Africa Augmented Reality
and Virtual Reality Market Revenue (US$ Mn) and Forecasts, By Offerings
14.5.5.1.1.
Hardware
14.5.5.1.1.1. Standalone
14.5.5.1.1.1.1. Sensors
14.5.5.1.1.1.1.1. Accelerometers
14.5.5.1.1.1.1.2. Gyroscopes
14.5.5.1.1.1.1.3. Magnetometers
14.5.5.1.1.1.1.4. Proximity Sensors
14.5.5.1.1.1.1.5. Others
14.5.5.1.1.1.2. Semiconductor Components
14.5.5.1.1.1.2.1. Integrated Circuits
14.5.5.1.1.1.2.2. Processors/Controllers
14.5.5.1.1.1.2.3. Cameras
14.5.5.1.1.1.2.4. Position
Trackers
14.5.5.1.1.1.2.5. Others
14.5.5.1.1.2. Integrated
14.5.5.1.1.2.1. Head-mounted
Displays
14.5.5.1.1.2.2. Head-up
Displays
14.5.5.1.1.2.3. Gesture-tracking
Devices
14.5.5.1.1.2.4. Projectors
& Display Walls
14.5.5.1.2.
Software
14.5.5.1.2.1. 3D Modelling
Software
14.5.5.1.2.2. Visualization
Software
14.5.5.1.2.3. Remote
Collaboration Software
14.5.5.1.2.4. Documentation
Software
14.5.5.1.2.5. Workflow
Optimization Software
14.5.5.1.2.6. Navigation
Software
14.5.5.1.2.7. Others
14.5.5.1.3.
Services
14.5.5.1.3.1. Professional
Services
14.5.5.1.3.2. Managed Services
14.5.5.2.
South Africa Augmented Reality
and Virtual Reality Market Revenue (US$ Mn) and Forecasts, By AR/VR Technology
14.5.5.2.1.
Monitor-based Technology
14.5.5.2.2.
Near-eye-based Technology
14.5.5.2.3.
Mobile Augmented Reality
14.5.5.2.4.
Non-immersive Technology
14.5.5.2.5.
Semi-immersive Technology
14.5.5.2.6.
Fully Immersive Technology
14.5.5.3.
South Africa Augmented Reality
and Virtual Reality Market Revenue (US$ Mn) and Forecasts, By End User
14.5.5.3.1.
Individual
14.5.5.3.2.
Businesses
14.5.5.3.2.1. Aerospace &
Defense
14.5.5.3.2.2. Education
14.5.5.3.2.3. Gaming &
Entertainment
14.5.5.3.2.4. Healthcare
14.5.5.3.2.5. Travel &
Tourism
14.5.5.3.2.6. Transportation
& Logistics
14.5.5.3.2.7. Others
14.5.6. Rest of Middle East
& Africa
14.5.6.1.
Rest of Middle East & Africa
Augmented Reality and Virtual Reality Market Revenue (US$ Mn) and Forecasts, By
Offerings
14.5.6.1.1.
Hardware
14.5.6.1.1.1. Standalone
14.5.6.1.1.1.1. Sensors
14.5.6.1.1.1.1.1. Accelerometers
14.5.6.1.1.1.1.2. Gyroscopes
14.5.6.1.1.1.1.3. Magnetometers
14.5.6.1.1.1.1.4. Proximity Sensors
14.5.6.1.1.1.1.5. Others
14.5.6.1.1.1.2. Semiconductor Components
14.5.6.1.1.1.2.1. Integrated Circuits
14.5.6.1.1.1.2.2. Processors/Controllers
14.5.6.1.1.1.2.3. Cameras
14.5.6.1.1.1.2.4. Position
Trackers
14.5.6.1.1.1.2.5. Others
14.5.6.1.1.2. Integrated
14.5.6.1.1.2.1. Head-mounted
Displays
14.5.6.1.1.2.2. Head-up
Displays
14.5.6.1.1.2.3. Gesture-tracking
Devices
14.5.6.1.1.2.4. Projectors
& Display Walls
14.5.6.1.2.
Software
14.5.6.1.2.1. 3D Modelling
Software
14.5.6.1.2.2. Visualization
Software
14.5.6.1.2.3. Remote Collaboration
Software
14.5.6.1.2.4. Documentation
Software
14.5.6.1.2.5. Workflow
Optimization Software
14.5.6.1.2.6. Navigation
Software
14.5.6.1.2.7. Others
14.5.6.1.3.
Services
14.5.6.1.3.1. Professional
Services
14.5.6.1.3.2. Managed Services
14.5.6.2.
Rest of Middle East & Africa
Augmented Reality and Virtual Reality Market Revenue (US$ Mn) and Forecasts, By
AR/VR Technology
14.5.6.2.1.
Monitor-based Technology
14.5.6.2.2.
Near-eye-based Technology
14.5.6.2.3.
Mobile Augmented Reality
14.5.6.2.4.
Non-immersive Technology
14.5.6.2.5.
Semi-immersive Technology
14.5.6.2.6.
Fully Immersive Technology
14.5.6.3.
Rest of Middle East & Africa
Augmented Reality and Virtual Reality Market Revenue (US$ Mn) and Forecasts, By
End User
14.5.6.3.1.
Individual
14.5.6.3.2.
Businesses
14.5.6.3.2.1. Aerospace &
Defense
14.5.6.3.2.2. Education
14.5.6.3.2.3. Gaming &
Entertainment
14.5.6.3.2.4. Healthcare
14.5.6.3.2.5. Travel &
Tourism
14.5.6.3.2.6. Transportation
& Logistics
14.5.6.3.2.7. Others
14.6. Key Segment for
Channeling Investments
14.6.1. By Country
14.6.2. By Offerings
14.6.3. By AR/VR Technology
14.6.4. By End User
15. Latin America Augmented Reality and Virtual Reality Market
Analysis and Forecasts, 2019 - 2027
15.1. Overview
15.1.1. Latin America Augmented
Reality and Virtual Reality Market Revenue (US$ Mn)
15.2. Latin America Augmented
Reality and Virtual Reality Market Revenue (US$ Mn) and Forecasts, By Offerings
15.2.1. Hardware
15.2.1.1.
Standalone
15.2.1.1.1. Sensors
15.2.1.1.1.1. Accelerometers
15.2.1.1.1.2. Gyroscopes
15.2.1.1.1.3. Magnetometers
15.2.1.1.1.4. Proximity Sensors
15.2.1.1.1.5. Others
15.2.1.1.2. Semiconductor Components
15.2.1.1.2.1. Integrated Circuits
15.2.1.1.2.2. Processors/Controllers
15.2.1.1.2.3. Cameras
15.2.1.1.2.4. Position Trackers
15.2.1.1.2.5. Others
15.2.1.2.
Integrated
15.2.1.2.1.
Head-mounted Displays
15.2.1.2.2.
Head-up Displays
15.2.1.2.3.
Gesture-tracking Devices
15.2.1.2.4.
Projectors & Display Walls
15.2.2. Software
15.2.2.1.
3D Modelling Software
15.2.2.2.
Visualization Software
15.2.2.3.
Remote Collaboration Software
15.2.2.4.
Documentation Software
15.2.2.5.
Workflow Optimization Software
15.2.2.6.
Navigation Software
15.2.2.7.
Others
15.2.3. Services
15.2.3.1.
Professional Services
15.2.3.2.
Managed Services
15.3. Latin America Augmented
Reality and Virtual Reality Market Revenue (US$ Mn) and Forecasts, By AR/VR
Technology
15.3.1. Monitor-based
Technology
15.3.2. Near-eye-based
Technology
15.3.3. Mobile Augmented
Reality
15.3.4. Non-immersive Technology
15.3.5. Semi-immersive
Technology
15.3.6. Fully Immersive
Technology
15.4. Latin America Augmented
Reality and Virtual Reality Market Revenue (US$ Mn) and Forecasts, By End User
15.4.1. Individual
15.4.2. Businesses
15.4.2.1.
Aerospace & Defense
15.4.2.2.
Education
15.4.2.3.
Gaming & Entertainment
15.4.2.4.
Healthcare
15.4.2.5.
Travel & Tourism
15.4.2.6.
Transportation & Logistics
15.4.2.7.
Others
15.5. Latin America Augmented
Reality and Virtual Reality Market Revenue (US$ Mn) and Forecasts, By Country
15.5.1. Brazil
15.5.1.1.
Brazil Augmented Reality and
Virtual Reality Market Revenue (US$ Mn) and Forecasts, By Offerings
15.5.1.1.1.
Hardware
15.5.1.1.1.1. Standalone
15.5.1.1.1.1.1. Sensors
15.5.1.1.1.1.1.1. Accelerometers
15.5.1.1.1.1.1.2. Gyroscopes
15.5.1.1.1.1.1.3. Magnetometers
15.5.1.1.1.1.1.4. Proximity Sensors
15.5.1.1.1.1.1.5. Others
15.5.1.1.1.1.2. Semiconductor Components
15.5.1.1.1.1.2.1. Integrated Circuits
15.5.1.1.1.1.2.2. Processors/Controllers
15.5.1.1.1.1.2.3. Cameras
15.5.1.1.1.1.2.4. Position
Trackers
15.5.1.1.1.1.2.5. Others
15.5.1.1.1.2. Integrated
15.5.1.1.1.2.1. Head-mounted
Displays
15.5.1.1.1.2.2. Head-up
Displays
15.5.1.1.1.2.3. Gesture-tracking
Devices
15.5.1.1.1.2.4. Projectors
& Display Walls
15.5.1.1.2.
Software
15.5.1.1.2.1. 3D Modelling
Software
15.5.1.1.2.2. Visualization
Software
15.5.1.1.2.3. Remote
Collaboration Software
15.5.1.1.2.4. Documentation
Software
15.5.1.1.2.5. Workflow
Optimization Software
15.5.1.1.2.6. Navigation
Software
15.5.1.1.2.7. Others
15.5.1.1.3.
Services
15.5.1.1.3.1. Professional
Services
15.5.1.1.3.2. Managed Services
15.5.1.2.
Brazil Augmented Reality and
Virtual Reality Market Revenue (US$ Mn) and Forecasts, By AR/VR Technology
15.5.1.2.1.
Monitor-based Technology
15.5.1.2.2.
Near-eye-based Technology
15.5.1.2.3.
Mobile Augmented Reality
15.5.1.2.4.
Non-immersive Technology
15.5.1.2.5.
Semi-immersive Technology
15.5.1.2.6.
Fully Immersive Technology
15.5.1.3.
Brazil Augmented Reality and
Virtual Reality Market Revenue (US$ Mn) and Forecasts, By End User
15.5.1.3.1.
Individual
15.5.1.3.2.
Businesses
15.5.1.3.2.1. Aerospace &
Defense
15.5.1.3.2.2. Education
15.5.1.3.2.3. Gaming &
Entertainment
15.5.1.3.2.4. Healthcare
15.5.1.3.2.5. Travel &
Tourism
15.5.1.3.2.6. Transportation
& Logistics
15.5.1.3.2.7. Others
15.5.2. Argentina
15.5.2.1.
Argentina Augmented Reality and
Virtual Reality Market Revenue (US$ Mn) and Forecasts, By Offerings
15.5.2.1.1.
Hardware
15.5.2.1.1.1. Standalone
15.5.2.1.1.1.1. Sensors
15.5.2.1.1.1.1.1. Accelerometers
15.5.2.1.1.1.1.2. Gyroscopes
15.5.2.1.1.1.1.3. Magnetometers
15.5.2.1.1.1.1.4. Proximity Sensors
15.5.2.1.1.1.1.5. Others
15.5.2.1.1.1.2. Semiconductor Components
15.5.2.1.1.1.2.1. Integrated Circuits
15.5.2.1.1.1.2.2. Processors/Controllers
15.5.2.1.1.1.2.3. Cameras
15.5.2.1.1.1.2.4. Position
Trackers
15.5.2.1.1.1.2.5. Others
15.5.2.1.1.2. Integrated
15.5.2.1.1.2.1. Head-mounted
Displays
15.5.2.1.1.2.2. Head-up
Displays
15.5.2.1.1.2.3. Gesture-tracking
Devices
15.5.2.1.1.2.4. Projectors
& Display Walls
15.5.2.1.2.
Software
15.5.2.1.2.1. 3D Modelling
Software
15.5.2.1.2.2. Visualization
Software
15.5.2.1.2.3. Remote
Collaboration Software
15.5.2.1.2.4. Documentation
Software
15.5.2.1.2.5. Workflow Optimization
Software
15.5.2.1.2.6. Navigation
Software
15.5.2.1.2.7. Others
15.5.2.1.3.
Services
15.5.2.1.3.1. Professional
Services
15.5.2.1.3.2. Managed Services
15.5.2.2.
Argentina Augmented Reality and
Virtual Reality Market Revenue (US$ Mn) and Forecasts, By AR/VR Technology
15.5.2.2.1.
Monitor-based Technology
15.5.2.2.2.
Near-eye-based Technology
15.5.2.2.3.
Mobile Augmented Reality
15.5.2.2.4.
Non-immersive Technology
15.5.2.2.5.
Semi-immersive Technology
15.5.2.2.6.
Fully Immersive Technology
15.5.2.3.
Argentina Augmented Reality and
Virtual Reality Market Revenue (US$ Mn) and Forecasts, By End User
15.5.2.3.1.
Individual
15.5.2.3.2.
Businesses
15.5.2.3.2.1. Aerospace &
Defense
15.5.2.3.2.2. Education
15.5.2.3.2.3. Gaming &
Entertainment
15.5.2.3.2.4. Healthcare
15.5.2.3.2.5. Travel &
Tourism
15.5.2.3.2.6. Transportation
& Logistics
15.5.2.3.2.7. Others
15.5.3. Rest of Latin America
15.5.3.1.
Rest of Latin America Augmented
Reality and Virtual Reality Market Revenue (US$ Mn) and Forecasts, By Offerings
15.5.3.1.1.
Hardware
15.5.3.1.1.1. Standalone
15.5.3.1.1.1.1. Sensors
15.5.3.1.1.1.1.1. Accelerometers
15.5.3.1.1.1.1.2. Gyroscopes
15.5.3.1.1.1.1.3. Magnetometers
15.5.3.1.1.1.1.4. Proximity Sensors
15.5.3.1.1.1.1.5. Others
15.5.3.1.1.1.2. Semiconductor Components
15.5.3.1.1.1.2.1. Integrated Circuits
15.5.3.1.1.1.2.2. Processors/Controllers
15.5.3.1.1.1.2.3. Cameras
15.5.3.1.1.1.2.4. Position
Trackers
15.5.3.1.1.1.2.5. Others
15.5.3.1.1.2. Integrated
15.5.3.1.1.2.1. Head-mounted
Displays
15.5.3.1.1.2.2. Head-up
Displays
15.5.3.1.1.2.3. Gesture-tracking
Devices
15.5.3.1.1.2.4. Projectors
& Display Walls
15.5.3.1.2.
Software
15.5.3.1.2.1. 3D Modelling
Software
15.5.3.1.2.2. Visualization
Software
15.5.3.1.2.3. Remote
Collaboration Software
15.5.3.1.2.4. Documentation
Software
15.5.3.1.2.5. Workflow
Optimization Software
15.5.3.1.2.6. Navigation
Software
15.5.3.1.2.7. Others
15.5.3.1.3.
Services
15.5.3.1.3.1. Professional
Services
15.5.3.1.3.2. Managed Services
15.5.3.2.
Rest of Latin America Augmented
Reality and Virtual Reality Market Revenue (US$ Mn) and Forecasts, By AR/VR
Technology
15.5.3.2.1.
Monitor-based Technology
15.5.3.2.2.
Near-eye-based Technology
15.5.3.2.3.
Mobile Augmented Reality
15.5.3.2.4.
Non-immersive Technology
15.5.3.2.5.
Semi-immersive Technology
15.5.3.2.6.
Fully Immersive Technology
15.5.3.3.
Rest of Latin America Augmented
Reality and Virtual Reality Market Revenue (US$ Mn) and Forecasts, By End User
15.5.3.3.1.
Individual
15.5.3.3.2.
Businesses
15.5.3.3.2.1. Aerospace &
Defense
15.5.3.3.2.2. Education
15.5.3.3.2.3. Gaming &
Entertainment
15.5.3.3.2.4. Healthcare
15.5.3.3.2.5. Travel &
Tourism
15.5.3.3.2.6. Transportation
& Logistics
15.5.3.3.2.7. Others
15.6. Key Segment for Channeling
Investments
15.6.1. By Country
15.6.2. By Offerings
15.6.3. By AR/VR Technology
15.6.4. By End User
16. Competitive Benchmarking
16.1. Brand Benchmarking
16.2. Market Share Analysis,
2018
16.3. Global Presence and
Growth Strategies
16.3.1. Mergers and
Acquisitions
16.3.2. Product Launches
16.3.3. Investments Trends
16.3.4. R&D Initiatives
17. Player Profiles
17.1. Aero Glass
17.1.1. Company Details
17.1.2. Company Overview
17.1.3. Product Offerings
17.1.4. Key Developments
17.1.5. Financial Analysis
17.1.6. SWOT Analysis
17.1.7. Business Strategies
17.2. Chetu Inc.
17.2.1. Company Details
17.2.2. Company Overview
17.2.3. Product Offerings
17.2.4. Key Developments
17.2.5. Financial Analysis
17.2.6. SWOT Analysis
17.2.7. Business Strategies
17.3. CSE Software Inc.
17.3.1. Company Details
17.3.2. Company Overview
17.3.3. Product Offerings
17.3.4. Key Developments
17.3.5. Financial Analysis
17.3.6. SWOT Analysis
17.3.7. Business Strategies
17.4. EON Reality
17.4.1. Company Details
17.4.2. Company Overview
17.4.3. Product Offerings
17.4.4. Key Developments
17.4.5. Financial Analysis
17.4.6. SWOT Analysis
17.4.7. Business Strategies
17.5. Facebook Technologies,
LLC (Oculus)
17.5.1. Company Details
17.5.2. Company Overview
17.5.3. Product Offerings
17.5.4. Key Developments
17.5.5. Financial Analysis
17.5.6. SWOT Analysis
17.5.7. Business Strategies
17.6. Fpt Software
17.6.1. Company Details
17.6.2. Company Overview
17.6.3. Product Offerings
17.6.4. Key Developments
17.6.5. Financial Analysis
17.6.6. SWOT Analysis
17.6.7. Business Strategies
17.7. Google, LLC
17.7.1. Company Details
17.7.2. Company Overview
17.7.3. Product Offerings
17.7.4. Key Developments
17.7.5. Financial Analysis
17.7.6. SWOT Analysis
17.7.7. Business Strategies
17.8. Jasoren
17.8.1. Company Details
17.8.2. Company Overview
17.8.3. Product Offerings
17.8.4. Key Developments
17.8.5. Financial Analysis
17.8.6. SWOT Analysis
17.8.7. Business Strategies
17.9. KELLTON TECH
17.9.1. Company Details
17.9.2. Company Overview
17.9.3. Product Offerings
17.9.4. Key Developments
17.9.5. Financial Analysis
17.9.6. SWOT Analysis
17.9.7. Business Strategies
17.10. Lenovo
17.10.1. Company Details
17.10.2. Company Overview
17.10.3. Product Offerings
17.10.4. Key Developments
17.10.5. Financial Analysis
17.10.6. SWOT Analysis
17.10.7. Business Strategies
17.11. Microsoft
17.11.1. Company Details
17.11.2. Company Overview
17.11.3. Product Offerings
17.11.4. Key Developments
17.11.5. Financial Analysis
17.11.6. SWOT Analysis
17.11.7. Business Strategies
17.12. Mindtree Limited
17.12.1. Company Details
17.12.2. Company Overview
17.12.3. Product Offerings
17.12.4. Key Developments
17.12.5. Financial Analysis
17.12.6. SWOT Analysis
17.12.7. Business Strategies
17.13. Oxagile
17.13.1. Company Details
17.13.2. Company Overview
17.13.3. Product Offerings
17.13.4. Key Developments
17.13.5. Financial Analysis
17.13.6. SWOT Analysis
17.13.7. Business Strategies
17.14. PTC
17.14.1. Company Details
17.14.2. Company Overview
17.14.3. Product Offerings
17.14.4. Key Developments
17.14.5. Financial Analysis
17.14.6. SWOT Analysis
17.14.7. Business Strategies
17.15. Sigma Software
17.15.1. Company Details
17.15.2. Company Overview
17.15.3. Product Offerings
17.15.4. Key Developments
17.15.5. Financial Analysis
17.15.6. SWOT Analysis
17.15.7. Business Strategies
17.16. Sony Interactive
Entertainment Inc.
17.16.1. Company Details
17.16.2. Company Overview
17.16.3. Product Offerings
17.16.4. Key Developments
17.16.5. Financial Analysis
17.16.6. SWOT Analysis
17.16.7. Business Strategies
17.17. Spin VR Corp.
17.17.1. Company Details
17.17.2. Company Overview
17.17.3. Product Offerings
17.17.4. Key Developments
17.17.5. Financial Analysis
17.17.6. SWOT Analysis
17.17.7. Business Strategies
17.18. TechViz
17.18.1. Company Details
17.18.2. Company Overview
17.18.3. Product Offerings
17.18.4. Key Developments
17.18.5. Financial Analysis
17.18.6. SWOT Analysis
17.18.7. Business Strategies
17.19. Upskill
17.19.1. Company Details
17.19.2. Company Overview
17.19.3. Product Offerings
17.19.4. Key Developments
17.19.5. Financial Analysis
17.19.6. SWOT Analysis
17.19.7. Business Strategies
17.20. Vuzix Corporation
17.20.1. Company Details
17.20.2. Company Overview
17.20.3. Product Offerings
17.20.4. Key Developments
17.20.5. Financial Analysis
17.20.6. SWOT Analysis
17.20.7. Business Strategies
17.21. Wikitude GmbH
17.21.1. Company Details
17.21.2. Company Overview
17.21.3. Product Offerings
17.21.4. Key Developments
17.21.5. Financial Analysis
17.21.6. SWOT Analysis
17.21.7. Business Strategies
17.22. Other Market
Participants
18. Key Findings: Global Augmented and Virtual Reality Market
Note: This ToC is tentative
and can be changed according to the research study conducted during the course
of report completion.
**Exclusive for Multi-User and
Enterprise User.
At Absolute Markets Insights, we are engaged in building both global as well as country specific reports. As a result, the approach taken for deriving the estimation and forecast for a specific country is a bit unique and different in comparison to the global research studies. In this case, we not only study the concerned market factors & trends prevailing in a particular country (from secondary research) but we also tend to calculate the actual market size & forecast from the revenue generated from the market participants involved in manufacturing or distributing the any concerned product. These companies can also be service providers. For analyzing any country specifically, we do consider the growth factors prevailing under the states/cities/county for the same. For instance, if we are analyzing an industry specific to United States, we primarily need to study about the states present under the same(where the product/service has the highest growth). Similar analysis will be followed by other countries. Our scope of the report changes with different markets.
Our research study is mainly implement through a mix of both secondary and primary research. Various sources such as industry magazines, trade journals, and government websites and trade associations are reviewed for gathering precise data. Primary interviews are conducted to validate the market size derived from secondary research. Industry experts, major manufacturers and distributors are contacted for further validation purpose on the current market penetration and growth trends.
Prominent participants in our primary research process include:
- Key Opinion Leaders namely the CEOs, CSOs, VPs, purchasing managers, amongst others
- Research and development participants, distributors/suppliers and subject matter experts
Secondary Research includes data extracted from paid data sources:
- Reuters
- Factiva
- Bloomberg
- One Source
- Hoovers
Research Methodology

Key Inclusions


