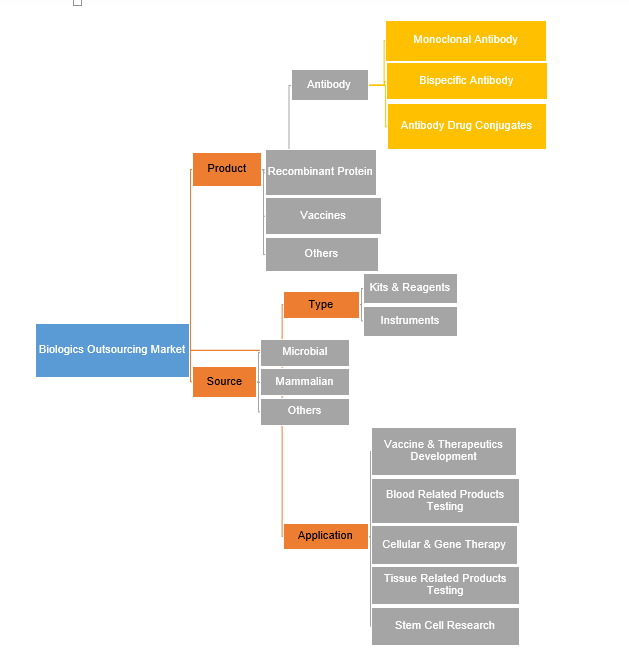
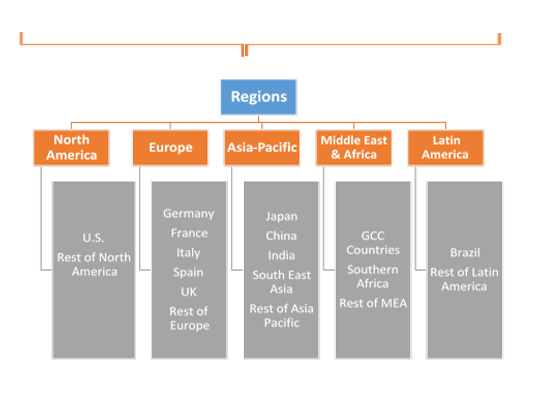
Biologics Outsourcing Market by Product (Antibody {Monoclonal Antibody, Bispecific Antibody, Antibody Drug Conjugates}, Recombinant Protein, Vaccines, Others (Gene Therapy, Cell Therapy)); by Type (Kits & Reagents, Instruments); by Source (Microbial, Mammalian, Others (Transgenic Sources, Avian, Insect)); by Application (Vaccine & Therapeutics Development, Blood & Blood Related Products Testing, Cellular and Gene Therapy, Tissue and Tissue Related Products Testing, Stem Cell Research); by Regional Outlook (U.S., Rest of North America, France, UK, Germany, Spain, Italy, Rest of Europe, China, Japan, India, Southeast Asia, Rest of Asia Pacific, GCC Countries, Southern Africa, Rest of MEA, Brazil, Rest of Latin America) – Global Insights, Growth, Size, Comparative Analysis, Trends and Forecast, 2018 - 2026
Industry Trends
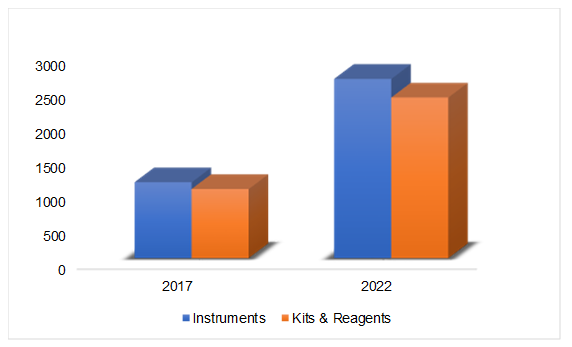
Biologics are entities derived from natural sources such as humans, animals or microorganisms. These are different from the chemically synthesized and structured drugs. Biologics may comprise of live attenuated microorganisms (vaccines), human cells and tissues (transplantation), cell therapies and gene therapies, allergenic extracts (allergy shots). Similar to any small molecule drug, Biologics is used for treating diseases and overcoming medical conditions. However, Biologics highlights higher range of drugs for treating specific diseases. For instance, entities like monoclonal antibodies and recombinant proteins target a specific disease such as cancer. In terms of revenue, the Global Biologics Outsourcing Market was valued at US$ 9,905.0 Mn in 2017 and is expected to reach US$ 22,810.3 Mn by 2022.
Global Biologics Outsourcing Market (USD Million), By Type, 2017-2022
Increasing investments in the research & development of biologics are significantly propelling the outsourcing market among the big as well as small pharmaceutical and biotechnological industries. Additionally, the robust inventory network guaranteed by the secondary manufacturer attracts the organizations for outsourcing of biologics. This is expected to eventually drive the biologics outsourcing market during the forecast period.
Although biologics are significantly costlier than small molecule drugs, these classes of medications prove to be exceedingly beneficial for the patient. Moreover, Biologics bring about 40% higher profit to the manufacturers when compared with small molecule drug treatments. Since the demand for biologics drugs and regulatory approvals have increased for these medications, there is an immense demand for biologics manufacture and testing at different levels of clinical examinations.
Biologics Outsourcing Market, By Product
On the basis of product, the antibody segment is projected to hold the largest and fastest growing segment over the research period. High use of antibodies for treating various chronic diseases, such as, asthma and diabetes, is projected to dominate the biologics outsourcing market during the forecast period. Globalization of the pharmaceutical industry has resulted in outsourcing options becoming more universal in nature. The monoclonal antibodies sub-segment of antibodies account for the major share of the market inferable from increased applications in the Pharma and biotechnology enterprises. The ongoing breadth and depth of research and innovation within the antibody engineering field guarantees that monoclonal antibodies-based products will boost the market.
Biologics Outsourcing Market, By Region
North America is the largest market for pharmaceutical/biopharmaceutical research, conducting more than three-quarters of the global R&D. It holds the IP rights for most of the world’s new drug products, hence it is dominating the market for biologics outsourcing globally. The Asia Pacific is anticipated to be the most profitable region, owing to the increasing pharmaceutical sector and rising government initiatives for the healthcare industry.
Competitive Market Share
The report provides both, subjective and quantitative research of the market, as well as integrates worthy insights into the rational scenario and favored development methods adopted by the key contenders. The report also offers extensive research on the key players in this market and detailed insights on the competitiveness of these players. The key business strategies such as M&A, affiliations, collaborations, and contracts adopted by the major players are also recognized and analyzed in the report. For each company, the report recognizes their manufacturing base, competitors, product type, application and specification, pricing, and gross margin.
Some of the significant players functioning in the Global Biologics Outsourcing Market include Boehringer Ingelheim GmbH, Catalent, Inc., GenScript, Albany Molecular Research Inc., Shanghai Medicilon Inc., Sino Biological Inc., Syngene, THE JACKSON LABORATORY, GL Biochem Corporation Ltd., GVK Biosciences Private Limited, Horizon Discovery Group plc., Innovent Biologics, Inc., JHL BIOTECH, INC., ProteoGenix, Inc., Selexis SA, Lonza, Abzena PLC, and Adimab LLC., among others.
Global Biologics Outsourcing Market Industry Background
1.
Introduction
1.1. Market Scope
1.2. Market Segmentation
1.3. Methodology
1.4. Assumptions
2.
Biological Organic
Fertilizers Market Snapshot
3.
Executive Summary:
Biological Organic Fertilizers Market
4.
Qualitative Analysis:
Biological Organic Fertilizers Market
4.1. Introduction
4.1.1. Product Definition
4.1.2. Industry Development
4.2. Market Dynamics
4.2.1. Drivers
4.2.2. Restraints
4.2.3. Opportunities
4.3. Trends in Market
5.
Global Biological Organic
Fertilizers Market Analysis and Forecasts, 2018 – 2026
5.1. Overview
5.1.1. Global Biological Organic Fertilizers Market Revenue (US$ Mn)
and Forecasts
5.2. Global Market Revenue (US$ Mn) and Forecasts, By Type
5.2.1. Microorganism (Definition, Market Penetration, Market Revenue
Expected to Increase by 2026, Compound Annual Growth Rate (CAGR) and
information on Rhizobium, Azotobacter, Azospirillum, Blue-green algae,
Phosphate solubilizing bacteria, Mycorrhiza, Others)
5.2.1.1. Rhizobium
5.2.1.2. Azotobacter
5.2.1.3. Azospirillum
5.2.1.4. Blue-green algae
5.2.1.5. Phosphate solubilizing bacteria
5.2.1.6. Mycorrhiza
5.2.1.7. Others
5.2.2. Organic residues (Definition, Market Penetration, Market
Revenue Expected to Increase by 2026, Compound Annual Growth Rate (CAGR) and
information on Fym, Crop residues, Green manure, Others)
5.2.2.1. Fym
5.2.2.2. Crop residues
5.2.2.3. Green manure
5.2.2.4. Others
5.3. Key Segment for Channeling Investments
5.3.1. By Type
6.
Global Biological Organic
Fertilizers Market Analysis and Forecasts, 2018 – 2026
6.1. Overview
6.2. Global Biological Organic Fertilizers Market Revenue (US$ Mn)
and Forecasts, By Application
6.2.1. Cereals
6.2.1.1. Definition
6.2.1.2. Market Penetration
6.2.1.3. Market Revenue Expected to Increase by 2026
6.2.1.4. Compound Annual Growth Rate (CAGR)
6.2.2. Legumes
6.2.2.1. Definition
6.2.2.2. Market Penetration
6.2.2.3. Market Revenue Expected to Increase by 2026
6.2.2.4. Compound Annual Growth Rate (CAGR)
6.2.3. Fruits and Vegetables
6.2.3.1. Definition
6.2.3.2. Market Penetration
6.2.3.3. Market Revenue Expected to Increase by 2026
6.2.3.4. Compound Annual Growth Rate (CAGR)
6.2.4. Plantations
6.2.4.1. Definition
6.2.4.2. Market Penetration
6.2.4.3. Market Revenue Expected to Increase by 2026
6.2.4.4. Compound Annual Growth Rate (CAGR)
6.2.5. Others
6.2.5.1. Definition
6.2.5.2. Market Penetration
6.2.5.3. Market Revenue Expected to Increase by 2026
6.2.5.4. Compound Annual Growth Rate (CAGR)
6.3. Key Segment for Channeling Investments
6.3.1. By Application
7.
North America Biological
Organic Fertilizers Market Analysis and Forecasts, 2018 – 2026
7.1. Overview
7.1.1. North America Biological Organic Fertilizers Market Revenue
(US$ Mn)
7.2. North America Market Revenue (US$ Mn) and Forecasts, By Type
7.2.1. Microorganism
7.2.1.1. Rhizobium
7.2.1.2. Azotobacter
7.2.1.3. Azospirillum
7.2.1.4. Blue-green algae
7.2.1.5. Phosphate solubilizing bacteria
7.2.1.6. Mycorrhiza
7.2.1.7. Others
7.2.2. Organic residues
7.2.2.1. Fym
7.2.2.2. Crop residues
7.2.2.3. Green manure
7.2.2.4. Others
7.3. North America Biological Organic Fertilizers Market Revenue
(US$ Mn) and Forecasts, By Application
7.3.1. Cereals
7.3.2. Legumes
7.3.3. Fruits and Vegetables
7.3.4. Plantations
7.3.5. Others
7.4. North America Biological Organic Fertilizers Market Revenue
(US$ Mn) and Forecasts, By Country
7.4.1. U.S.
7.4.1.1. U.S. Biological Organic Fertilizers Market Revenue (US$ Mn)
and Forecasts, By Type
7.4.1.1.1. Microorganism
7.4.1.1.1.1. Rhizobium
7.4.1.1.1.2. Azotobacter
7.4.1.1.1.3. Azospirillum
7.4.1.1.1.4. Blue-green algae
7.4.1.1.1.5. Phosphate solubilizing bacteria
7.4.1.1.1.6. Mycorrhiza
7.4.1.1.1.7. Others
7.4.1.1.2. Organic residues
7.4.1.1.2.1. Fym
7.4.1.1.2.2. Crop residues
7.4.1.1.2.3. Green manure
7.4.1.1.2.4. Others
7.4.1.2. U.S. Biological Organic Fertilizers Market Revenue (US$ Mn)
and Forecasts, By Application
7.4.1.2.1. Cereals
7.4.1.2.2. Legumes
7.4.1.2.3. Fruits and Vegetables
7.4.1.2.4. Plantations
7.4.1.2.5. Others
7.4.2. Rest of North America
7.4.2.1. Rest of North America Biological Organic Fertilizers Market
Revenue (US$ Mn) and Forecasts, By Type
7.4.2.1.1. Microorganism
7.4.2.1.1.1. Rhizobium
7.4.2.1.1.2. Azotobacter
7.4.2.1.1.3. Azospirillum
7.4.2.1.1.4. Blue-green algae
7.4.2.1.1.5. Phosphate solubilizing bacteria
7.4.2.1.1.6. Mycorrhiza
7.4.2.1.1.7. Others
7.4.2.1.2. Organic residues
7.4.2.1.2.1. Fym
7.4.2.1.2.2. Crop residues
7.4.2.1.2.3. Green manure
7.4.2.1.2.4. Others
7.4.2.2. Rest of North America Biological Organic Fertilizers Market
Revenue (US$ Mn) and Forecasts, By Application
7.4.2.2.1. Cereals
7.4.2.2.2. Legumes
7.4.2.2.3. Fruits and Vegetables
7.4.2.2.4. Plantations
7.4.2.2.5. Others
7.5. Key Segment for Channeling Investments
7.5.1. By Country
7.5.2. By Type
7.5.3. By Application
8.
Europe Biological Organic
Fertilizers Market Analysis and Forecasts, 2018 – 2026
8.1. Overview
8.1.1. Europe Biological Organic Fertilizers Market Revenue (US$ Mn)
8.2. Europe Market Revenue (US$ Mn) and Forecasts, By Type
8.2.1. Microorganism
8.2.1.1. Rhizobium
8.2.1.2. Azotobacter
8.2.1.3. Azospirillum
8.2.1.4. Blue-green algae
8.2.1.5. Phosphate solubilizing bacteria
8.2.1.6. Mycorrhiza
8.2.1.7. Others
8.2.2. Organic residues
8.2.2.1. Fym
8.2.2.2. Crop residues
8.2.2.3. Green manure
8.2.2.4. Others
8.3. Europe Biological Organic Fertilizers Market Revenue (US$ Mn)
and Forecasts, By Application
8.3.1. Cereals
8.3.2. Legumes
8.3.3. Fruits and Vegetables
8.3.4. Plantations
8.3.5. Others
8.4. Europe Biological Organic Fertilizers Market Revenue (US$ Mn)
and Forecasts, By Country
8.4.1. France
8.4.1.1. France Biological Organic Fertilizers Market Revenue (US$ Mn)
and Forecasts, By Type
8.4.1.1.1. Microorganism
8.4.1.1.1.1. Rhizobium
8.4.1.1.1.2. Azotobacter
8.4.1.1.1.3. Azospirillum
8.4.1.1.1.4. Blue-green algae
8.4.1.1.1.5. Phosphate solubilizing bacteria
8.4.1.1.1.6. Mycorrhiza
8.4.1.1.1.7. Others
8.4.1.1.2. Organic residues
8.4.1.1.2.1. Fym
8.4.1.1.2.2. Crop residues
8.4.1.1.2.3. Green manure
8.4.1.1.2.4. Others
8.4.1.2. France Biological Organic Fertilizers Market Revenue (US$ Mn)
and Forecasts, By Application
8.4.1.2.1. Cereals
8.4.1.2.2. Legumes
8.4.1.2.3. Fruits and Vegetables
8.4.1.2.4. Plantations
8.4.1.2.5. Others
8.4.2. The UK
8.4.2.1. The UK Biological Organic Fertilizers Market Revenue (US$ Mn)
and Forecasts, By Type
8.4.2.1.1. Microorganism
8.4.2.1.1.1. Rhizobium
8.4.2.1.1.2. Azotobacter
8.4.2.1.1.3. Azospirillum
8.4.2.1.1.4. Blue-green algae
8.4.2.1.1.5. Phosphate solubilizing bacteria
8.4.2.1.1.6. Mycorrhiza
8.4.2.1.1.7. Others
8.4.2.1.2. Organic residues
8.4.2.1.2.1. Fym
8.4.2.1.2.2. Crop residues
8.4.2.1.2.3. Green manure
8.4.2.1.2.4. Others
8.4.2.2. The UK Biological Organic Fertilizers Market Revenue (US$ Mn)
and Forecasts, By Application
8.4.2.2.1. Cereals
8.4.2.2.2. Legumes
8.4.2.2.3. Fruits and Vegetables
8.4.2.2.4. Plantations
8.4.2.2.5. Others
8.4.3. Spain
8.4.3.1. Spain Biological Organic Fertilizers Market Revenue (US$ Mn)
and Forecasts, By Type
8.4.3.1.1. Microorganism
8.4.3.1.1.1. Rhizobium
8.4.3.1.1.2. Azotobacter
8.4.3.1.1.3. Azospirillum
8.4.3.1.1.4. Blue-green algae
8.4.3.1.1.5. Phosphate solubilizing bacteria
8.4.3.1.1.6. Mycorrhiza
8.4.3.1.1.7. Others
8.4.3.1.2. Organic residues
8.4.3.1.2.1. Fym
8.4.3.1.2.2. Crop residues
8.4.3.1.2.3. Green manure
8.4.3.1.2.4. Others
8.4.3.2. Spain Biological Organic Fertilizers Market Revenue (US$ Mn)
and Forecasts, By Application
8.4.3.2.1. Cereals
8.4.3.2.2. Legumes
8.4.3.2.3. Fruits and Vegetables
8.4.3.2.4. Plantations
8.4.3.2.5. Others
8.4.4. Germany
8.4.4.1. Germany Biological Organic Fertilizers Market Revenue (US$ Mn)
and Forecasts, By Type
8.4.4.1.1. Microorganism
8.4.4.1.1.1. Rhizobium
8.4.4.1.1.2. Azotobacter
8.4.4.1.1.3. Azospirillum
8.4.4.1.1.4. Blue-green algae
8.4.4.1.1.5. Phosphate solubilizing bacteria
8.4.4.1.1.6. Mycorrhiza
8.4.4.1.1.7. Others
8.4.4.1.2. Organic residues
8.4.4.1.2.1. Fym
8.4.4.1.2.2. Crop residues
8.4.4.1.2.3. Green manure
8.4.4.1.2.4. Others
8.4.4.2. Germany Biological Organic Fertilizers Market Revenue (US$ Mn)
and Forecasts, By Application
8.4.4.2.1. Cereals
8.4.4.2.2. Legumes
8.4.4.2.3. Fruits and Vegetables
8.4.4.2.4. Plantations
8.4.4.2.5. Others
8.4.5. Italy
8.4.5.1. Italy Biological Organic Fertilizers Market Revenue (US$ Mn)
and Forecasts, By Type
8.4.5.1.1. Microorganism
8.4.5.1.1.1. Rhizobium
8.4.5.1.1.2. Azotobacter
8.4.5.1.1.3. Azospirillum
8.4.5.1.1.4. Blue-green algae
8.4.5.1.1.5. Phosphate solubilizing bacteria
8.4.5.1.1.6. Mycorrhiza
8.4.5.1.1.7. Others
8.4.5.1.2. Organic residues
8.4.5.1.2.1. Fym
8.4.5.1.2.2. Crop residues
8.4.5.1.2.3. Green manure
8.4.5.1.2.4. Others
8.4.5.2. Italy Biological Organic Fertilizers Market Revenue (US$ Mn)
and Forecasts, By Application
8.4.5.2.1. Cereals
8.4.5.2.2. Legumes
8.4.5.2.3. Fruits and Vegetables
8.4.5.2.4. Plantations
8.4.5.2.5. Others
8.4.6. Rest of Europe
8.4.6.1. Rest of Europe Biological Organic Fertilizers Market Revenue
(US$ Mn) and Forecasts, By Type
8.4.6.1.1. Microorganism
8.4.6.1.1.1. Rhizobium
8.4.6.1.1.2. Azotobacter
8.4.6.1.1.3. Azospirillum
8.4.6.1.1.4. Blue-green algae
8.4.6.1.1.5. Phosphate solubilizing bacteria
8.4.6.1.1.6. Mycorrhiza
8.4.6.1.1.7. Others
8.4.6.1.2. Organic residues
8.4.6.1.2.1. Fym
8.4.6.1.2.2. Crop residues
8.4.6.1.2.3. Green manure
8.4.6.1.2.4. Others
8.4.6.2. Rest of Europe Biological Organic Fertilizers Market Revenue
(US$ Mn) and Forecasts, By Application
8.4.6.2.1. Cereals
8.4.6.2.2. Legumes
8.4.6.2.3. Fruits and Vegetables
8.4.6.2.4. Plantations
8.4.6.2.5. Others
8.5. Key Segment for Channeling Investments
8.5.1. By Country
8.5.2. By Type
8.5.3. By Application
9.
Asia Pacific Biological
Organic Fertilizers Market Analysis and Forecasts, 2018 – 2026
9.1. Overview
9.1.1. Asia Pacific Market Revenue (US$ Mn)
9.2. Asia Pacific Biological Organic Fertilizers Market Revenue
(US$ Mn) and Forecasts, By Type
9.2.1. Microorganism
9.2.1.1. Rhizobium
9.2.1.2. Azotobacter
9.2.1.3. Azospirillum
9.2.1.4. Blue-green algae
9.2.1.5. Phosphate solubilizing bacteria
9.2.1.6. Mycorrhiza
9.2.1.7. Others
9.2.2. Organic residues
9.2.2.1. Fym
9.2.2.2. Crop residues
9.2.2.3. Green manure
9.2.2.4. Others
9.3. Asia Pacific Biological Organic Fertilizers Market Revenue
(US$ Mn) and Forecasts, By Application
9.3.1. Cereals
9.3.2. Legumes
9.3.3. Fruits and Vegetables
9.3.4. Plantations
9.3.5. Others
9.4. Asia Pacific Biological Organic Fertilizers Market Revenue
(US$ Mn) and Forecasts, By Country
9.4.1. China
9.4.1.1. China Biological Organic Fertilizers Market Revenue (US$ Mn)
and Forecasts, By Type
9.4.1.1.1. Microorganism
9.4.1.1.1.1. Rhizobium
9.4.1.1.1.2. Azotobacter
9.4.1.1.1.3. Azospirillum
9.4.1.1.1.4. Blue-green algae
9.4.1.1.1.5. Phosphate solubilizing bacteria
9.4.1.1.1.6. Mycorrhiza
9.4.1.1.1.7. Others
9.4.1.1.2. Organic residues
9.4.1.1.2.1. Fym
9.4.1.1.2.2. Crop residues
9.4.1.1.2.3. Green manure
9.4.1.1.2.4. Others
9.4.1.2. China Biological Organic Fertilizers Market Revenue (US$ Mn)
and Forecasts, By Application
9.4.1.2.1. Cereals
9.4.1.2.2. Legumes
9.4.1.2.3. Fruits and Vegetables
9.4.1.2.4. Plantations
9.4.1.2.5. Others
9.4.2. Japan
9.4.2.1. Japan Biological Organic Fertilizers Market Revenue (US$ Mn)
and Forecasts, By Type
9.4.2.1.1. Microorganism
9.4.2.1.1.1. Rhizobium
9.4.2.1.1.2. Azotobacter
9.4.2.1.1.3. Azospirillum
9.4.2.1.1.4. Blue-green algae
9.4.2.1.1.5. Phosphate solubilizing bacteria
9.4.2.1.1.6. Mycorrhiza
9.4.2.1.1.7. Others
9.4.2.1.2. Organic residues
9.4.2.1.2.1. Fym
9.4.2.1.2.2. Crop residues
9.4.2.1.2.3. Green manure
9.4.2.1.2.4. Others
9.4.2.2. Japan Biological Organic Fertilizers Market Revenue (US$ Mn)
and Forecasts, By Application
9.4.2.2.1. Cereals
9.4.2.2.2. Legumes
9.4.2.2.3. Fruits and Vegetables
9.4.2.2.4. Plantations
9.4.2.2.5. Others
9.4.3. India
9.4.3.1. India Biological Organic Fertilizers Market Revenue (US$ Mn)
and Forecasts, By Type
9.4.3.1.1. Microorganism
9.4.3.1.1.1. Rhizobium
9.4.3.1.1.2. Azotobacter
9.4.3.1.1.3. Azospirillum
9.4.3.1.1.4. Blue-green algae
9.4.3.1.1.5. Phosphate solubilizing bacteria
9.4.3.1.1.6. Mycorrhiza
9.4.3.1.1.7. Others
9.4.3.1.2. Organic residues
9.4.3.1.2.1. Fym
9.4.3.1.2.2. Crop residues
9.4.3.1.2.3. Green manure
9.4.3.1.2.4. Others
9.4.3.2. India Biological Organic Fertilizers Market Revenue (US$ Mn)
and Forecasts, By Application
9.4.3.2.1. Cereals
9.4.3.2.2. Legumes
9.4.3.2.3. Fruits and Vegetables
9.4.3.2.4. Plantations
9.4.3.2.5. Others
9.4.4. Southeast Asia
9.4.4.1. Southeast Asia Biological Organic Fertilizers Market Revenue
(US$ Mn) and Forecasts, By Type
9.4.4.1.1. Microorganism
9.4.4.1.1.1. Rhizobium
9.4.4.1.1.2. Azotobacter
9.4.4.1.1.3. Azospirillum
9.4.4.1.1.4. Blue-green algae
9.4.4.1.1.5. Phosphate solubilizing bacteria
9.4.4.1.1.6. Mycorrhiza
9.4.4.1.1.7. Others
9.4.4.1.2. Organic residues
9.4.4.1.2.1. Fym
9.4.4.1.2.2. Crop residues
9.4.4.1.2.3. Green manure
9.4.4.1.2.4. Others
9.4.4.2. Southeast Asia Biological Organic Fertilizers Market Revenue
(US$ Mn) and Forecasts, By Application
9.4.4.2.1. Cereals
9.4.4.2.2. Legumes
9.4.4.2.3. Fruits and Vegetables
9.4.4.2.4. Plantations
9.4.4.2.5. Others
9.4.5. Rest of Asia Pacific
9.4.5.1. Rest of Asia Pacific Biological Organic Fertilizers Market
Revenue (US$ Mn) and Forecasts, By Type
9.4.5.1.1. Microorganism
9.4.5.1.1.1. Rhizobium
9.4.5.1.1.2. Azotobacter
9.4.5.1.1.3. Azospirillum
9.4.5.1.1.4. Blue-green algae
9.4.5.1.1.5. Phosphate solubilizing bacteria
9.4.5.1.1.6. Mycorrhiza
9.4.5.1.1.7. Others
9.4.5.1.2. Organic residues
9.4.5.1.2.1. Fym
9.4.5.1.2.2. Crop residues
9.4.5.1.2.3. Green manure
9.4.5.1.2.4. Others
9.4.5.2. Rest of Asia Pacific Biological Organic Fertilizers Market
Revenue (US$ Mn) and Forecasts, By Application
9.4.5.2.1. Cereals
9.4.5.2.2. Legumes
9.4.5.2.3. Fruits and Vegetables
9.4.5.2.4. Plantations
9.4.5.2.5. Others
9.5. Key Segment for Channeling Investments
9.5.1. By Country
9.5.2. By Type
9.5.3. By Application
10.
Middle East and Africa
Biological Organic Fertilizers Market Analysis and Forecasts, 2018 – 2026
10.1. Overview
10.1.1. Middle East and Africa Market Revenue (US$ Mn)
10.2. Middle East and Africa Biological Organic Fertilizers Market
Revenue (US$ Mn) and Forecasts, By Type
10.2.1. Microorganism
10.2.1.1. Rhizobium
10.2.1.2. Azotobacter
10.2.1.3. Azospirillum
10.2.1.4. Blue-green algae
10.2.1.5. Phosphate solubilizing bacteria
10.2.1.6. Mycorrhiza
10.2.1.7. Others
10.2.2. Organic residues
10.2.2.1. Fym
10.2.2.2. Crop residues
10.2.2.3. Green manure
10.2.2.4. Others
10.3. Middle East and Africa Biological Organic Fertilizers Market
Revenue (US$ Mn) and Forecasts, By Application
10.3.1. Cereals
10.3.2. Legumes
10.3.3. Fruits and Vegetables
10.3.4. Plantations
10.3.5. Others
10.4. Middle East and Africa Biological Organic Fertilizers Market
Revenue (US$ Mn) and Forecasts, By Country
10.4.1. GCC Countries
10.4.1.1. GCC Countries Biological Organic Fertilizers Market Revenue
(US$ Mn) and Forecasts, By Type
10.4.1.1.1. Microorganism
10.4.1.1.1.1. Rhizobium
10.4.1.1.1.2. Azotobacter
10.4.1.1.1.3. Azospirillum
10.4.1.1.1.4. Blue-green
algae
10.4.1.1.1.5. Phosphate
solubilizing bacteria
10.4.1.1.1.6. Mycorrhiza
10.4.1.1.1.7. Others
10.4.1.1.2. Organic residues
10.4.1.1.2.1. Fym
10.4.1.1.2.2. Crop residues
10.4.1.1.2.3. Green manure
10.4.1.1.2.4. Others
10.4.1.2. GCC Countries Biological Organic Fertilizers Market Revenue
(US$ Mn) and Forecasts, By Application
10.4.1.2.1. Cereals
10.4.1.2.2. Legumes
10.4.1.2.3. Fruits and Vegetables
10.4.1.2.4. Plantations
10.4.1.2.5. Others
10.4.2. Southern Africa
10.4.2.1. Southern Africa Biological Organic Fertilizers Market Revenue
(US$ Mn) and Forecasts, By Type
10.4.2.1.1. Microorganism
10.4.2.1.1.1. Rhizobium
10.4.2.1.1.2. Azotobacter
10.4.2.1.1.3. Azospirillum
10.4.2.1.1.4. Blue-green algae
10.4.2.1.1.5. Phosphate solubilizing bacteria
10.4.2.1.1.6. Mycorrhiza
10.4.2.1.1.7. Others
10.4.2.1.2. Organic residues
10.4.2.1.2.1. Fym
10.4.2.1.2.2. Crop residues
10.4.2.1.2.3. Green manure
10.4.2.1.2.4. Others
10.4.2.2. Southern Africa Biological Organic Fertilizers Market Revenue
(US$ Mn) and Forecasts, By Application
10.4.2.2.1. Cereals
10.4.2.2.2. Legumes
10.4.2.2.3. Fruits and Vegetables
10.4.2.2.4. Plantations
10.4.2.2.5. Others
10.4.3. Rest of MEA
10.4.3.1. Rest of MEA Biological Organic Fertilizers Market Revenue (US$
Mn) and Forecasts, By Type
10.4.3.1.1. Microorganism
10.4.3.1.1.1. Rhizobium
10.4.3.1.1.2. Azotobacter
10.4.3.1.1.3. Azospirillum
10.4.3.1.1.4. Blue-green algae
10.4.3.1.1.5. Phosphate solubilizing bacteria
10.4.3.1.1.6. Mycorrhiza
10.4.3.1.1.7. Others
10.4.3.1.2. Organic residues
10.4.3.1.2.1. Fym
10.4.3.1.2.2. Crop residues
10.4.3.1.2.3. Green manure
10.4.3.1.2.4. Others
10.4.3.2. Rest of MEA Biological Organic Fertilizers Market Revenue (US$
Mn) and Forecasts, By Application
10.4.3.2.1. Cereals
10.4.3.2.2. Legumes
10.4.3.2.3. Fruits and Vegetables
10.4.3.2.4. Plantations
10.4.3.2.5. Others
10.5. Key Segment for Channeling Investments
10.5.1. By Country
10.5.2. By Type
10.5.3. By Application
11.
Latin America Biological
Organic Fertilizers Market Analysis and Forecasts, 2018 – 2026
11.1. Overview
11.1.1. Latin America Biological Organic Fertilizers Market Revenue
(US$ Mn)
11.2. Latin America Market Revenue (US$ Mn) and Forecasts, By Type
11.2.1. Microorganism
11.2.1.1. Rhizobium
11.2.1.2. Azotobacter
11.2.1.3. Azospirillum
11.2.1.4. Blue-green algae
11.2.1.5. Phosphate solubilizing bacteria
11.2.1.6. Mycorrhiza
11.2.1.7. Others
11.2.2. Organic residues
11.2.2.1. Fym
11.2.2.2. Crop residues
11.2.2.3. Green manure
11.2.2.4. Others
11.3. Latin America Biological Organic Fertilizers Market Revenue
(US$ Mn) and Forecasts, By Application
11.3.1. Cereals
11.3.2. Legumes
11.3.3. Fruits and Vegetables
11.3.4. Plantations
11.3.5. Others
11.4. Latin America Biological Organic Fertilizers Market Revenue
(US$ Mn) and Forecasts, By Country
11.4.1. Brazil
11.4.1.1. Brazil Biological Organic Fertilizers Market Revenue (US$ Mn)
and Forecasts, By Type
11.4.1.1.1. Microorganism
11.4.1.1.1.1. Rhizobium
11.4.1.1.1.2. Azotobacter
11.4.1.1.1.3. Azospirillum
11.4.1.1.1.4. Blue-green algae
11.4.1.1.1.5. Phosphate solubilizing bacteria
11.4.1.1.1.6. Mycorrhiza
11.4.1.1.1.7. Others
11.4.1.1.2. Organic residues
11.4.1.1.2.1. Fym
11.4.1.1.2.2. Crop residues
11.4.1.1.2.3. Green manure
11.4.1.1.2.4. Others
11.4.1.2. Brazil Biological Organic Fertilizers Market Revenue (US$ Mn)
and Forecasts, By Application
11.4.1.2.1. Cereals
11.4.1.2.2. Legumes
11.4.1.2.3. Fruits and Vegetables
11.4.1.2.4. Plantations
11.4.1.2.5. Others
11.4.2. Rest of Latin America
11.4.2.1. Rest of Latin America Biological Organic Fertilizers Market
Revenue (US$ Mn) and Forecasts, By Type
11.4.2.1.1. Microorganism
11.4.2.1.1.1. Rhizobium
11.4.2.1.1.2. Azotobacter
11.4.2.1.1.3. Azospirillum
11.4.2.1.1.4. Blue-green algae
11.4.2.1.1.5. Phosphate solubilizing bacteria
11.4.2.1.1.6. Mycorrhiza
11.4.2.1.1.7. Others
11.4.2.1.2. Organic residues
11.4.2.1.2.1. Fym
11.4.2.1.2.2. Crop residues
11.4.2.1.2.3. Green manure
11.4.2.1.2.4. Others
11.4.2.2. Rest of Latin America Biological Organic Fertilizers Market
Revenue (US$ Mn) and Forecasts, By Application
11.4.2.2.1. Cereals
11.4.2.2.2. Legumes
11.4.2.2.3. Fruits and Vegetables
11.4.2.2.4. Plantations
11.4.2.2.5. Others
11.5. Key Segment for Channeling Investments
11.5.1. By Country
11.5.2. By Type
11.5.3. By Application
12.
Competitive Benchmarking
12.1. Player Positioning Analysis
12.2. Global Presence and Growth Strategies
13.
Player Profiles
13.1. Agri Life
13.1.1. Company Details
13.1.2. Company Overview
13.1.3. Product Offerings
13.1.4. Key Developments
13.1.5. Financial Analysis
13.1.6. SWOT Analysis
13.1.7. Business Strategies
13.2. Bio Protan
13.2.1. Company Details
13.2.2. Company Overview
13.2.3. Product Offerings
13.2.4. Key Developments
13.2.5. Financial Analysis
13.2.6. SWOT Analysis
13.2.7. Business Strategies
13.3. Camson Bio Technologies Limited
13.3.1. Company Details
13.3.2. Company Overview
13.3.3. Product Offerings
13.3.4. Key Developments
13.3.5. Financial Analysis
13.3.6. SWOT Analysis
13.3.7. Business Strategies
13.4. Ferm O Feed
13.4.1. Company Details
13.4.2. Company Overview
13.4.3. Product Offerings
13.4.4. Key Developments
13.4.5. Financial Analysis
13.4.6. SWOT Analysis
13.4.7. Business Strategies
13.5. Fertagon
13.5.1. Company Details
13.5.2. Company Overview
13.5.3. Product Offerings
13.5.4. Key Developments
13.5.5. Financial Analysis
13.5.6. SWOT Analysis
13.5.7. Business Strategies
13.6. Futureco Bioscience S.A.
13.6.1. Company Details
13.6.2. Company Overview
13.6.3. Product Offerings
13.6.4. Key Developments
13.6.5. Financial Analysis
13.6.6. SWOT Analysis
13.6.7. Business Strategies
13.7. Gujarat State Fertilizers & Chemicals Ltd
13.7.1. Company Details
13.7.2. Company Overview
13.7.3. Product Offerings
13.7.4. Key Developments
13.7.5. Financial Analysis
13.7.6. SWOT Analysis
13.7.7. Business Strategies
13.8. Italpollina spa
13.8.1. Company Details
13.8.2. Company Overview
13.8.3. Product Offerings
13.8.4. Key Developments
13.8.5. Financial Analysis
13.8.6. SWOT Analysis
13.8.7. Business Strategies
13.9. Kribhco
13.9.1. Company Details
13.9.2. Company Overview
13.9.3. Product Offerings
13.9.4. Key Developments
13.9.5. Financial Analysis
13.9.6. SWOT Analysis
13.9.7. Business Strategies
13.10. Lallemand
Inc.
13.10.1. Company
Details
13.10.2. Company
Overview
13.10.3. Product
Offerings
13.10.4. Key Developments
13.10.5. Financial
Analysis
13.10.6. SWOT
Analysis
13.10.7. Business
Strategies
13.11. Madras Fertilizers Limited
13.11.1. Company
Details
13.11.2. Company
Overview
13.11.3. Product
Offerings
13.11.4. Key
Developments
13.11.5. Financial
Analysis
13.11.6. SWOT
Analysis
13.11.7. Business
Strategies
13.12. Multiplex Group
13.12.1. Company Details
13.12.2. Company Overview
13.12.3. Product Offerings
13.12.4. Key Developments
13.12.5. Financial Analysis
13.12.6. SWOT Analysis
13.12.7. Business Strategies
13.13. National Fertilizers Limited
13.13.1. Company Details
13.13.2. Company Overview
13.13.3. Product Offerings
13.13.4. Key Developments
13.13.5. Financial Analysis
13.13.6. SWOT Analysis
13.13.7. Business Strategies
13.14. Neochim
13.14.1. Company Details
13.14.2. Company Overview
13.14.3. Product Offerings
13.14.4. Key Developments
13.14.5. Financial Analysis
13.14.6. SWOT Analysis
13.14.7. Business Strategies
13.15. Novozymes A/S
13.15.1. Company Details
13.15.2. Company Overview
13.15.3. Product Offerings
13.15.4. Key Developments
13.15.5. Financial Analysis
13.15.6. SWOT Analysis
13.15.7. Business Strategies
13.16. Nutramax Laboratories Inc.
13.16.1. Company Details
13.16.2. Company Overview
13.16.3. Product Offerings
13.16.4. Key Developments
13.16.5. Financial Analysis
13.16.6. SWOT Analysis
13.16.7. Business Strategies
13.17. Premier Tech
13.17.1. Company Details
13.17.2. Company Overview
13.17.3. Product Offerings
13.17.4. Key Developments
13.17.5. Financial Analysis
13.17.6. SWOT Analysis
13.17.7. Business Strategies
13.18. Rashtriya Chemicals & Fertilizers Ltd
13.18.1. Company Details
13.18.2. Company Overview
13.18.3. Product Offerings
13.18.4. Key Developments
13.18.5. Financial Analysis
13.18.6. SWOT Analysis
13.18.7. Business Strategies
13.19. Rizobacter Argentina S.A.
13.19.1. Company Details
13.19.2. Company Overview
13.19.3. Product Offerings
13.19.4. Key Developments
13.19.5. Financial Analysis
13.19.6. SWOT Analysis
13.19.7. Business Strategies
13.20. SKS BIOPRODUCTS PVT LTD
13.20.1. Company Details
13.20.2. Company Overview
13.20.3. Product Offerings
13.20.4. Key Developments
13.20.5. Financial Analysis
13.20.6. SWOT Analysis
13.20.7. Business Strategies
13.21. Symborg
13.21.1. Company Details
13.21.2. Company Overview
13.21.3. Product Offerings
13.21.4. Key Developments
13.21.5. Financial Analysis
13.21.6. SWOT Analysis
13.21.7. Business Strategies
13.22. T Stanes & Company Limited
13.22.1. Company Details
13.22.2. Company Overview
13.22.3. Product Offerings
13.22.4. Key Developments
13.22.5. Financial Analysis
13.22.6. SWOT Analysis
13.22.7. Business Strategies
Note: This ToC is
tentative and can be changed according to the research study conducted during
the course of report completion.
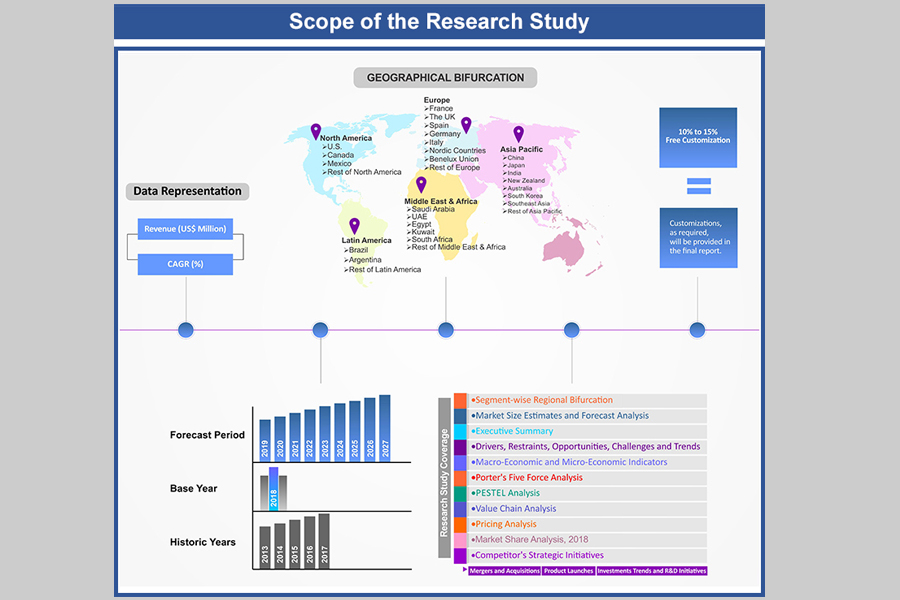
At Absolute Markets Insights, we are engaged in building both global as well as country specific reports. As a result, the approach taken for deriving the estimation and forecast for a specific country is a bit unique and different in comparison to the global research studies. In this case, we not only study the concerned market factors & trends prevailing in a particular country (from secondary research) but we also tend to calculate the actual market size & forecast from the revenue generated from the market participants involved in manufacturing or distributing the any concerned product. These companies can also be service providers. For analyzing any country specifically, we do consider the growth factors prevailing under the states/cities/county for the same. For instance, if we are analyzing an industry specific to United States, we primarily need to study about the states present under the same(where the product/service has the highest growth). Similar analysis will be followed by other countries. Our scope of the report changes with different markets.
Our research study is mainly implement through a mix of both secondary and primary research. Various sources such as industry magazines, trade journals, and government websites and trade associations are reviewed for gathering precise data. Primary interviews are conducted to validate the market size derived from secondary research. Industry experts, major manufacturers and distributors are contacted for further validation purpose on the current market penetration and growth trends.
Prominent participants in our primary research process include:
- Key Opinion Leaders namely the CEOs, CSOs, VPs, purchasing managers, amongst others
- Research and development participants, distributors/suppliers and subject matter experts
Secondary Research includes data extracted from paid data sources:
- Reuters
- Factiva
- Bloomberg
- One Source
- Hoovers
Research Methodology

Key Inclusions
Reach to us
Call us on
+91-74002-42424
Drop us an email at
sales@absolutemarketsinsights.com
Why Absolute Markets Insights?
An effective strategy is the entity that influences a business to stand out of the crowd. An organization with a phenomenal strategy for success dependably has the edge over the rivals in the market. It offers the organizations a head start in planning their strategy. Absolute Market Insights is the new initiation in the industry that will furnish you with the lead your business needs. Absolute Market Insights is the best destination for your business intelligence and analytical solutions; essentially because our qualitative and quantitative sources of information are competent to give one-stop solutions. We inventively combine qualitative and quantitative research in accurate proportions to have the best report, which not only gives the most recent insights but also assists you to grow.
