
Mining Renewable Energy Systems Market by Source Type (Wind, Biomass, Biofuel, Solar, Geothermal); by Regional outlook (U.S., Rest of North America, France, UK, Germany, Spain, Italy, Rest of Europe, China, Japan, India, Southeast Asia, Rest of Asia Pacific, GCC Countries, Southern Africa, Rest of MEA, Brazil, Rest of Latin America) – Global Insights, Industry Trends, Price Trends, Growth, Size, Supply, Demand, Comparative Analysis, Competitive Market Share and Forecast, 2018-2026
Industry Trends
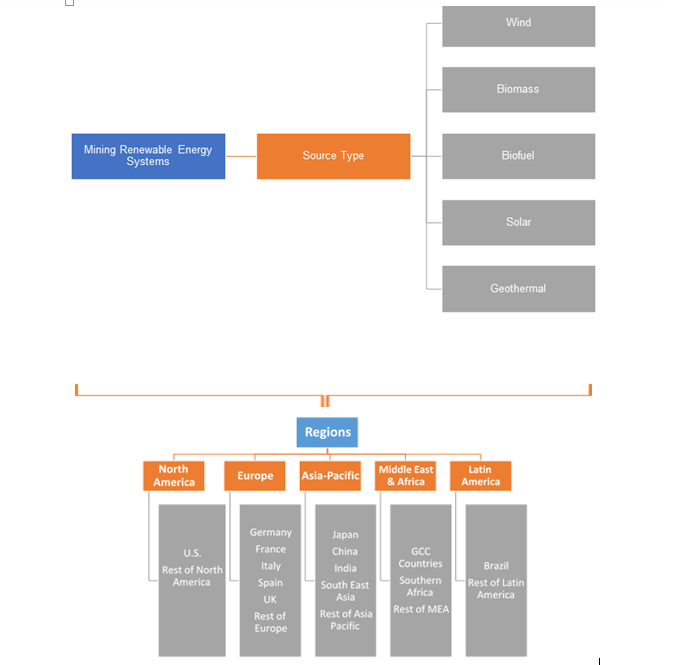
Mining renewable energy systems are clean sources of power generation that are used for mining at locations, situated in off-grid areas. These sources include wind, biomass, biofuel, solar, and geothermal among others. The amount of energy per unit, as well as power and diesel costs are increasing. Whereas the costs for sustainable power sources, such as wind and solar, have witnessed a notable drop in recent years. As a result of this, mining organizations have been adopting renewable energy systems and integrating it into their mining activities.
The mining renewable energy systems market, in terms of revenue, which was estimated at USD 2,732.9 million in 2017, is expected to reach USD 3,864.3 million in 2022.
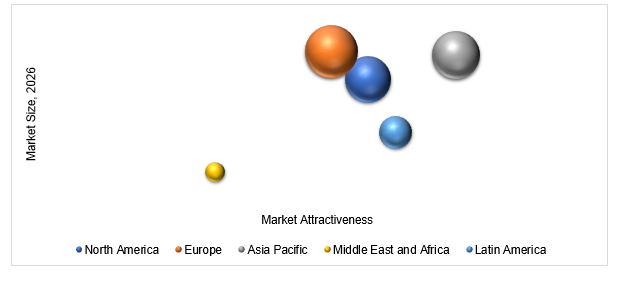
Global Mining Renewable Energy Systems Market, By Region, 2018 - 2026 (USD Million)
The cost of power generation through conventional sources, such as diesel gensets, is usually high, which increases the operational cost of mining. Renewable energy is a favorable add-on to diesel gensets, which tackles this problem and reduces the operational costs. Thus, the adoption of mining renewable energy systems is fueled by expensive conventional sources of energy.
In mining, solar or wind systems are combined with or integrated into existing diesel control plants. Wind and solar energy are approximately 70% more affordable than electricity generated from diesel. Solar and wind energy prices have reduced considerably in recent times. Solar module processes have decreased around 30% in the recent past. The wind turbine towers have turned out to be taller, resulting in an effective power generation in numerous areas where the wind isn't sufficient enough at lower altitudes. Thus, renewable energy systems in mining are emerging as a dependable alternative and have been drawing in many institutional investors.
A number of organizations do not have the assets and funding to finance new sustainable power source projects. Solar and wind projects require high capital speculation, whereas electricity generation with diesel motors require low investment costs and offers high working costs. This is creating obstacles in the development of the market.
Mining Renewable Energy Systems Market, By Source Type
On the basis of the source type, the solar segment is expected to be the most attractive segment of the global mining renewable energy systems market. Solar is a source of decentralized energy, which makes it reasonable for mining applications. It produces clean energy by reducing the gas emissions, which harms the ozone. As most of the key players are aware of its advantages, the demand is expected to increase in the coming years. Furthermore, the presence of a significant number of mines in the tropical regions is another factor driving the demand for solar energy in mining activities.
Mining Renewable Energy Systems Market, By Region
Asia Pacific region is expected to grow at the fastest rate in the global market. The countries in this region produce a lot of minerals such as iron, copper, nickel, silver, lead, and so on. Additionally, the increasing awareness with regards to the application and advantages of sustainable power source systems in power generation, has triggered the development of the market in this region. The mining renewable energy systems market in the Asia Pacific is anticipated to witness huge profits over the forecast period. Mining industry contributes roughly 24% to the total Asia Pacific economies. The governments in the region are encouraging the adoption of favorable practices in mining in order to achieve sustainable growth.
Competitive Landscape
The report provides both, subjective and quantitative research of the market, as well as integrates worthy insights into the rational scenario and favored development methods adopted by the key contenders. The report also offers extensive research on the key players in this market and detailed insights on the competitiveness of these players. The key business strategies such as M&A, affiliations, collaborations, and contracts adopted by the major players are also recognized and analyzed in the report. For each company, the report recognizes their manufacturing base, competitors, product type, application and specification, pricing, and gross margin.
Some of the primary participants for mining renewable energy systems market are Downer Group, Enel Green Power, General Electric, Hanwha Group, Juwi AG, Newmont Mining Corporation, Nuance Energy Group, Inc., Pöyry PLC, Siemens AG, Bluhm Burton Engineering Pty Ltd (BBE), Barrick Gold Corporation, Black & Veatch Holding Company, Cambridge Energy Partners, Conergy, CRONIMET Mining Power Solutions GmbH, ViZn Energy, Vergnet, and SolarReserve, LLC amongst others.

Mining Renewable Energy Systems Industry Background
1. Introduction
1.1. Market
Scope
1.2. Market
Segmentation
1.3. Methodology
1.4. Assumptions
2. Mining Renewable Energy Systems Market Snapshot
3. Executive Summary: Mining Renewable Energy Systems Market
4. Qualitative Analysis: Mining Renewable Energy Systems Market
4.1. Introduction
4.1.1. Product
Definition
4.1.2. Industry
Development
4.2. Market
Dynamics
4.2.1. Drivers
4.2.2. Restraints
4.2.3. Opportunities
4.3. Trends in
Market
5. Global Mining Renewable Energy Systems Market Analysis and
Forecasts, 2018 – 2026
5.1. Overview
5.1.1. Global
Market Revenue (US$ Mn) and Forecasts
5.2. Global
Mining Renewable Energy Systems Market Revenue (US$ Mn) and Forecasts, By
Source
5.2.1. Wind
5.2.1.1. Definition
5.2.1.2. Market Penetration
5.2.1.3. Market Revenue Expected to Increase by 2026
5.2.1.4. Compound Annual Growth Rate (CAGR)
5.2.2. Biomass
5.2.2.1. Definition
5.2.2.2. Market Penetration
5.2.2.3. Market Revenue Expected to Increase by 2026
5.2.2.4. Compound Annual Growth Rate (CAGR)
5.2.3. Biofuel
5.2.3.1. Definition
5.2.3.2. Market Penetration
5.2.3.3. Market Revenue Expected to Increase by 2026
5.2.3.4. Compound Annual Growth Rate (CAGR)
5.2.4. Solar
5.2.4.1. Definition
5.2.4.2. Market Penetration
5.2.4.3. Market Revenue Expected to Increase by 2026
5.2.4.4. Compound Annual Growth Rate (CAGR)
5.2.5. Geothermal
5.2.5.1. Definition
5.2.5.2. Market Penetration
5.2.5.3. Market Revenue Expected to Increase by 2026
5.2.5.4. Compound Annual Growth Rate (CAGR)
5.3. Key
Segment for Channeling Investments
5.3.1. By
Source
6. North America Mining Renewable Energy Systems Market Analysis
and Forecasts, 2018 – 2026
6.1. Overview
6.1.1. North
America Market Revenue (US$ Mn)
6.2. North
America Mining Renewable Energy Systems Market Revenue (US$ Mn) and Forecasts,
By Source
6.2.1. Wind
6.2.2. Biomass
6.2.3. Biofuel
6.2.4. Solar
6.2.5. Geothermal
6.3. North
America Mining Renewable Energy Systems Market Revenue (US$ Mn) and Forecasts,
By Country
6.3.1. U.S.
6.3.1.1. U.S. Mining Renewable Energy Systems Market Revenue (US$ Mn)
and Forecasts, By Source
6.3.1.1.1. Wind
6.3.1.1.2. Biomass
6.3.1.1.3. Biofuel
6.3.1.1.4. Solar
6.3.1.1.5.
Geothermal
6.3.2. Canada
6.3.2.1. Canada Mining Renewable Energy Systems Market Revenue (US$ Mn)
and Forecasts, By Source
6.3.2.1.1. Wind
6.3.2.1.2. Biomass
6.3.2.1.3. Biofuel
6.3.2.1.4. Solar
6.3.2.1.5. Geothermal
6.3.3. Rest of
North America
6.3.3.1. Rest of North America Mining Renewable Energy Systems Market
Revenue (US$ Mn) and Forecasts, By Source
6.3.3.1.1. Wind
6.3.3.1.2. Biomass
6.3.3.1.3. Biofuel
6.3.3.1.4. Solar
6.3.3.1.5. Geothermal
6.4. Key
Segment for Channeling Investments
6.4.1. By
Country
6.4.2. By
Source
7. Europe Mining Renewable Energy Systems Market Analysis and
Forecasts, 2018 – 2026
7.1. Overview
7.1.1. Europe
Market Revenue (US$ Mn)
7.2. Europe
Mining Renewable Energy Systems Market Revenue (US$ Mn) and Forecasts, By
Source
7.2.1. Wind
7.2.2. Biomass
7.2.3. Biofuel
7.2.4. Solar
7.2.5. Geothermal
7.3. Europe
Mining Renewable Energy Systems Market Revenue (US$ Mn) and Forecasts, By
Country
7.3.1. France
7.3.1.1. France Mining Renewable Energy Systems Market Revenue (US$ Mn)
and Forecasts, By Source
7.3.1.1.1. Wind
7.3.1.1.2. Biomass
7.3.1.1.3. Biofuel
7.3.1.1.4. Solar
7.3.1.1.5. Geothermal
7.3.2. The UK
7.3.2.1. The UK Mining Renewable Energy Systems Market Revenue (US$ Mn)
and Forecasts, By Source
7.3.2.1.1. Wind
7.3.2.1.2. Biomass
7.3.2.1.3. Biofuel
7.3.2.1.4. Solar
7.3.2.1.5. Geothermal
7.3.3. Russia
7.3.3.1. Russia Mining Renewable Energy Systems Market Revenue (US$ Mn)
and Forecasts, By Source
7.3.3.1.1. Wind
7.3.3.1.2. Biomass
7.3.3.1.3. Biofuel
7.3.3.1.4. Solar
7.3.3.1.5. Geothermal
7.3.4. Rest of
Europe
7.3.4.1. Rest of Europe Mining Renewable Energy Systems Market Revenue
(US$ Mn) and Forecasts, By Source
7.3.4.1.1. Wind
7.3.4.1.2. Biomass
7.3.4.1.3. Biofuel
7.3.4.1.4. Solar
7.3.4.1.5. Geothermal
7.4. Key
Segment for Channeling Investments
7.4.1. By
Country
7.4.2. By
Source
8. Asia Pacific Mining
Renewable Energy Systems Market Analysis and Forecasts, 2018 – 2026
8.1. Overview
8.1.1. Asia
Pacific Market Revenue (US$ Mn)
8.2. Asia
Pacific Mining Renewable Energy Systems Market Revenue (US$ Mn) and Forecasts,
By Source
8.2.1. Wind
8.2.2. Biomass
8.2.3. Biofuel
8.2.4. Solar
8.2.5. Geothermal
8.3. Asia
Pacific Mining Renewable Energy Systems Market Revenue (US$ Mn) and Forecasts,
By Country
8.3.1. China
8.3.1.1. China Mining Renewable Energy Systems Market Revenue (US$ Mn)
and Forecasts, By Source
8.3.1.1.1. Wind
8.3.1.1.2. Biomass
8.3.1.1.3. Biofuel
8.3.1.1.4. Solar
8.3.1.1.5. Geothermal
8.3.2. Japan
8.3.2.1. Japan Mining Renewable Energy Systems Market Revenue (US$ Mn)
and Forecasts, By Source
8.3.2.1.1. Wind
8.3.2.1.2. Biomass
8.3.2.1.3. Biofuel
8.3.2.1.4. Solar
8.3.2.1.5.
Geothermal
8.3.3. Australia
8.3.3.1. Australia Mining Renewable Energy Systems Market Revenue (US$
Mn) and Forecasts, By Source
8.3.3.1.1. Wind
8.3.3.1.2. Biomass
8.3.3.1.3. Biofuel
8.3.3.1.4. Solar
8.3.3.1.5. Geothermal
8.3.4.
New Zealand
8.3.4.1. New Zealand Mining Renewable Energy Systems Market Revenue
(US$ Mn) and Forecasts, By Source
8.3.4.1.1. Wind
8.3.4.1.2. Biomass
8.3.4.1.3. Biofuel
8.3.4.1.4. Solar
8.3.4.1.5. Geothermal
8.3.5. India
8.3.5.1. India Mining Renewable Energy Systems Market Revenue (US$ Mn)
and Forecasts, By Source
8.3.5.1.1. Wind
8.3.5.1.2. Biomass
8.3.5.1.3. Biofuel
8.3.5.1.4. Solar
8.3.5.1.5. Geothermal
8.3.6. Southeast
Asia
8.3.6.1. Southeast Asia Mining Renewable Energy Systems Market Revenue
(US$ Mn) and Forecasts, By Source
8.3.6.1.1. Wind
8.3.6.1.2. Biomass
8.3.6.1.3. Biofuel
8.3.6.1.4. Solar
8.3.6.1.5. Geothermal
8.3.7. Rest of
Asia Pacific
8.3.7.1. Rest of Asia Pacific Mining Renewable Energy Systems Market
Revenue (US$ Mn) and Forecasts, By Source
8.3.7.1.1. Wind
8.3.7.1.2. Biomass
8.3.7.1.3. Biofuel
8.3.7.1.4. Solar
8.3.7.1.5. Geothermal
8.4. Key
Segment for Channeling Investments
8.4.1. By
Country
8.4.2. By
Source
9. Middle East Mining Renewable Energy Systems Market Analysis
and Forecasts, 2018 – 2026
9.1. Overview
9.1.1. Middle
East Market Revenue (US$ Mn)
9.2. Middle
East Mining Renewable Energy Systems Market Revenue (US$ Mn) and Forecasts, By
Source
9.2.1. Wind
9.2.2. Biomass
9.2.3. Biofuel
9.2.4. Solar
9.2.5. Geothermal
9.3. Middle
East Mining Renewable Energy Systems Market Revenue (US$ Mn) and Forecasts, By
Country
9.3.1. Egypt
9.3.1.1. Egypt Countries Mining Renewable Energy Systems Market Revenue
(US$ Mn) and Forecasts, By Source
9.3.1.1.1. Wind
9.3.1.1.2. Biomass
9.3.1.1.3. Biofuel
9.3.1.1.4. Solar
9.3.1.1.5. Geothermal
9.3.2. Saudi
Arabia
9.3.2.1. Saudi Arabia Mining Renewable Energy Systems Market Revenue
(US$ Mn) and Forecasts, By Source
9.3.2.1.1. Wind
9.3.2.1.2. Biomass
9.3.2.1.3. Biofuel
9.3.2.1.4. Solar
9.3.2.1.5.
Geothermal
9.3.3. UAE
9.3.3.1. UAE Mining Renewable Energy Systems Market Revenue (US$ Mn)
and Forecasts, By Source
9.3.3.1.1. Wind
9.3.3.1.2. Biomass
9.3.3.1.3. Biofuel
9.3.3.1.4. Solar
9.3.3.1.5. Geothermal
9.3.4. Bahrain
9.3.4.1. Bahrain Mining Renewable Energy Systems Market Revenue (US$
Mn) and Forecasts, By Source
9.3.4.1.1. Wind
9.3.4.1.2. Biomass
9.3.4.1.3. Biofuel
9.3.4.1.4. Solar
9.3.4.1.5. Geothermal
9.3.4.1.6.
9.3.5. Rest of
ME
9.3.5.1. Rest of ME Mining Renewable Energy Systems Market Revenue (US$
Mn) and Forecasts, By Source
9.3.5.1.1. Wind
9.3.5.1.2. Biomass
9.3.5.1.3. Biofuel
9.3.5.1.4. Solar
9.3.5.1.5. Geothermal
9.4. Key
Segment for Channeling Investments
9.4.1. By
Country
9.4.2. By Source
10. Africa Mining Renewable Energy Systems Market Analysis and
Forecasts, 2018 – 2026
10.1. Overview
10.1.1. Africa
Market Revenue (US$ Mn)
10.2. Africa
Mining Renewable Energy Systems Market Revenue (US$ Mn) and Forecasts, By
Source
10.2.1. Wind
10.2.2. Biomass
10.2.3. Biofuel
10.2.4. Solar
10.2.5. Geothermal
10.3. Africa
Mining Renewable Energy Systems Market Revenue (US$ Mn) and Forecasts, By
Country
10.3.1. Nigeria
10.3.1.1. Nigeria Mining Renewable Energy Systems Market Revenue (US$
Mn) and Forecasts, By Source
10.3.1.1.1. Wind
10.3.1.1.2. Biomass
10.3.1.1.3. Biofuel
10.3.1.1.4. Solar
10.3.1.1.5. Geothermal
10.3.2. South
Africa
10.3.2.1. South Africa Mining Renewable Energy Systems Market Revenue
(US$ Mn) and Forecasts, By Source
10.3.2.1.1. Wind
10.3.2.1.2. Biomass
10.3.2.1.3. Biofuel
10.3.2.1.4. Solar
10.3.2.1.5.
Geothermal
10.3.3. Kenya
10.3.3.1. Kenya Mining Renewable Energy Systems Market Revenue (US$ Mn)
and Forecasts, By Source
10.3.3.1.1. Wind
10.3.3.1.2. Biomass
10.3.3.1.3. Biofuel
10.3.3.1.4. Solar
10.3.3.1.5. Geothermal
10.3.4. Ethiopia
10.3.4.1. Ethiopia Mining Renewable Energy Systems Market Revenue (US$
Mn) and Forecasts, By Source
10.3.4.1.1. Wind
10.3.4.1.2. Biomass
10.3.4.1.3. Biofuel
10.3.4.1.4. Solar
10.3.4.1.5. Geothermal
10.3.5. Rest of
Africa
10.3.5.1. Rest of Africa Mining Renewable Energy Systems Market Revenue
(US$ Mn) and Forecasts, By Source
10.3.5.1.1. Wind
10.3.5.1.2. Biomass
10.3.5.1.3. Biofuel
10.3.5.1.4. Solar
10.3.5.1.5. Geothermal
10.4. Key
Segment for Channeling Investments
10.4.1. By
Country
10.4.2. By
Source
11. Latin America Mining Renewable Energy Systems Market Analysis
and Forecasts, 2018 – 2026
11.1. Overview
11.1.1. Latin
America Market Revenue (US$ Mn)
11.2. Latin
America Mining Renewable Energy Systems Market Revenue (US$ Mn) and Forecasts,
By Source
11.2.1. Wind
11.2.2. Biomass
11.2.3. Biofuel
11.2.4. Solar
11.2.5. Geothermal
11.3. Latin
America Mining Renewable Energy Systems Market Revenue (US$ Mn) and Forecasts,
By Country
11.3.1. Brazil
11.3.1.1. Brazil Mining Renewable Energy Systems Market Revenue (US$ Mn)
and Forecasts, By Source
11.3.1.1.1. Wind
11.3.1.1.2. Biomass
11.3.1.1.3. Biofuel
11.3.1.1.4. Solar
11.3.1.1.5. Geothermal
11.3.2. Rest of
Latin America
11.3.2.1. Rest of Latin America Mining Renewable Energy Systems Market
Revenue (US$ Mn) and Forecasts, By Source
11.3.2.1.1. Wind
11.3.2.1.2. Biomass
11.3.2.1.3. Biofuel
11.3.2.1.4. Solar
11.3.2.1.5. Geothermal
11.4. Key
Segment for Channeling Investments
11.4.1. By
Country
11.4.2. By
Source
12. Competitive Benchmarking
12.1. Player Positioning
Analysis
12.2. Global
Presence and Growth Strategies
13. Player Profiles
13.1. Barrick
Gold Corporation
13.1.1. Company
Details
13.1.2. Company
Overview
13.1.3. Product
Offerings
13.1.4. Key
Developments
13.1.5. Financial
Analysis
13.1.6. SWOT
Analysis
13.1.7. Business
Strategies
13.2. Black
& Veatch Holding Company
13.2.1. Company
Details
13.2.2. Company
Overview
13.2.3. Product
Offerings
13.2.4. Key
Developments
13.2.5. Financial
Analysis
13.2.6. SWOT
Analysis
13.2.7. Business
Strategies
13.3. Bluhm
Burton Engineering Pty Ltd (BBE)
13.3.1. Company
Details
13.3.2. Company
Overview
13.3.3. Product
Offerings
13.3.4. Key
Developments
13.3.5. Financial
Analysis
13.3.6. SWOT Analysis
13.3.7. Business
Strategies
13.4. Cambridge
Energy Partners
13.4.1. Company
Details
13.4.2. Company
Overview
13.4.3. Product
Offerings
13.4.4. Key
Developments
13.4.5. Financial
Analysis
13.4.6. SWOT
Analysis
13.4.7. Business
Strategies
13.5. Conergy
13.5.1. Company
Details
13.5.2. Company
Overview
13.5.3. Product
Offerings
13.5.4. Key
Developments
13.5.5. Financial
Analysis
13.5.6. SWOT
Analysis
13.5.7. Business
Strategies
13.6. CRONIMET
Mining Power Solutions GmbH
13.6.1. Company
Details
13.6.2. Company
Overview
13.6.3. Product
Offerings
13.6.4. Key
Developments
13.6.5. Financial
Analysis
13.6.6. SWOT
Analysis
13.6.7. Business
Strategies
13.7. Downer
Group
13.7.1. Company
Details
13.7.2. Company
Overview
13.7.3. Product
Offerings
13.7.4. Key
Developments
13.7.5. Financial
Analysis
13.7.6. SWOT
Analysis
13.7.7. Business
Strategies
13.8. Enel
Green Power
13.8.1. Company
Details
13.8.2. Company
Overview
13.8.3. Product
Offerings
13.8.4. Key
Developments
13.8.5. Financial
Analysis
13.8.6. SWOT
Analysis
13.8.7. Business
Strategies
13.9. General
Electric
13.9.1. Company
Details
13.9.2. Company
Overview
13.9.3. Product
Offerings
13.9.4. Key
Developments
13.9.5. Financial
Analysis
13.9.6. SWOT
Analysis
13.9.7. Business
Strategies
13.10. Hanwha
Group
13.10.1. Company
Details
13.10.2. Company
Overview
13.10.3. Product
Offerings
13.10.4. Key
Developments
13.10.5. Financial
Analysis
13.10.6. SWOT
Analysis
13.10.7. Business
Strategies
13.11. Juwi AG
13.11.1. Company
Details
13.11.2. Company
Overview
13.11.3. Product
Offerings
13.11.4. Key
Developments
13.11.5. Financial
Analysis
13.11.6. SWOT
Analysis
13.11.7. Business
Strategies
13.12. Newmont
Mining Corporation
13.12.1. Company
Details
13.12.2. Company
Overview
13.12.3. Product
Offerings
13.12.4. Key
Developments
13.12.5. Financial
Analysis
13.12.6. SWOT
Analysis
13.12.7. Business
Strategies
13.13. Nuance
Energy Group, Inc.
13.13.1. Company
Details
13.13.2. Company
Overview
13.13.3. Product
Offerings
13.13.4. Key
Developments
13.13.5. Financial
Analysis
13.13.6. SWOT
Analysis
13.13.7. Business
Strategies
13.14. Pöyry
PLC
13.14.1. Company
Details
13.14.2. Company
Overview
13.14.3. Product
Offerings
13.14.4. Key
Developments
13.14.5. Financial
Analysis
13.14.6. SWOT
Analysis
13.14.7. Business
Strategies
13.15. Siemens
AG
13.15.1. Company
Details
13.15.2. Company
Overview
13.15.3. Product
Offerings
13.15.4. Key
Developments
13.15.5. Financial
Analysis
13.15.6. SWOT
Analysis
13.15.7. Business
Strategies
13.16. SolarReserve,
LLC
13.16.1. Company
Details
13.16.2. Company
Overview
13.16.3. Product
Offerings
13.16.4. Key
Developments
13.16.5. Financial
Analysis
13.16.6. SWOT
Analysis
13.16.7. Business
Strategies
13.17. Vergnet
13.17.1. Company
Details
13.17.2. Company
Overview
13.17.3. Product
Offerings
13.17.4. Key
Developments
13.17.5. Financial
Analysis
13.17.6. SWOT
Analysis
13.17.7. Business
Strategies
13.18. ViZn
Energy
13.18.1. Company
Details
13.18.2. Company
Overview
13.18.3. Product
Offerings
13.18.4. Key
Developments
13.18.5. Financial
Analysis
13.18.6. SWOT
Analysis
13.18.7. Business
Strategies
Note: This ToC is
tentative and can be changed according to the research study conducted during
the course of report completion.
At Absolute Markets Insights, we are engaged in building both global as well as country specific reports. As a result, the approach taken for deriving the estimation and forecast for a specific country is a bit unique and different in comparison to the global research studies. In this case, we not only study the concerned market factors & trends prevailing in a particular country (from secondary research) but we also tend to calculate the actual market size & forecast from the revenue generated from the market participants involved in manufacturing or distributing the any concerned product. These companies can also be service providers. For analyzing any country specifically, we do consider the growth factors prevailing under the states/cities/county for the same. For instance, if we are analyzing an industry specific to United States, we primarily need to study about the states present under the same(where the product/service has the highest growth). Similar analysis will be followed by other countries. Our scope of the report changes with different markets.
Our research study is mainly implement through a mix of both secondary and primary research. Various sources such as industry magazines, trade journals, and government websites and trade associations are reviewed for gathering precise data. Primary interviews are conducted to validate the market size derived from secondary research. Industry experts, major manufacturers and distributors are contacted for further validation purpose on the current market penetration and growth trends.
Prominent participants in our primary research process include:
- Key Opinion Leaders namely the CEOs, CSOs, VPs, purchasing managers, amongst others
- Research and development participants, distributors/suppliers and subject matter experts
Secondary Research includes data extracted from paid data sources:
- Reuters
- Factiva
- Bloomberg
- One Source
- Hoovers
Research Methodology

Key Inclusions


