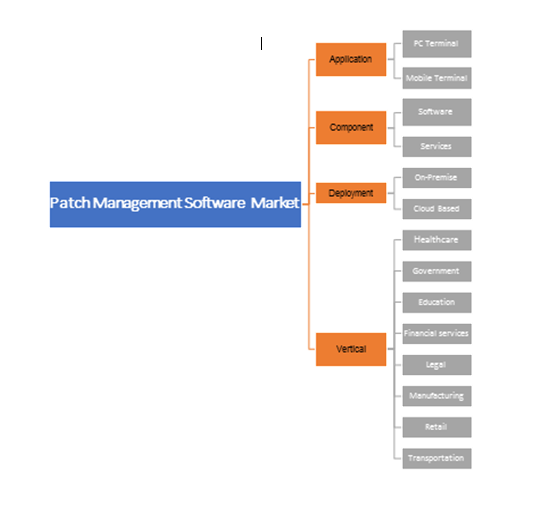
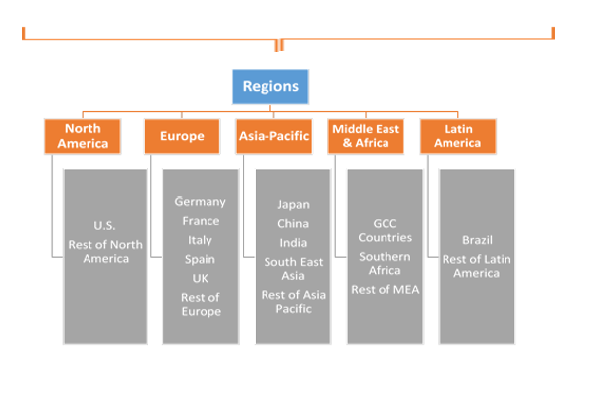
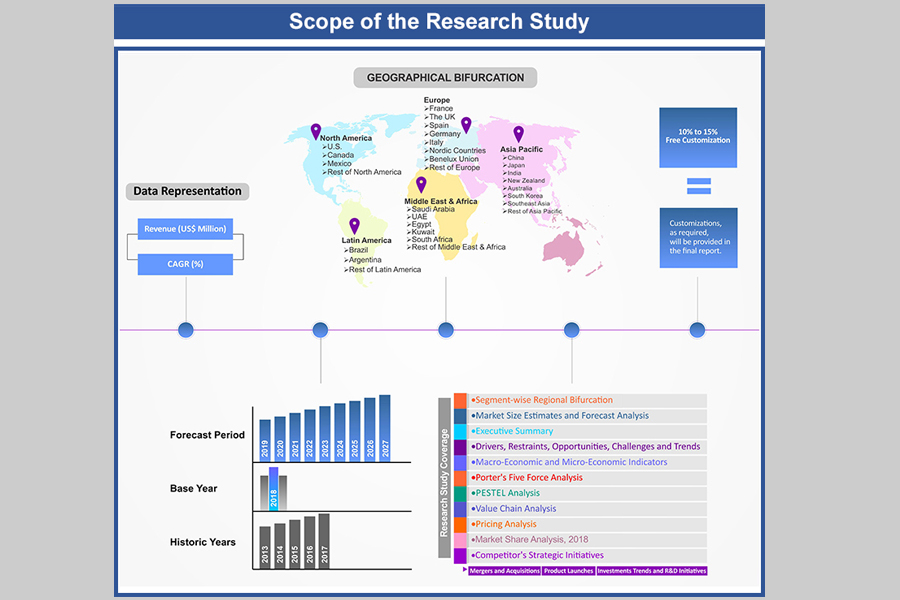
Patch Management Software Market by Component (Software, Services); by Deployment (On-Premise, Cloud Based); by Application (PC Terminal, Mobile Terminal); by Vertical (Healthcare, Government, Education, Financial services, Legal, Manufacturing, Retail, Transportation); by Regional Outlook (U.S., Rest of North America, France, UK, Germany, Spain, Italy, Rest of Europe, China, Japan, India, Southeast Asia, Rest of Asia Pacific, GCC Countries, Southern Africa, Rest of MEA, Brazil, Rest of Latin America) – Global Insights, Industry Trends, Price Trends, Growth, Size, Supply, Demand, Comparative Analysis, Competitive Market Share and Forecast, 2018-2026
Industry Trends
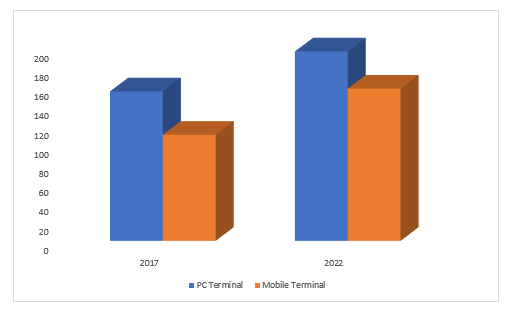
Patch management is a system for overseeing patches or upgrades for software applications and advancements. It helps to analyze existing software programs and detect issues related to security or other upgrades. Patch management component comprises of software and services that can often be integrated with other IT service management tools, such as help desks and tools for IT asset management. Efficient patch management is a task that is vital for ensuring the security and smooth function of corporate software. The best practices suggest that patch management should be automated through the use of specialized patch management solutions. The global patch management software market was valued at US$ 264.79 Mn in 2017 and is expected to reach US$ 353.97 Mn by 2022.
Patch Management Software Market (USD Million), By Application, 2017 & 2022
With new cloud hosting models and web-delivered systems, several patches would presently be applied to software solutions over the global IP network. Patch management deployment involves preparation, vulnerability detection, patch acquisition, risk analysis and patch testing. Patch deployment is done after following all these processes in order.
The major factors fueling the growth of the patch management software market are rising uptake of cloud-based solutions among organizations, maximization of return on this software’s, ability of software to integrate with big data analytics, connectivity of various applications and operations in a single database, and growing compliance & regulatory mandates. With the expansion in the adoption rate of the patch management software solutions among SMEs, the market is poised to grow at a substantial rate during the forecast period.
An entire patch management software solution provides a single platform and a robust content repository that can address patch management in an all-encompassing manner. A major drawback to these utilities is that they do not support heterogeneous environments with numerous platforms. The licensing costs of patch management software can be very expensive which is expected to critically impact the market growth in the future years.
Patch Management Software Market, By Deployment
The cloud deployment type is expected to grow at the highest CAGR during the forecast period. Cloud-based services are provided directly through the cloud-deployed network connectivity. They help in reducing the overall expenses, while giving exceptional adaptability and versatile access to the solutions. Organizations are deploying on-cloud patch management solutions to enhance the centralization, portability, collaboration of data, and reduction of data loss during the transit. The increased complexity of enterprise networks and the ever-present threat of malware poses a challenge for every network and system administrator as cybersecurity threats are increasing every day and becoming more sophisticated in nature. Along with the number of software installations to be patched, the speed at which vulnerabilities are being exploited has risen significantly.
Patch Management Software Market, By Region
North America is projected to have the largest share over the forecast period. With increasing patch management solutions for government and manufacturing sectors in the U.S. and Canada, the market is poised to grow at a quick pace in North America. The elements driving the development of the market in North America are technology advancements, strong intellectual property rights laws, and the demand for newer infrastructure.
Competitive Landscape
The report provides both, subjective and quantitative research of the market, as well as integrates worthy insights into the rational scenario and favored development methods adopted by the key contenders. The patch management software market report also offers extensive research on the key players in this market and detailed insights on the competitiveness of these players. The key business strategies such as M&A, affiliations, collaborations, and contracts adopted by the major players are also recognized and analyzed in the report. For each company, the report recognizes their manufacturing base, competitors, product type, application and specification, pricing, and gross margin.
Market participants include Automox, Autonomic Software, Cisco WebEx, Ecora Software, GFI Software, IBM Software, ivanti, Kaseya Limited, ManageEngine, NetSPI, Oracle, SolarWinds, Symantec, SysAid Technologies ltd., and Verismic Software, Inc. amongst others.
Patch Management Software Industry Background
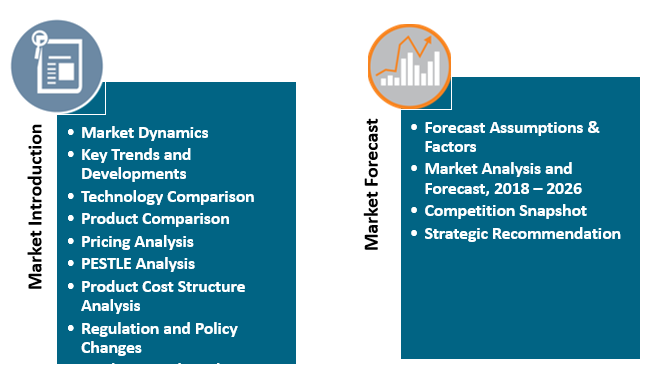
1. Introduction
1.1. Market Scope
1.2. Market Segmentation
1.3. Methodology
1.4. Assumptions
2. Patch Management Software Market Snapshot
3. Executive Summary: Patch Management Software Market
4. Qualitative Analysis: Patch Management Software Market
4.1. Introduction
4.1.1. Product Definition
4.1.2. Industry Development
4.2. Market Dynamics
4.2.1. Drivers
4.2.2. Restraints
4.2.3. Opportunities
4.3. Trends in Market
5. Global Patch Management Software Market Analysis and
Forecasts, 2018 – 2026
5.1. Overview
5.1.1. Global Market Revenue (US$ Mn) and Forecasts
5.2. Global Patch Management Software Market Revenue (US$ Mn) and
Forecasts, By Component
5.2.1. Software
5.2.1.1. Definition
5.2.1.2. Market Penetration
5.2.1.3. Market Revenue Expected to Increase by 2026
5.2.1.4. Compound Annual Growth Rate (CAGR)
5.2.2. Services
5.2.2.1. Definition
5.2.2.2. Market Penetration
5.2.2.3. Market Revenue Expected to Increase by 2026
5.2.2.4. Compound Annual Growth Rate (CAGR)
5.3. Key Segment for Channeling Investments
5.3.1. By Component
6. Global Patch Management Software Market Analysis and
Forecasts, 2018 – 2026
6.1. Overview
6.2. Global Patch Management Software Market Revenue (US$ Mn) and
Forecasts, By Application
6.2.1. PC Terminal
6.2.1.1. Definition
6.2.1.2. Market Penetration
6.2.1.3. Market Revenue Expected to Increase by 2026
6.2.1.4. Compound Annual Growth Rate (CAGR)
6.2.2. Mobile Terminal
6.2.2.1. Definition
6.2.2.2. Market Penetration
6.2.2.3. Market Revenue Expected to Increase by 2026
6.2.2.4. Compound Annual Growth Rate (CAGR)
6.3. Key Segment for Channeling Investments
6.3.1. By Application
7. Global Patch Management Software Market Analysis and
Forecasts, 2018 – 2026
7.1. Overview
7.2. Global Patch Management Software Market Revenue (US$ Mn) and
Forecasts, By Deployment
7.2.1. On-Premise
7.2.1.1. Definition
7.2.1.2. Market Penetration
7.2.1.3. Market Revenue Expected to Increase by 2026
7.2.1.4. Compound Annual Growth Rate (CAGR)
7.2.2. Cloud Based
7.2.2.1. Definition
7.2.2.2. Market Penetration
7.2.2.3. Market Revenue Expected to Increase by 2026
7.2.2.4. Compound Annual Growth Rate (CAGR)
7.3. Key Segment for Channeling Investments
7.3.1. By Deployment
8. Global Patch Management Software Market Analysis and
Forecasts, 2018 – 2026
8.1. Overview
8.2. Global Patch Management Software Market Revenue (US$ Mn) and
Forecasts, By Vertical
8.2.1. Healthcare
8.2.1.1. Definition
8.2.1.2. Market Penetration
8.2.1.3. Market Revenue Expected to Increase by 2026
8.2.1.4. Compound Annual Growth Rate (CAGR)
8.2.2. Government
8.2.2.1. Definition
8.2.2.2. Market Penetration
8.2.2.3. Market Revenue Expected to Increase by 2026
8.2.2.4. Compound Annual Growth Rate (CAGR)
8.2.3. Education
8.2.3.1. Definition
8.2.3.2. Market Penetration
8.2.3.3. Market Revenue Expected to Increase by 2026
8.2.3.4. Compound Annual Growth Rate (CAGR)
8.2.4. Financial services
8.2.4.1. Definition
8.2.4.2. Market Penetration
8.2.4.3. Market Revenue Expected to Increase by 2026
8.2.4.4. Compound Annual Growth Rate (CAGR)
8.2.5. Legal
8.2.5.1. Definition
8.2.5.2. Market Penetration
8.2.5.3. Market Revenue Expected to Increase by 2026
8.2.5.4. Compound Annual Growth Rate (CAGR)
8.2.6. Manufacturing
8.2.6.1. Definition
8.2.6.2. Market Penetration
8.2.6.3. Market Revenue Expected to Increase by 2026
8.2.6.4. Compound Annual Growth Rate (CAGR)
8.2.7. Retail
8.2.7.1. Definition
8.2.7.2. Market Penetration
8.2.7.3. Market Revenue Expected to Increase by 2026
8.2.7.4. Compound Annual Growth Rate (CAGR)
8.2.8. Transportation
8.2.8.1. Definition
8.2.8.2. Market Penetration
8.2.8.3. Market Revenue Expected to Increase by 2026
8.2.8.4. Compound Annual Growth Rate (CAGR)
8.3. Key Segment for Channeling Investments
8.3.1. By Vertical
9. North America Patch Management Software Market Analysis and Forecasts,
2018 – 2026
9.1. Overview
9.1.1. North America Market Revenue (US$ Mn)
9.2. North America Patch Management Software Market Revenue (US$
Mn) and Forecasts, By Component
9.2.1. Software
9.2.2. Services
9.3. North America Patch Management Software Market Revenue (US$
Mn) and Forecasts, By Application
9.3.1. PC Terminal
9.3.2. Mobile Terminal
9.4. North America Patch Management Software Market Revenue (US$
Mn) and Forecasts, By Deployment
9.4.1. On-Premise
9.4.2. Cloud Based
9.5. North America Patch Management Software Market Revenue (US$
Mn) and Forecasts, By Vertical
9.5.1. Healthcare
9.5.2. Government
9.5.3. Education
9.5.4. Financial services
9.5.5. Legal
9.5.6. Manufacturing
9.5.7. Retail
9.5.8. Transportation
9.6. North America Patch Management Software Market Revenue (US$
Mn) and Forecasts, By Country
9.6.1. U.S.
9.6.1.1. U.S. Patch Management Software Market Revenue (US$ Mn) and
Forecasts, By Component
9.6.1.1.1. Software
9.6.1.1.2. Services
9.6.1.2. U.S. Patch Management Software Market Revenue (US$ Mn) and
Forecasts, By Application
9.6.1.2.1. PC Terminal
9.6.1.2.2. Mobile Terminal
9.6.1.3. U.S. Patch Management Software Market Revenue (US$ Mn) and
Forecasts, By Deployment
9.6.1.3.1. On-Premise
9.6.1.3.2. Cloud Based
9.6.1.4. U.S. Patch Management Software Market Revenue (US$ Mn) and
Forecasts, By Vertical
9.6.1.4.1. Healthcare
9.6.1.4.2. Government
9.6.1.4.3. Education
9.6.1.4.4. Financial services
9.6.1.4.5. Legal
9.6.1.4.6. Manufacturing
9.6.1.4.7. Retail
9.6.1.4.8. Transportation
9.6.2. Rest of North America
9.6.2.1. Rest of North America Patch Management Software Market Revenue
(US$ Mn) and Forecasts, By Component
9.6.2.1.1. Software
9.6.2.1.2. Services
9.6.2.2. Rest of North America Patch Management Software Market Revenue
(US$ Mn) and Forecasts, By Application
9.6.2.2.1. PC Terminal
9.6.2.2.2. Mobile Terminal
9.6.2.3. Rest of North America Patch Management Software Market Revenue
(US$ Mn) and Forecasts, By Deployment
9.6.2.3.1. On-Premise
9.6.2.3.2. Cloud Based
9.6.2.4. Rest of North America Patch Management Software Market Revenue
(US$ Mn) and Forecasts, By Vertical
9.6.2.4.1. Healthcare
9.6.2.4.2. Government
9.6.2.4.3. Education
9.6.2.4.4. Financial services
9.6.2.4.5. Legal
9.6.2.4.6. Manufacturing
9.6.2.4.7. Retail
9.6.2.4.8. Transportation
9.7. Key Segment for Channeling Investments
9.7.1. By Country
9.7.2. By Component
9.7.3. By Application
9.7.4. By Deployment
9.7.5. By Vertical
10. Europe Patch Management Software Market Analysis and
Forecasts, 2018 – 2026
10.1. Overview
10.1.1. Europe Market Revenue (US$ Mn)
10.2. Europe Patch Management Software Market Revenue (US$ Mn) and
Forecasts, By Component
10.2.1. Software
10.2.2. Services
10.3. Europe Patch Management Software Market Revenue (US$ Mn) and
Forecasts, By Application
10.3.1. PC Terminal
10.3.2. Mobile Terminal
10.4. Europe Patch Management Software Market Revenue (US$ Mn) and
Forecasts, By Deployment
10.4.1. On-Premise
10.4.2. Cloud Based
10.5. Europe Patch Management Software Market Revenue (US$ Mn) and
Forecasts, By Vertical
10.5.1. Healthcare
10.5.2. Government
10.5.3. Education
10.5.4. Financial services
10.5.5. Legal
10.5.6. Manufacturing
10.5.7. Retail
10.5.8. Transportation
10.6. Europe Patch Management Software Market Revenue (US$ Mn) and
Forecasts, By Country
10.6.1. France
10.6.1.1. France Patch Management Software Market Revenue (US$ Mn) and
Forecasts, By Component
10.6.1.1.1. Software
10.6.1.1.2. Services
10.6.1.2. France Patch Management Software Market Revenue (US$ Mn) and
Forecasts, By Application
10.6.1.2.1. PC Terminal
10.6.1.2.2. Mobile Terminal
10.6.1.3. France Patch Management Software Market Revenue (US$ Mn) and
Forecasts, By Deployment
10.6.1.3.1. On-Premise
10.6.1.3.2. Cloud Based
10.6.1.4. France Patch Management Software Market Revenue (US$ Mn) and
Forecasts, By Vertical
10.6.1.4.1. Healthcare
10.6.1.4.2. Government
10.6.1.4.3. Education
10.6.1.4.4. Financial services
10.6.1.4.5. Legal
10.6.1.4.6. Manufacturing
10.6.1.4.7. Retail
10.6.1.4.8. Transportation
10.6.2. The UK
10.6.2.1. The UK Patch Management Software Market Revenue (US$ Mn) and
Forecasts, By Component
10.6.2.1.1. Software
10.6.2.1.2. Services
10.6.2.2. The UK Patch Management Software Market Revenue (US$ Mn) and
Forecasts, By Application
10.6.2.2.1. PC Terminal
10.6.2.2.2. Mobile Terminal
10.6.2.3. The UK Patch Management Software Market Revenue (US$ Mn) and
Forecasts, By Deployment
10.6.2.3.1. On-Premise
10.6.2.3.2. Cloud Based
10.6.2.4. The UK Patch Management Software Market Revenue (US$ Mn) and
Forecasts, By Vertical
10.6.2.4.1. Healthcare
10.6.2.4.2. Government
10.6.2.4.3. Education
10.6.2.4.4. Financial services
10.6.2.4.5. Legal
10.6.2.4.6. Manufacturing
10.6.2.4.7. Retail
10.6.2.4.8. Transportation
10.6.3. Spain
10.6.3.1. Spain Patch Management Software Market Revenue (US$ Mn) and
Forecasts, By Component
10.6.3.1.1. Software
10.6.3.1.2. Services
10.6.3.2. Spain Patch Management Software Market Revenue (US$ Mn) and
Forecasts, By Application
10.6.3.2.1. PC Terminal
10.6.3.2.2. Mobile Terminal
10.6.3.3. Spain Patch Management Software Market Revenue (US$ Mn) and
Forecasts, By Deployment
10.6.3.3.1. On-Premise
10.6.3.3.2. Cloud Based
10.6.3.4. Spain Patch Management Software Market Revenue (US$ Mn) and
Forecasts, By Vertical
10.6.3.4.1. Healthcare
10.6.3.4.2. Government
10.6.3.4.3. Education
10.6.3.4.4. Financial services
10.6.3.4.5. Legal
10.6.3.4.6. Manufacturing
10.6.3.4.7. Retail
10.6.3.4.8. Transportation
10.6.4. Germany
10.6.4.1. Germany Patch Management Software Market Revenue (US$ Mn) and
Forecasts, By Component
10.6.4.1.1. Software
10.6.4.1.2. Services
10.6.4.2. Germany Patch Management Software Market Revenue (US$ Mn) and
Forecasts, By Application
10.6.4.2.1. PC Terminal
10.6.4.2.2. Mobile Terminal
10.6.4.3. Germany Patch Management Software Market Revenue (US$ Mn) and
Forecasts, By Deployment
10.6.4.3.1. On-Premise
10.6.4.3.2. Cloud Based
10.6.4.4. Germany Patch Management Software Market Revenue (US$ Mn) and
Forecasts, By Vertical
10.6.4.4.1. Healthcare
10.6.4.4.2. Government
10.6.4.4.3. Education
10.6.4.4.4. Financial services
10.6.4.4.5. Legal
10.6.4.4.6. Manufacturing
10.6.4.4.7. Retail
10.6.4.4.8. Transportation
10.6.5. Italy
10.6.5.1. Italy Patch Management Software Market Revenue (US$ Mn) and
Forecasts, By Component
10.6.5.1.1. Software
10.6.5.1.2. Services
10.6.5.2. Italy Patch Management Software Market Revenue (US$ Mn) and
Forecasts, By Application
10.6.5.2.1. PC Terminal
10.6.5.2.2. Mobile Terminal
10.6.5.3. Italy Patch Management Software Market Revenue (US$ Mn) and
Forecasts, By Deployment
10.6.5.3.1. On-Premise
10.6.5.3.2. Cloud Based
10.6.5.4. Italy Patch Management Software Market Revenue (US$ Mn) and
Forecasts, By Vertical
10.6.5.4.1. Healthcare
10.6.5.4.2. Government
10.6.5.4.3. Education
10.6.5.4.4. Financial services
10.6.5.4.5. Legal
10.6.5.4.6. Manufacturing
10.6.5.4.7. Retail
10.6.5.4.8. Transportation
10.6.6. Rest of Europe
10.6.6.1. Rest of Europe Patch Management Software Market Revenue (US$
Mn) and Forecasts, By Component
10.6.6.1.1. Software
10.6.6.1.2. Services
10.6.6.2. Rest of Europe Patch Management Software Market Revenue (US$
Mn) and Forecasts, By Application
10.6.6.2.1. PC Terminal
10.6.6.2.2. Mobile Terminal
10.6.6.3. Rest of Europe Patch Management Software Market Revenue (US$
Mn) and Forecasts, By Deployment
10.6.6.3.1. On-Premise
10.6.6.3.2. Cloud Based
10.6.6.4. Rest of Europe Patch Management Software Market Revenue (US$
Mn) and Forecasts, By Vertical
10.6.6.4.1. Healthcare
10.6.6.4.2. Government
10.6.6.4.3. Education
10.6.6.4.4. Financial services
10.6.6.4.5. Legal
10.6.6.4.6. Manufacturing
10.6.6.4.7. Retail
10.6.6.4.8. Transportation
10.7. Key Segment for Channeling Investments
10.7.1. By Country
10.7.2. By Component
10.7.3. By Application
10.7.4. By Deployment
10.7.5. By Vertical
11. Asia Pacific Patch Management Software Market Analysis and
Forecasts, 2018 – 2026
11.1. Overview
11.1.1. Asia Pacific Market Revenue (US$ Mn)
11.2. Asia Pacific Patch Management Software Market Revenue (US$ Mn)
and Forecasts, By Component
11.2.1. Software
11.2.2. Services
11.3. Asia Pacific Patch Management Software Market Revenue (US$ Mn)
and Forecasts, By Application
11.3.1. PC Terminal
11.3.2. Mobile Terminal
11.4. Asia Pacific Patch Management Software Market Revenue (US$ Mn)
and Forecasts, By Deployment
11.4.1. On-Premise
11.4.2. Cloud Based
11.5. Asia Pacific Patch Management Software Market Revenue (US$ Mn)
and Forecasts, By Vertical
11.5.1. Healthcare
11.5.2. Government
11.5.3. Education
11.5.4. Financial services
11.5.5. Legal
11.5.6. Manufacturing
11.5.7. Retail
11.5.8. Transportation
11.6. Asia Pacific Patch Management Software Market Revenue (US$ Mn)
and Forecasts, By Country
11.6.1. China
11.6.1.1. China Patch Management Software Market Revenue (US$ Mn) and
Forecasts, By Component
11.6.1.1.1. Software
11.6.1.1.2. Services
11.6.1.2. China Patch Management Software Market Revenue (US$ Mn) and
Forecasts, By Application
11.6.1.2.1. PC Terminal
11.6.1.2.2. Mobile Terminal
11.6.1.3. China Patch Management Software Market Revenue (US$ Mn) and
Forecasts, By Deployment
11.6.1.3.1. On-Premise
11.6.1.3.2. Cloud Based
11.6.1.4. China Patch Management Software Market Revenue (US$ Mn) and
Forecasts, By Vertical
11.6.1.4.1. Healthcare
11.6.1.4.2. Government
11.6.1.4.3. Education
11.6.1.4.4. Financial services
11.6.1.4.5. Legal
11.6.1.4.6. Manufacturing
11.6.1.4.7. Retail
11.6.1.4.8. Transportation
11.6.2. Japan
11.6.2.1. Japan Patch Management Software Market Revenue (US$ Mn) and
Forecasts, By Component
11.6.2.1.1. Software
11.6.2.1.2. Services
11.6.2.2. Japan Patch Management Software Market Revenue (US$ Mn) and
Forecasts, By Application
11.6.2.2.1. PC Terminal
11.6.2.2.2. Mobile Terminal
11.6.2.3. Japan Patch Management Software Market Revenue (US$ Mn) and
Forecasts, By Deployment
11.6.2.3.1. On-Premise
11.6.2.3.2. Cloud Based
11.6.2.4. Japan Patch Management Software Market Revenue (US$ Mn) and
Forecasts, By Vertical
11.6.2.4.1. Healthcare
11.6.2.4.2. Government
11.6.2.4.3. Education
11.6.2.4.4. Financial services
11.6.2.4.5. Legal
11.6.2.4.6. Manufacturing
11.6.2.4.7. Retail
11.6.2.4.8. Transportation
11.6.3. India
11.6.3.1. India Patch Management Software Market Revenue (US$ Mn) and
Forecasts, By Component
11.6.3.1.1. Software
11.6.3.1.2. Services
11.6.3.2. India Patch Management Software Market Revenue (US$ Mn) and
Forecasts, By Application
11.6.3.2.1. PC Terminal
11.6.3.2.2. Mobile Terminal
11.6.3.3. India Patch Management Software Market Revenue (US$ Mn) and
Forecasts, By Deployment
11.6.3.3.1. On-Premise
11.6.3.3.2. Cloud Based
11.6.3.4. India Patch Management Software Market Revenue (US$ Mn) and
Forecasts, By Vertical
11.6.3.4.1. Healthcare
11.6.3.4.2. Government
11.6.3.4.3. Education
11.6.3.4.4. Financial services
11.6.3.4.5. Legal
11.6.3.4.6. Manufacturing
11.6.3.4.7. Retail
11.6.3.4.8. Transportation
11.6.4. Southeast Asia
11.6.4.1. Southeast Asia Patch Management Software Market Revenue (US$
Mn) and Forecasts, By Component
11.6.4.1.1. Software
11.6.4.1.2. Services
11.6.4.2. Southeast Asia Patch Management Software Market Revenue (US$
Mn) and Forecasts, By Application
11.6.4.2.1. PC Terminal
11.6.4.2.2. Mobile Terminal
11.6.4.3. Southeast Asia Patch Management Software Market Revenue (US$
Mn) and Forecasts, By Deployment
11.6.4.3.1. On-Premise
11.6.4.3.2. Cloud Based
11.6.4.4. Southeast Asia Patch Management Software Market Revenue (US$
Mn) and Forecasts, By Vertical
11.6.4.4.1. Healthcare
11.6.4.4.2. Government
11.6.4.4.3. Education
11.6.4.4.4. Financial services
11.6.4.4.5. Legal
11.6.4.4.6. Manufacturing
11.6.4.4.7. Retail
11.6.4.4.8. Transportation
11.6.5. Rest of Asia Pacific
11.6.5.1. Rest of Asia Pacific Patch Management Software Market Revenue
(US$ Mn) and Forecasts, By Component
11.6.5.1.1. Software
11.6.5.1.2. Services
11.6.5.2. Rest of Asia Pacific Patch Management Software Market Revenue
(US$ Mn) and Forecasts, By Application
11.6.5.2.1. PC Terminal
11.6.5.2.2. Mobile Terminal
11.6.5.3. Rest of Asia Pacific Patch Management Software Market Revenue
(US$ Mn) and Forecasts, By Deployment
11.6.5.3.1. On-Premise
11.6.5.3.2. Cloud Based
11.6.5.4. Rest of Asia Pacific Patch Management Software Market Revenue
(US$ Mn) and Forecasts, By Vertical
11.6.5.4.1. Healthcare
11.6.5.4.2. Government
11.6.5.4.3. Education
11.6.5.4.4. Financial services
11.6.5.4.5. Legal
11.6.5.4.6. Manufacturing
11.6.5.4.7. Retail
11.6.5.4.8. Transportation
11.7. Key Segment for Channeling Investments
11.7.1. By Country
11.7.2. By Component
11.7.3. By Application
11.7.4. By Deployment
11.7.5. By Vertical
12. Middle East and Africa Patch Management Software Market
Analysis and Forecasts, 2018 – 2026
12.1. Overview
12.1.1. Middle East and Africa Market Revenue (US$ Mn)
12.2. Middle East and Africa Patch Management Software Market
Revenue (US$ Mn) and Forecasts, By Component
12.2.1. Software
12.2.2. Services
12.3. Middle East and Africa Patch Management Software Market
Revenue (US$ Mn) and Forecasts, By Application
12.3.1. PC Terminal
12.3.2. Mobile Terminal
12.4. Middle East and Africa Patch Management Software Market
Revenue (US$ Mn) and Forecasts, By Deployment
12.4.1. On-Premise
12.4.2. Cloud Based
12.5. Middle East and Africa Patch Management Software Market
Revenue (US$ Mn) and Forecasts, By Vertical
12.5.1. Healthcare
12.5.2. Government
12.5.3. Education
12.5.4. Financial services
12.5.5. Legal
12.5.6. Manufacturing
12.5.7. Retail
12.5.8. Transportation
12.6. Middle East and Africa Patch Management Software Market
Revenue (US$ Mn) and Forecasts, By Country
12.6.1. GCC Countries
12.6.1.1. GCC Countries Patch Management Software Market Revenue (US$
Mn) and Forecasts, By Component
12.6.1.1.1. Software
12.6.1.1.2. Services
12.6.1.2. GCC Countries Patch Management Software Market Revenue (US$
Mn) and Forecasts, By Application
12.6.1.2.1. PC Terminal
12.6.1.2.2. Mobile Terminal
12.6.1.3. GCC Countries Patch Management Software Market Revenue (US$
Mn) and Forecasts, By Deployment
12.6.1.3.1. On-Premise
12.6.1.3.2. Cloud Based
12.6.1.4. GCC Countries Patch Management Software Market Revenue (US$
Mn) and Forecasts, By Vertical
12.6.1.4.1. Healthcare
12.6.1.4.2. Government
12.6.1.4.3. Education
12.6.1.4.4. Financial services
12.6.1.4.5. Legal
12.6.1.4.6. Manufacturing
12.6.1.4.7. Retail
12.6.1.4.8. Transportation
12.6.2. Southern Africa
12.6.2.1. Southern Africa Patch Management Software Market Revenue (US$
Mn) and Forecasts, By Component
12.6.2.1.1. Software
12.6.2.1.2. Services
12.6.2.2. Southern Africa Patch Management Software Market Revenue (US$
Mn) and Forecasts, By Application
12.6.2.2.1. PC Terminal
12.6.2.2.2. Mobile Terminal
12.6.2.3. Southern Africa Patch Management Software Market Revenue (US$
Mn) and Forecasts, By Deployment
12.6.2.3.1. On-Premise
12.6.2.3.2. Cloud Based
12.6.2.4. Southern Africa Patch Management Software Market Revenue (US$
Mn) and Forecasts, By Vertical
12.6.2.4.1. Healthcare
12.6.2.4.2. Government
12.6.2.4.3. Education
12.6.2.4.4. Financial services
12.6.2.4.5. Legal
12.6.2.4.6. Manufacturing
12.6.2.4.7. Retail
12.6.2.4.8. Transportation
12.6.3. Rest of MEA
12.6.3.1. Rest of MEA Patch Management Software Market Revenue (US$ Mn)
and Forecasts, By Component
12.6.3.1.1. Software
12.6.3.1.2. Services
12.6.3.2. Rest of MEA Patch Management Software Market Revenue (US$ Mn)
and Forecasts, By Application
12.6.3.2.1. PC Terminal
12.6.3.2.2. Mobile Terminal
12.6.3.3. Rest of MEA Patch Management Software Market Revenue (US$ Mn)
and Forecasts, By Deployment
12.6.3.3.1. On-Premise
12.6.3.3.2. Cloud Based
12.6.3.4. Rest of MEA Patch Management Software Market Revenue (US$ Mn)
and Forecasts, By Vertical
12.6.3.4.1. Healthcare
12.6.3.4.2. Government
12.6.3.4.3. Education
12.6.3.4.4. Financial services
12.6.3.4.5. Legal
12.6.3.4.6. Manufacturing
12.6.3.4.7. Retail
12.6.3.4.8. Transportation
12.7. Key Segment for Channeling Investments
12.7.1. By Country
12.7.2. By Component
12.7.3. By Application
12.7.4. By Deployment
12.7.5. By Vertical
13. Latin America Patch Management Software Market Analysis and
Forecasts, 2018 – 2026
13.1. Overview
13.1.1. Latin America Market Revenue (US$ Mn)
13.2. Latin America Patch Management Software Market Revenue (US$
Mn) and Forecasts, By Component
13.2.1. Software
13.2.2. Services
13.3. Latin America Patch Management Software Market Revenue (US$
Mn) and Forecasts, By Application
13.3.1. PC Terminal
13.3.2. Mobile Terminal
13.4. Latin America Patch Management Software Market Revenue (US$
Mn) and Forecasts, By Deployment
13.4.1. On-Premise
13.4.2. Cloud Based
13.5. Latin America Patch Management Software Market Revenue (US$
Mn) and Forecasts, By Vertical
13.5.1. Healthcare
13.5.2. Government
13.5.3. Education
13.5.4. Financial services
13.5.5. Legal
13.5.6. Manufacturing
13.5.7. Retail
13.5.8. Transportation
13.6. Latin America Patch Management Software Market Revenue (US$
Mn) and Forecasts, By Country
13.6.1. Brazil
13.6.1.1. Brazil Patch Management Software Market Revenue (US$ Mn) and
Forecasts, By Component
13.6.1.1.1. Software
13.6.1.1.2. Services
13.6.1.2. Brazil Patch Management Software Market Revenue (US$ Mn) and
Forecasts, By Application
13.6.1.2.1. PC Terminal
13.6.1.2.2. Mobile Terminal
13.6.1.3. Brazil Patch Management Software Market Revenue (US$ Mn) and
Forecasts, By Deployment
13.6.1.3.1. On-Premise
13.6.1.3.2. Cloud Based
13.6.1.4. Brazil Patch Management Software Market Revenue (US$ Mn) and
Forecasts, By Vertical
13.6.1.4.1. Healthcare
13.6.1.4.2. Government
13.6.1.4.3. Education
13.6.1.4.4. Financial services
13.6.1.4.5. Legal
13.6.1.4.6. Manufacturing
13.6.1.4.7. Retail
13.6.1.4.8. Transportation
13.6.2. Rest of Latin America
13.6.2.1. Rest of Latin America Patch Management Software Market Revenue
(US$ Mn) and Forecasts, By Component
13.6.2.1.1. Software
13.6.2.1.2. Services
13.6.2.2. Rest of Latin America Patch Management Software Market Revenue
(US$ Mn) and Forecasts, By Application
13.6.2.2.1. PC Terminal
13.6.2.2.2. Mobile Terminal
13.6.2.3. Rest of Latin America Patch Management Software Market Revenue
(US$ Mn) and Forecasts, By Deployment
13.6.2.3.1. On-Premise
13.6.2.3.2. Cloud Based
13.6.2.4. Rest of Latin America Patch Management Software Market Revenue
(US$ Mn) and Forecasts, By Vertical
13.6.2.4.1. Healthcare
13.6.2.4.2. Government
13.6.2.4.3. Education
13.6.2.4.4. Financial services
13.6.2.4.5. Legal
13.6.2.4.6. Manufacturing
13.6.2.4.7. Retail
13.6.2.4.8. Transportation
13.7. Key Segment for Channeling Investments
13.7.1. By Country
13.7.2. By Component
13.7.3. By Application
13.7.4. By Deployment
13.7.5. By Vertical
14. Competitive Benchmarking
14.1. Player Positioning Analysis
14.2. Global Presence and Growth Strategies
15. Player Profiles
15.1. Automox
15.1.1. Company Details
15.1.2. Company Overview
15.1.3. Product Offerings
15.1.4. Key Developments
15.1.5. Financial Analysis
15.1.6. SWOT Analysis
15.1.7. Business Strategies
15.2. Autonomic Software
15.2.1. Company Details
15.2.2. Company Overview
15.2.3. Product Offerings
15.2.4. Key Developments
15.2.5. Financial Analysis
15.2.6. SWOT Analysis
15.2.7. Business Strategies
15.3. Cisco WebEx
15.3.1. Company Details
15.3.2. Company Overview
15.3.3. Product Offerings
15.3.4. Key Developments
15.3.5. Financial Analysis
15.3.6. SWOT Analysis
15.3.7. Business Strategies
15.4. Ecora Software
15.4.1. Company Details
15.4.2. Company Overview
15.4.3. Product Offerings
15.4.4. Key Developments
15.4.5. Financial Analysis
15.4.6. SWOT Analysis
15.4.7. Business Strategies
15.5. GFI Software
15.5.1. Company Details
15.5.2. Company Overview
15.5.3. Product Offerings
15.5.4. Key Developments
15.5.5. Financial Analysis
15.5.6. SWOT Analysis
15.5.7. Business Strategies
15.6. IBM Software
15.6.1. Company Details
15.6.2. Company Overview
15.6.3. Product Offerings
15.6.4. Key Developments
15.6.5. Financial Analysis
15.6.6. SWOT Analysis
15.6.7. Business Strategies
15.7. ivanti
15.7.1. Company Details
15.7.2. Company Overview
15.7.3. Product Offerings
15.7.4. Key Developments
15.7.5. Financial Analysis
15.7.6. SWOT Analysis
15.7.7. Business Strategies
15.8. Kaseya Limited
15.8.1. Company Details
15.8.2. Company Overview
15.8.3. Product Offerings
15.8.4. Key Developments
15.8.5. Financial Analysis
15.8.6. SWOT Analysis
15.8.7. Business Strategies
15.9. ManageEngine
15.9.1. Company Details
15.9.2. Company Overview
15.9.3. Product Offerings
15.9.4. Key Developments
15.9.5. Financial Analysis
15.9.6. SWOT Analysis
15.9.7. Business Strategies
15.10. NetSPI
15.10.1.
Company Details
15.10.2.
Company Overview
15.10.3.
Product Offerings
15.10.4.
Key Developments
15.10.5.
Financial Analysis
15.10.6.
SWOT Analysis
15.10.7.
Business Strategies
15.11. Oracle
15.11.1.
Company Details
15.11.2.
Company Overview
15.11.3.
Product Offerings
15.11.4.
Key Developments
15.11.5.
Financial Analysis
15.11.6.
SWOT Analysis
15.11.7.
Business Strategies
15.12. SolarWinds
15.12.1.
Company Details
15.12.2.
Company Overview
15.12.3.
Product Offerings
15.12.4.
Key Developments
15.12.5.
Financial Analysis
15.12.6.
SWOT Analysis
15.12.7.
Business Strategies
15.13. Swipx
15.13.1.
Company Details
15.13.2.
Company Overview
15.13.3.
Product Offerings
15.13.4.
Key Developments
15.13.5.
Financial Analysis
15.13.6.
SWOT Analysis
15.13.7.
Business Strategies
15.14. Symantec
15.14.1.
Company Details
15.14.2.
Company Overview
15.14.3.
Product Offerings
15.14.4.
Key Developments
15.14.5.
Financial Analysis
15.14.6.
SWOT Analysis
15.14.7.
Business Strategies
15.15. SysAid Technologies ltd.
15.15.1.
Company Details
15.15.2.
Company Overview
15.15.3.
Product Offerings
15.15.4.
Key Developments
15.15.5.
Financial Analysis
15.15.6.
SWOT Analysis
15.15.7.
Business Strategies
15.16. Verismic Software, Inc
15.16.1. Company Details
15.16.2. Company Overview
15.16.3. Product Offerings
15.16.4. Key Developments
15.16.5. Financial Analysis
15.16.6. SWOT Analysis
15.16.7. Business Strategies
Note: This ToC is
tentative and can be changed according to the research study conducted during
the course of report completion.
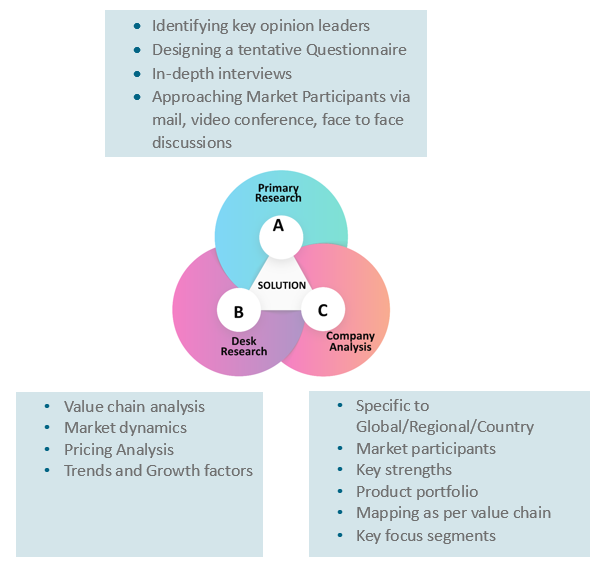
At Absolute Markets Insights, we are engaged in building both global as well as country specific reports. As a result, the approach taken for deriving the estimation and forecast for a specific country is a bit unique and different in comparison to the global research studies. In this case, we not only study the concerned market factors & trends prevailing in a particular country (from secondary research) but we also tend to calculate the actual market size & forecast from the revenue generated from the market participants involved in manufacturing or distributing the any concerned product. These companies can also be service providers. For analyzing any country specifically, we do consider the growth factors prevailing under the states/cities/county for the same. For instance, if we are analyzing an industry specific to United States, we primarily need to study about the states present under the same(where the product/service has the highest growth). Similar analysis will be followed by other countries. Our scope of the report changes with different markets.
Our research study is mainly implement through a mix of both secondary and primary research. Various sources such as industry magazines, trade journals, and government websites and trade associations are reviewed for gathering precise data. Primary interviews are conducted to validate the market size derived from secondary research. Industry experts, major manufacturers and distributors are contacted for further validation purpose on the current market penetration and growth trends.
Prominent participants in our primary research process include:
- Key Opinion Leaders namely the CEOs, CSOs, VPs, purchasing managers, amongst others
- Research and development participants, distributors/suppliers and subject matter experts
Secondary Research includes data extracted from paid data sources:
- Reuters
- Factiva
- Bloomberg
- One Source
- Hoovers
Research Methodology
Key Inclusions
Reach to us
Call us on
+91-74002-42424
Drop us an email at
sales@absolutemarketsinsights.com
Why Absolute Markets Insights?
An effective strategy is the entity that influences a business to stand out of the crowd. An organization with a phenomenal strategy for success dependably has the edge over the rivals in the market. It offers the organizations a head start in planning their strategy. Absolute Market Insights is the new initiation in the industry that will furnish you with the lead your business needs. Absolute Market Insights is the best destination for your business intelligence and analytical solutions; essentially because our qualitative and quantitative sources of information are competent to give one-stop solutions. We inventively combine qualitative and quantitative research in accurate proportions to have the best report, which not only gives the most recent insights but also assists you to grow.


