
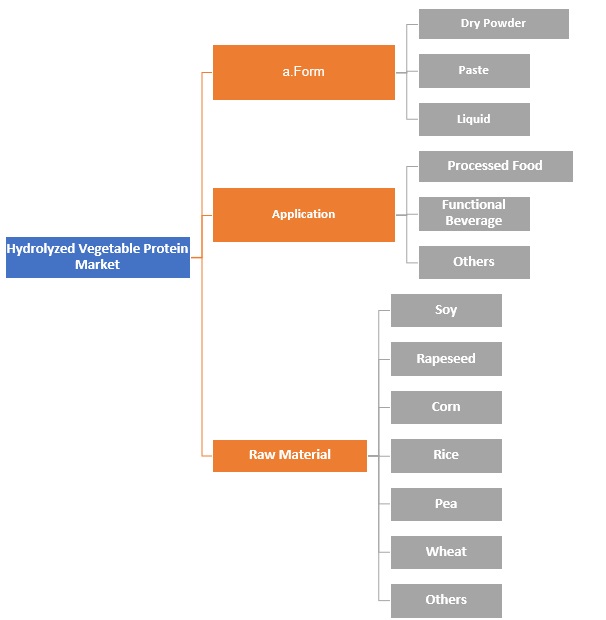
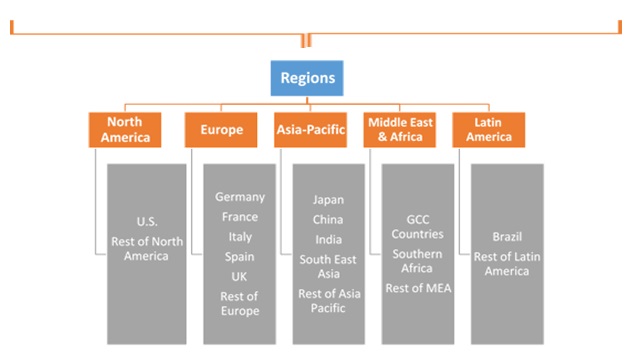
Hydrolyzed Vegetable Protein Market by Form Type (Dry Powder, Paste and Liquid); by Application (Processed Food, Functional Beverage and Others); by Raw Material (Soy, Rapeseed, Corn, Rice, Pea, Wheat and Others); by Regional outlook (U.S., Rest of North America, France, UK, Germany, Spain, Italy, Rest of Europe, China, Japan, India, Southeast Asia, Rest of Asia Pacific, GCC Countries, Southern Africa, Rest of MEA, Brazil, Rest of Latin America) – Global Insights, Growth, Size, Comparative Analysis, Trends and Forecast, 2018 - 2026
Industry Trends
Hydrolyzed vegetable protein are the food products developed by boiling wheat, soy or corn in hydrochloric acid, post which the solution is neutralized with sodium hydroxide. After the neutralization process, the acid breaks down into components of amino acids and protein in vegetables. One such component of amino acids left is glutamic acid. The resulting glutamic acid formed are predominantly familiar and adopted largely by the consumers in the form of sodium salt.
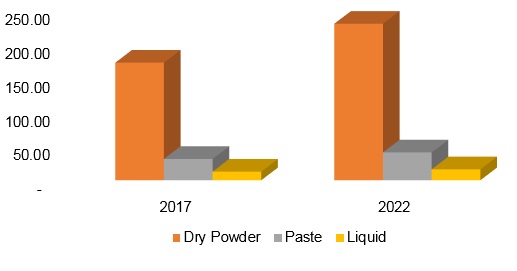
The hydrolyzed vegetable protein market, in terms of revenue, which was estimated at USD 216.34 million in 2017, is expected to reach USD 286.26 million in 2022.

Global Hydrolyzed Vegetable Protein Market, By Application, 2018 - 2026 (USD Million)
Hydrolyzed vegetable protein is considered as natural additives and organic. Owing to its properties, it is majorly used in processed foods such as snacks, burgers, soups, seasonings amongst other fillers to increase their flavors. However, food manufacturers often use the resulting glutamic acid formed from vegetable protein hydrolysis in the form of Monosodium glutamate (MSG). These MSG with improper quantity may prove fatal towards health. Owing to the improper dose of MSG, symptoms such as headache, sweating, nausea, heart palpitations, facial pressure and tightness and burning sensation around neck and face are often observed. During 2010, Food and Drug agency of United States investigated the HVP process of Las Vegas based Basic Food Flavors, Inc. a salmonella type of bacteria was found in the process which is known as Salmonella Tennessee. On contamination, this could create serious health problems particularly in kids. Hence, from the issue, HVP products which does not contain not more than 30 percent of MSG can be labeled as no MSG. However, owing to the rise in demand for processed and ready to eat meal has evidently led to rise of hydrolyzed vegetable protein market.
Hydrolyzed Vegetable Protein Market, By Product
On the basis of product type, the pea segment is expected to be the most attractive segment of the global market. Pea, being an organic source, represents both nutritional and commercial application owing to its gluten, cholesterol and lactose free properties. Hence, it is often used as smoothing and whipping agent for the meat, sausages and sauces.
Hydrolyzed Vegetable Protein Market, By Region
Asia Pacific region is expected to grow at the fastest rate in the global market owing to the increasing demand for savory flavors and convenience foods. HVP being a type of savory ingredient is not only used in ready to eat meal but also used as an application in food products for health-conscious consumers. Hence, it has triggered the development of the market in this region.
Competitive Landscape
The report provides both, subjective and quantitative research of the market, as well as integrates worthy insights into the rational scenario and favored development methods adopted by the key contenders. The report also offers extensive research on the key players in this market and detailed insights on the competitiveness of these players. The key business strategies such as M&A, affiliations, collaborations, and contracts adopted by the major players are also recognized and analyzed in the report. For each company, hydrolyzed vegetable protein market report recognizes their manufacturing base, competitors, product type, application and specification, pricing, and gross margin.
Some of the primary market participants are Ajinomoto Co., Inc., Kerry Group plc, Tate & Lyle, Inc., Koninklijke DSM N.V., Givaudan, Jones-Hamilton Co., Diana Group, Brolite Products Co. Inc., The Caremoli Group, Astron Chemicals S.A., Good Food, Inc., Levapan S.A., and McRitz International Corporation amongst others.
1. Introduction
1.1. Market Scope
1.2. Market Segmentation
1.3. Methodology
1.4. Assumptions
2. Hydrolyzed
Vegetable Protein Market Snapshot
3. Executive
Summary: Hydrolyzed Vegetable Protein Market
4. Qualitative
Analysis: Hydrolyzed Vegetable Protein Market
4.1. Introduction
4.1.1. Product Definition
4.1.2. Industry Development
4.2. Market Dynamics
4.2.1. Drivers
4.2.2. Restraints
4.2.3. Opportunities
4.3. Trends in Market
5. Global
Hydrolyzed Vegetable Protein Market Analysis and Forecasts, 2018 – 2026
5.1. Overview
5.1.1. Global Market Revenue (US$ Mn) and Forecasts
5.2. Global Hydrolyzed Vegetable Protein Market
Revenue (US$ Mn) and Forecasts, By Form
5.2.1. Dry Powder
5.2.1.1.
Definition
5.2.1.2.
Market
Penetration
5.2.1.3.
Market Revenue
Expected to Increase by 2026
5.2.1.4.
Compound Annual
Growth Rate (CAGR)
5.2.2. Paste
5.2.2.1.
Definition
5.2.2.2.
Market
Penetration
5.2.2.3.
Market Revenue
Expected to Increase by 2026
5.2.2.4.
Compound Annual
Growth Rate (CAGR)
5.2.3. Liquid
5.2.3.1.
Definition
5.2.3.2.
Market Penetration
5.2.3.3.
Market Revenue
Expected to Increase by 2026
5.2.3.4.
Compound Annual
Growth Rate (CAGR)
5.3. Key Segment for Channeling Investments
5.3.1. By Form
6. Global
Hydrolyzed Vegetable Protein Market Analysis and Forecasts, 2018 – 2026
6.1. Overview
6.2. Global Hydrolyzed Vegetable Protein Market
Revenue (US$ Mn) and Forecasts, By Application
6.2.1. Processed Food
6.2.1.1.
Definition
6.2.1.2.
Market
Penetration
6.2.1.3.
Market Revenue
Expected to Increase by 2026
6.2.1.4.
Compound Annual
Growth Rate (CAGR)
6.2.2. Functional Beverage
6.2.2.1.
Definition
6.2.2.2.
Market
Penetration
6.2.2.3.
Market Revenue
Expected to Increase by 2026
6.2.2.4.
Compound Annual
Growth Rate (CAGR)
6.2.3. Others
6.2.3.1.
Definition
6.2.3.2.
Market
Penetration
6.2.3.3.
Market Revenue
Expected to Increase by 2026
6.2.3.4.
Compound Annual
Growth Rate (CAGR)
6.3. Key Segment for Channeling Investments
6.3.1. By Application
7. Global
Hydrolyzed Vegetable Protein Market Analysis and Forecasts, 2018 – 2026
7.1. Overview
7.2. Global Hydrolyzed Vegetable Protein Market
Revenue (US$ Mn) and Forecasts, By Raw Material
7.2.1. Soy
7.2.1.1.
Definition
7.2.1.2.
Market
Penetration
7.2.1.3.
Market Revenue
Expected to Increase by 2026
7.2.1.4.
Compound Annual
Growth Rate (CAGR)
7.2.2. Rapeseed
7.2.2.1.
Definition
7.2.2.2.
Market
Penetration
7.2.2.3.
Market Revenue
Expected to Increase by 2026
7.2.2.4.
Compound Annual
Growth Rate (CAGR)
7.2.3. Corn
7.2.3.1.
Definition
7.2.3.2.
Market
Penetration
7.2.3.3.
Market Revenue
Expected to Increase by 2026
7.2.3.4.
Compound Annual
Growth Rate (CAGR)
7.2.4. Rice
7.2.4.1.
Definition
7.2.4.2.
Market
Penetration
7.2.4.3.
Market Revenue
Expected to Increase by 2026
7.2.4.4.
Compound Annual
Growth Rate (CAGR)
7.2.5. Pea
7.2.5.1.
Definition
7.2.5.2.
Market
Penetration
7.2.5.3.
Market Revenue
Expected to Increase by 2026
7.2.5.4.
Compound Annual
Growth Rate (CAGR)
7.2.6. Wheat
7.2.6.1.
Definition
7.2.6.2.
Market
Penetration
7.2.6.3.
Market Revenue Expected
to Increase by 2026
7.2.6.4.
Compound Annual
Growth Rate (CAGR)
7.2.7. Others
7.2.7.1.
Definition
7.2.7.2.
Market
Penetration
7.2.7.3.
Market Revenue
Expected to Increase by 2026
7.2.7.4.
Compound Annual
Growth Rate (CAGR)
7.3. Key Segment for Channeling Investments
7.3.1. By Raw Material
8. North
America Hydrolyzed Vegetable Protein Market Analysis and Forecasts, 2018 – 2026
8.1. Overview
8.1.1. North America Market Revenue (US$ Mn)
8.2. North America Hydrolyzed Vegetable Protein
Market Revenue (US$ Mn) and Forecasts, By Form
8.2.1. Dry Powder
8.2.2. Paste
8.2.3. Liquid
8.3. North America Market Revenue (US$ Mn) and
Forecasts, By Application
8.3.1. Processed Food
8.3.2. Functional Beverage
8.3.3. Others
8.4. North America Hydrolyzed Vegetable Protein
Market Revenue (US$ Mn) and Forecasts, By Raw Material
8.4.1. Soy
8.4.2. Rapeseed
8.4.3. Corn
8.4.4. Rice
8.4.5. Pea
8.4.6. Wheat
8.4.7. Others
8.5. North America Hydrolyzed Vegetable Protein
Market Revenue (US$ Mn) and Forecasts, By Country
8.5.1. U.S.
8.5.1.1.
U.S. Hydrolyzed
Vegetable Protein Market Revenue (US$ Mn) and Forecasts, By Form
8.5.1.1.1. Dry Powder
8.5.1.1.2. Paste
8.5.1.1.3. Liquid
8.5.1.2.
U.S. Market
Revenue (US$ Mn) and Forecasts, By Application
8.5.1.2.1. Processed Food
8.5.1.2.2. Functional Beverage
8.5.1.2.3. Others
8.5.1.3.
U.S. Hydrolyzed
Vegetable Protein Market Revenue (US$ Mn) and Forecasts, By Raw Material
8.5.1.3.1. Soy
8.5.1.3.2. Rapeseed
8.5.1.3.3. Corn
8.5.1.3.4. Rice
8.5.1.3.5. Pea
8.5.1.3.6. Wheat
8.5.1.3.7. Others
8.5.2. Rest of North America
8.5.2.1.
Rest of North
America Hydrolyzed Vegetable Protein Market Revenue (US$ Mn) and Forecasts, By
Form
8.5.2.1.1. Dry Powder
8.5.2.1.2. Paste
8.5.2.1.3. Liquid
8.5.2.2.
Rest of North
America Market Revenue (US$ Mn) and Forecasts, By Application
8.5.2.2.1. Processed Food
8.5.2.2.2. Functional Beverage
8.5.2.2.3. Others
8.5.2.3.
Rest of North
America Hydrolyzed Vegetable Protein Market Revenue (US$ Mn) and Forecasts, By Raw
Material
8.5.2.3.1. Soy
8.5.2.3.2. Rapeseed
8.5.2.3.3. Corn
8.5.2.3.4. Rice
8.5.2.3.5. Pea
8.5.2.3.6. Wheat
8.5.2.3.7. Others
8.6. Key Segment for Channeling Investments
8.6.1. By Country
8.6.2. By Form
8.6.3. By Application
8.6.4. By Raw Material
9. Europe
Hydrolyzed Vegetable Protein Market Analysis and Forecasts, 2018 – 2026
9.1. Overview
9.1.1. Europe Market Revenue (US$ Mn)
9.2. Europe Hydrolyzed Vegetable Protein Market
Revenue (US$ Mn) and Forecasts, By Form
9.2.1. Dry Powder
9.2.2. Paste
9.2.3. Liquid
9.3. Europe Market Revenue (US$ Mn) and Forecasts, By
Application
9.3.1. Processed Food
9.3.2. Functional Beverage
9.3.3. Others
9.4. Europe Hydrolyzed Vegetable Protein Market
Revenue (US$ Mn) and Forecasts, By Raw Material
9.4.1. Soy
9.4.2. Rapeseed
9.4.3. Corn
9.4.4. Rice
9.4.5. Pea
9.4.6. Wheat
9.4.7. Others
9.5. Europe Hydrolyzed Vegetable Protein Market
Revenue (US$ Mn) and Forecasts, By Country
9.5.1. France
9.5.1.1.
France Hydrolyzed
Vegetable Protein Market Revenue (US$ Mn) and Forecasts, By Form
9.5.1.1.1. Dry Powder
9.5.1.1.2. Paste
9.5.1.1.3. Liquid
9.5.1.2.
France Market
Revenue (US$ Mn) and Forecasts, By Application
9.5.1.2.1. Processed Food
9.5.1.2.2. Functional Beverage
9.5.1.2.3. Others
9.5.1.3.
France Hydrolyzed
Vegetable Protein Market Revenue (US$ Mn) and Forecasts, By Raw Material
9.5.1.3.1. Soy
9.5.1.3.2. Rapeseed
9.5.1.3.3. Corn
9.5.1.3.4. Rice
9.5.1.3.5. Pea
9.5.1.3.6. Wheat
9.5.1.3.7. Others
9.5.2. The UK
9.5.2.1.
The UK Hydrolyzed
Vegetable Protein Market Revenue (US$ Mn) and Forecasts, By Form
9.5.2.1.1. Dry Powder
9.5.2.1.2. Paste
9.5.2.1.3. Liquid
9.5.2.2.
The UK Market
Revenue (US$ Mn) and Forecasts, By Application
9.5.2.2.1. Processed Food
9.5.2.2.2. Functional Beverage
9.5.2.2.3. Others
9.5.2.3.
The UK Hydrolyzed
Vegetable Protein Market Revenue (US$ Mn) and Forecasts, By Raw Material
9.5.2.3.1. Soy
9.5.2.3.2. Rapeseed
9.5.2.3.3. Corn
9.5.2.3.4. Rice
9.5.2.3.5. Pea
9.5.2.3.6. Wheat
9.5.2.3.7. Others
9.5.3. Spain
9.5.3.1.
Spain Hydrolyzed
Vegetable Protein Market Revenue (US$ Mn) and Forecasts, By Form
9.5.3.1.1. Dry Powder
9.5.3.1.2. Paste
9.5.3.1.3. Liquid
9.5.3.2.
Spain Market
Revenue (US$ Mn) and Forecasts, By Application
9.5.3.2.1. Processed Food
9.5.3.2.2. Functional Beverage
9.5.3.2.3. Others
9.5.3.3.
Spain Hydrolyzed
Vegetable Protein Market Revenue (US$ Mn) and Forecasts, By Raw Material
9.5.3.3.1. Soy
9.5.3.3.2. Rapeseed
9.5.3.3.3. Corn
9.5.3.3.4. Rice
9.5.3.3.5. Pea
9.5.3.3.6. Wheat
9.5.3.3.7. Others
9.5.4. Germany
9.5.4.1.
Germany
Hydrolyzed Vegetable Protein Market Revenue (US$ Mn) and Forecasts, By Form
9.5.4.1.1. Dry Powder
9.5.4.1.2. Paste
9.5.4.1.3. Liquid
9.5.4.2.
Germany Market
Revenue (US$ Mn) and Forecasts, By Application
9.5.4.2.1. Processed Food
9.5.4.2.2. Functional Beverage
9.5.4.2.3. Others
9.5.4.3.
Germany
Hydrolyzed Vegetable Protein Market Revenue (US$ Mn) and Forecasts, By Raw
Material
9.5.4.3.1. Soy
9.5.4.3.2. Rapeseed
9.5.4.3.3. Corn
9.5.4.3.4. Rice
9.5.4.3.5. Pea
9.5.4.3.6. Wheat
9.5.4.3.7. Others
9.5.5. Italy
9.5.5.1.
Italy Hydrolyzed
Vegetable Protein Market Revenue (US$ Mn) and Forecasts, By Form
9.5.5.1.1. Dry Powder
9.5.5.1.2. Paste
9.5.5.1.3. Liquid
9.5.5.2.
Italy Market
Revenue (US$ Mn) and Forecasts, By Application
9.5.5.2.1. Processed Food
9.5.5.2.2. Functional Beverage
9.5.5.2.3. Others
9.5.5.3.
Italy Hydrolyzed
Vegetable Protein Market Revenue (US$ Mn) and Forecasts, By Raw Material
9.5.5.3.1. Soy
9.5.5.3.2. Rapeseed
9.5.5.3.3. Corn
9.5.5.3.4. Rice
9.5.5.3.5. Pea
9.5.5.3.6. Wheat
9.5.5.3.7. Others
9.5.6. Rest of Europe
9.5.6.1.
Rest of Europe
Hydrolyzed Vegetable Protein Market Revenue (US$ Mn) and Forecasts, By Form
9.5.6.1.1. Dry Powder
9.5.6.1.2. Paste
9.5.6.1.3. Liquid
9.5.6.2.
Rest of Europe
Market Revenue (US$ Mn) and Forecasts, By Application
9.5.6.2.1. Processed Food
9.5.6.2.2. Functional Beverage
9.5.6.2.3. Others
9.5.6.3.
Rest of Europe
Hydrolyzed Vegetable Protein Market Revenue (US$ Mn) and Forecasts, By Raw
Material
9.5.6.3.1. Soy
9.5.6.3.2. Rapeseed
9.5.6.3.3. Corn
9.5.6.3.4. Rice
9.5.6.3.5. Pea
9.5.6.3.6. Wheat
9.5.6.3.7. Others
9.6. Key Segment for Channeling Investments
9.6.1. By Country
9.6.2. By Form
9.6.3. By Application
9.6.4. By Raw Material
10. Asia Pacific
Hydrolyzed Vegetable Protein Market Analysis and Forecasts, 2018 – 2026
10.1. Overview
10.1.1. Asia Pacific Market Revenue (US$ Mn)
10.2. Asia Pacific Hydrolyzed Vegetable Protein Market
Revenue (US$ Mn) and Forecasts, By Form
10.2.1. Dry Powder
10.2.2. Paste
10.2.3. Liquid
10.3. Asia Pacific Market Revenue (US$ Mn) and
Forecasts, By Application
10.3.1. Processed Food
10.3.2. Functional Beverage
10.3.3. Others
10.4. Asia Pacific Hydrolyzed Vegetable Protein Market
Revenue (US$ Mn) and Forecasts, By Raw Material
10.4.1. Soy
10.4.2. Rapeseed
10.4.3. Corn
10.4.4. Rice
10.4.5. Pea
10.4.6. Wheat
10.4.7. Others
10.5. Asia Pacific Market Revenue (US$ Mn) and
Forecasts, By Country
10.5.1. China
10.5.1.1.
China Hydrolyzed
Vegetable Protein Market Revenue (US$ Mn) and Forecasts, By Form
10.5.1.1.1. Dry Powder
10.5.1.1.2. Paste
10.5.1.1.3. Liquid
10.5.1.2.
China Market
Revenue (US$ Mn) and Forecasts, By Application
10.5.1.2.1. Processed Food
10.5.1.2.2. Functional Beverage
10.5.1.2.3. Others
10.5.1.3.
China Hydrolyzed
Vegetable Protein Market Revenue (US$ Mn) and Forecasts, By Raw Material
10.5.1.3.1. Soy
10.5.1.3.2. Rapeseed
10.5.1.3.3. Corn
10.5.1.3.4. Rice
10.5.1.3.5. Pea
10.5.1.3.6. Wheat
10.5.1.3.7. Others
10.5.2. Japan
10.5.2.1.
Japan Hydrolyzed Vegetable
Protein Market Revenue (US$ Mn) and Forecasts, By Form
10.5.2.1.1. Dry Powder
10.5.2.1.2. Paste
10.5.2.1.3. Liquid
10.5.2.2.
Japan Market
Revenue (US$ Mn) and Forecasts, By Application
10.5.2.2.1. Processed Food
10.5.2.2.2. Functional Beverage
10.5.2.2.3. Others
10.5.2.3.
Japan Hydrolyzed
Vegetable Protein Market Revenue (US$ Mn) and Forecasts, By Raw Material
10.5.2.3.1. Soy
10.5.2.3.2. Rapeseed
10.5.2.3.3. Corn
10.5.2.3.4. Rice
10.5.2.3.5. Pea
10.5.2.3.6. Wheat
10.5.2.3.7. Others
10.5.3. India
10.5.3.1.
India Hydrolyzed
Vegetable Protein Market Revenue (US$ Mn) and Forecasts, By Form
10.5.3.1.1. Dry Powder
10.5.3.1.2. Paste
10.5.3.1.3. Liquid
10.5.3.2.
India Market
Revenue (US$ Mn) and Forecasts, By Application
10.5.3.2.1. Processed Food
10.5.3.2.2. Functional Beverage
10.5.3.2.3. Others
10.5.3.3.
India Hydrolyzed
Vegetable Protein Market Revenue (US$ Mn) and Forecasts, By Raw Material
10.5.3.3.1. Soy
10.5.3.3.2. Rapeseed
10.5.3.3.3. Corn
10.5.3.3.4. Rice
10.5.3.3.5. Pea
10.5.3.3.6. Wheat
10.5.3.3.7. Others
10.5.4. Southeast Asia
10.5.4.1.
Southeast Asia
Hydrolyzed Vegetable Protein Market Revenue (US$ Mn) and Forecasts, By Form
10.5.4.1.1. Dry Powder
10.5.4.1.2. Paste
10.5.4.1.3. Liquid
10.5.4.2.
Southeast Asia
Market Revenue (US$ Mn) and Forecasts, By Application
10.5.4.2.1. Processed Food
10.5.4.2.2. Functional Beverage
10.5.4.2.3. Others
10.5.4.3.
Southeast Asia
Hydrolyzed Vegetable Protein Market Revenue (US$ Mn) and Forecasts, By Raw
Material
10.5.4.3.1. Soy
10.5.4.3.2. Rapeseed
10.5.4.3.3. Corn
10.5.4.3.4. Rice
10.5.4.3.5. Pea
10.5.4.3.6. Wheat
10.5.4.3.7. Others
10.5.5. Rest of Asia Pacific
10.5.5.1.
Rest of Asia
Pacific Hydrolyzed Vegetable Protein Market Revenue (US$ Mn) and Forecasts, By
Form
10.5.5.1.1. Dry Powder
10.5.5.1.2. Paste
10.5.5.1.3. Liquid
10.5.5.2.
Rest of Asia
Pacific Market Revenue (US$ Mn) and Forecasts, By Application
10.5.5.2.1. Processed Food
10.5.5.2.2. Functional Beverage
10.5.5.2.3. Others
10.5.5.3.
Rest of Asia
Pacific Hydrolyzed Vegetable Protein Market Revenue (US$ Mn) and Forecasts, By
Raw Material
10.5.5.3.1. Soy
10.5.5.3.2. Rapeseed
10.5.5.3.3. Corn
10.5.5.3.4. Rice
10.5.5.3.5. Pea
10.5.5.3.6. Wheat
10.5.5.3.7. Others
10.6. Key Segment for Channeling Investments
10.6.1. By Country
10.6.2. By Form
10.6.3. By Application
10.6.4. By Raw Material
11. Middle East
and Africa Hydrolyzed Vegetable Protein Market Analysis and Forecasts, 2018 –
2026
11.1. Overview
11.1.1. Middle East and Africa Market Revenue (US$ Mn)
11.2. Middle East and Africa Hydrolyzed Vegetable
Protein Market Revenue (US$ Mn) and Forecasts, By Form
11.2.1. Dry Powder
11.2.2. Paste
11.2.3. Liquid
11.3. Middle East and Africa Market Revenue (US$ Mn)
and Forecasts, By Application
11.3.1. Processed Food
11.3.2. Functional Beverage
11.3.3. Others
11.4. Middle East and Africa Hydrolyzed Vegetable
Protein Market Revenue (US$ Mn) and Forecasts, By Raw Material
11.4.1. Soy
11.4.2. Rapeseed
11.4.3. Corn
11.4.4. Rice
11.4.5. Pea
11.4.6. Wheat
11.4.7. Others
11.5. Middle East and Africa Hydrolyzed Vegetable
Protein Market Revenue (US$ Mn) and Forecasts, By Country
11.5.1. GCC Countries
11.5.1.1.
GCC Countries
Hydrolyzed Vegetable Protein Market Revenue (US$ Mn) and Forecasts, By Form
11.5.1.1.1. Dry Powder
11.5.1.1.2. Paste
11.5.1.1.3. Liquid
11.5.1.2.
GCC Countries
Market Revenue (US$ Mn) and Forecasts, By Application
11.5.1.2.1. Processed Food
11.5.1.2.2. Functional Beverage
11.5.1.2.3. Others
11.5.1.3.
GCC Countries
Hydrolyzed Vegetable Protein Market Revenue (US$ Mn) and Forecasts, By Raw
Material
11.5.1.3.1. Soy
11.5.1.3.2. Rapeseed
11.5.1.3.3. Corn
11.5.1.3.4. Rice
11.5.1.3.5. Pea
11.5.1.3.6. Wheat
11.5.1.3.7. Others
11.5.2. Southern Africa
11.5.2.1.
Southern Africa
Hydrolyzed Vegetable Protein Market Revenue (US$ Mn) and Forecasts, By Form
11.5.2.1.1. Dry Powder
11.5.2.1.2. Paste
11.5.2.1.3. Liquid
11.5.2.2.
Southern Africa
Market Revenue (US$ Mn) and Forecasts, By Application
11.5.2.2.1. Processed Food
11.5.2.2.2. Functional Beverage
11.5.2.2.3. Others
11.5.2.3.
Southern Africa
Hydrolyzed Vegetable Protein Market Revenue (US$ Mn) and Forecasts, By Raw
Material
11.5.2.3.1. Soy
11.5.2.3.2. Rapeseed
11.5.2.3.3. Corn
11.5.2.3.4. Rice
11.5.2.3.5. Pea
11.5.2.3.6. Wheat
11.5.2.3.7. Others
11.5.3. Rest of MEA
11.5.3.1.
Rest of MEA
Hydrolyzed Vegetable Protein Market Revenue (US$ Mn) and Forecasts, By Form
11.5.3.1.1. Dry Powder
11.5.3.1.2. Paste
11.5.3.1.3. Liquid
11.5.3.2.
Rest of MEA
Market Revenue (US$ Mn) and Forecasts, By Application
11.5.3.2.1. Processed Food
11.5.3.2.2. Functional Beverage
11.5.3.2.3. Others
11.5.3.3.
Rest of MEA
Hydrolyzed Vegetable Protein Market Revenue (US$ Mn) and Forecasts, By Raw
Material
11.5.3.3.1. Soy
11.5.3.3.2. Rapeseed
11.5.3.3.3. Corn
11.5.3.3.4. Rice
11.5.3.3.5. Pea
11.5.3.3.6. Wheat
11.5.3.3.7. Others
11.6. Key Segment for Channeling Investments
11.6.1. By Country
11.6.2. By Form
11.6.3. By Application
11.6.4. By Raw Material
12. Latin
America Hydrolyzed Vegetable Protein Market Analysis and Forecasts, 2018 – 2026
12.1. Overview
12.1.1. Latin America Market Revenue (US$ Mn)
12.2. Latin America Market Revenue (US$ Mn) and
Forecasts, By Form
12.2.1. Dry Powder
12.2.2. Paste
12.2.3. Liquid
12.3. Latin America Hydrolyzed Vegetable Protein
Market Revenue (US$ Mn) and Forecasts, By Application
12.3.1. Processed Food
12.3.2. Functional Beverage
12.3.3. Others
12.4. Latin America Hydrolyzed Vegetable Protein
Market Revenue (US$ Mn) and Forecasts, By Raw Material
12.4.1. Soy
12.4.2. Rapeseed
12.4.3. Corn
12.4.4. Rice
12.4.5. Pea
12.4.6. Wheat
12.4.7. Others
12.5. Latin America Hydrolyzed Vegetable Protein
Market Revenue (US$ Mn) and Forecasts, By Country
12.5.1. Brazil
12.5.1.1.
Brazil Hydrolyzed
Vegetable Protein Market Revenue (US$ Mn) and Forecasts, By Form
12.5.1.1.1. Dry Powder
12.5.1.1.2. Paste
12.5.1.1.3. Liquid
12.5.1.2.
Brazil Market
Revenue (US$ Mn) and Forecasts, By Application
12.5.1.2.1. Processed Food
12.5.1.2.2. Functional Beverage
12.5.1.2.3. Others
12.5.1.3.
Brazil Hydrolyzed
Vegetable Protein Market Revenue (US$ Mn) and Forecasts, By Raw Material
12.5.1.3.1. Soy
12.5.1.3.2. Rapeseed
12.5.1.3.3. Corn
12.5.1.3.4. Rice
12.5.1.3.5. Pea
12.5.1.3.6. Wheat
12.5.1.3.7. Others
12.5.2. Rest of Latin America
12.5.2.1.
Rest of Latin
America Hydrolyzed Vegetable Protein Market Revenue (US$ Mn) and Forecasts, By
Form
12.5.2.1.1. Dry Powder
12.5.2.1.2. Paste
12.5.2.1.3. Liquid
12.5.2.2.
Rest of Latin
America Hydrolyzed Vegetable Protein Market Revenue (US$ Mn) and Forecasts, By
Application
12.5.2.2.1. Processed Food
12.5.2.2.2. Functional Beverage
12.5.2.2.3. Others
12.5.2.3.
Rest of Latin
America Hydrolyzed Vegetable Protein Market Revenue (US$ Mn) and Forecasts, By
Raw Material
12.5.2.3.1. Soy
12.5.2.3.2. Rapeseed
12.5.2.3.3. Corn
12.5.2.3.4. Rice
12.5.2.3.5. Pea
12.5.2.3.6. Wheat
12.5.2.3.7. Others
12.6. Key Segment for Channeling Investments
12.6.1. By Country
12.6.2. By Form
12.6.3. By Application
12.6.4. By Raw Material
13. Competitive
Benchmarking
13.1. Player Positioning Analysis
13.2. Global Presence and Growth Strategies
14. Player
Profiles
14.1. Ajinomoto Co., Inc.
14.1.1. Company Details
14.1.2. Company Overview
14.1.3. Product Offerings
14.1.4. Key Developments
14.1.5. Financial Analysis
14.1.6. SWOT Analysis
14.1.7. Business Strategies
14.2. Astron Chemicals S.A.
14.2.1. Company Details
14.2.2. Company Overview
14.2.3. Product Offerings
14.2.4. Key Developments
14.2.5. Financial Analysis
14.2.6. SWOT Analysis
14.2.7. Business Strategies
14.3. Brolite Products Co. Inc.
14.3.1. Company Details
14.3.2. Company Overview
14.3.3. Product Offerings
14.3.4. Key Developments
14.3.5. Financial Analysis
14.3.6. SWOT Analysis
14.3.7. Business Strategies
14.4. Diana Group
14.4.1. Company Details
14.4.2. Company Overview
14.4.3. Product Offerings
14.4.4. Key Developments
14.4.5. Financial Analysis
14.4.6. SWOT Analysis
14.4.7. Business Strategies
14.5. Givaudan
14.5.1. Company Details
14.5.2. Company Overview
14.5.3. Product Offerings
14.5.4. Key Developments
14.5.5. Financial Analysis
14.5.6. SWOT Analysis
14.5.7. Business Strategies
14.6. Good Food, Inc.
14.6.1. Company Details
14.6.2. Company Overview
14.6.3. Product Offerings
14.6.4. Key Developments
14.6.5. Financial Analysis
14.6.6. SWOT Analysis
14.6.7. Business Strategies
14.7. Jones-Hamilton Co.
14.7.1. Company Details
14.7.2. Company Overview
14.7.3. Product Offerings
14.7.4. Key Developments
14.7.5. Financial Analysis
14.7.6. SWOT Analysis
14.7.7. Business Strategies
14.8. Kerry Group plc
14.8.1. Company Details
14.8.2. Company Overview
14.8.3. Product Offerings
14.8.4. Key Developments
14.8.5. Financial Analysis
14.8.6. SWOT Analysis
14.8.7. Business Strategies
14.9. Koninklijke DSM N.V.
14.9.1. Company Details
14.9.2. Company Overview
14.9.3. Product Offerings
14.9.4. Key Developments
14.9.5. Financial Analysis
14.9.6. SWOT Analysis
14.9.7. Business Strategies
14.10. Levapan S.A.
14.10.1. Company Details
14.10.2. Company Overview
14.10.3. Product Offerings
14.10.4. Key Developments
14.10.5. Financial Analysis
14.10.6. SWOT Analysis
14.10.7. Business Strategies
14.11. McRitz International Corporation
14.11.1. Company Details
14.11.2. Company Overview
14.11.3. Product Offerings
14.11.4. Key Developments
14.11.5. Financial Analysis
14.11.6. SWOT Analysis
14.11.7. Business Strategies
14.12. Tate & Lyle, Inc.
14.12.1. Company Details
14.12.2. Company Overview
14.12.3. Product Offerings
14.12.4. Key Developments
14.12.5. Financial Analysis
14.12.6. SWOT Analysis
14.12.7. Business Strategies
14.13. The Caremoli Group
14.13.1. Company Details
14.13.2. Company Overview
14.13.3. Product Offerings
14.13.4. Key Developments
14.13.5. Financial Analysis
14.13.6. SWOT Analysis
14.13.7. Business Strategies
Note: This ToC is tentative
and can be changed according to the research study conducted during the course
of report completion.
At Absolute Markets Insights, we are engaged in building both global as well as country specific reports. As a result, the approach taken for deriving the estimation and forecast for a specific country is a bit unique and different in comparison to the global research studies. In this case, we not only study the concerned market factors & trends prevailing in a particular country (from secondary research) but we also tend to calculate the actual market size & forecast from the revenue generated from the market participants involved in manufacturing or distributing the any concerned product. These companies can also be service providers. For analyzing any country specifically, we do consider the growth factors prevailing under the states/cities/county for the same. For instance, if we are analyzing an industry specific to United States, we primarily need to study about the states present under the same(where the product/service has the highest growth). Similar analysis will be followed by other countries. Our scope of the report changes with different markets.
Our research study is mainly implement through a mix of both secondary and primary research. Various sources such as industry magazines, trade journals, and government websites and trade associations are reviewed for gathering precise data. Primary interviews are conducted to validate the market size derived from secondary research. Industry experts, major manufacturers and distributors are contacted for further validation purpose on the current market penetration and growth trends.
Prominent participants in our primary research process include:
- Key Opinion Leaders namely the CEOs, CSOs, VPs, purchasing managers, amongst others
- Research and development participants, distributors/suppliers and subject matter experts
Secondary Research includes data extracted from paid data sources:
- Reuters
- Factiva
- Bloomberg
- One Source
- Hoovers
Research Methodology

Key Inclusions


