
Smart Building Market by Automation Type (Energy Management, Intelligent Security Systems, Infrastructure Management, Network & Communication Management); by Services (Professional Services, Managed Services); by Application (Commercial, Residential, Government, Airports, Hospitals, Institutes, Manufacturing & Industrial Facilities, Others); by Regional Outlook (U.S., Rest of North America, France, UK, Germany, Spain, Italy, Rest of Europe, China, Japan, India, Southeast Asia, Rest of Asia Pacific, GCC Countries, Southern Africa, Rest of MEA, Brazil, Rest of Latin America) – Global Insights, Industry Trends, Price Trends, Growth, Size, Supply, Demand, Comparative Analysis, Competitive Market Share and Forecast, 2018-2026
Industry Trends
A smart building is any type of infrastructure that makes use of automation in order to control the operations of the building which can be anything such as ventilation, lighting, heating, air conditioning, security, and much more. To do all this actuators, sensors, and microchips are used within the building to collect the data and accordingly manage the services and functions. The major factor driving the growth of market is the globally increasing concerns about the energy consumption. The utilization of energy is increasing at a rapid rate thus making it necessary to find efficient ways to utilize it wisely. The Global Smart Building Market was valued at US$ 7702.2 Mn in 2017 and is expected to reach US$ 33,547.3 Mn by 2022.
North America Smart Building Size, By services, 2017 & 2022, (US$ Million)
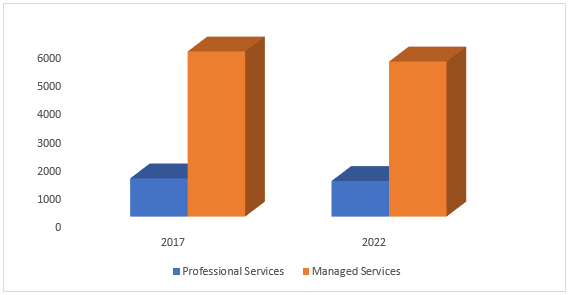
As building energy management system enables to monitor and control the energy needs, it has been observed that there will be an increasing demand for the energy management systems in the smart building market owing to its benefit of utilizing the energy in an efficient way.
Smart Building Market, By Automation Type
The future of the construction lies in smart buildings. A smart building incorporates real-time systems for managing the functioning of a building via a single interface. Smart buildings rely heavily on the use of hardware and software that can not only make the building operate more efficiently, but also make improve its life-span by tracking problems and alerting residents of the same. This is enabled via the installation of building automation systems (BAS) also known as infrastructure management system and networking technologies. BAS is the largest segment within the smart buildings market, by automation type.
Smart Building Market, By Region
Among U.S. region Mid Atlantic is one of the major emerging markets globally and it accounted for major market share of smart building due to the adoption of energy management as well as security solutions, which has led to the growth of the smart building market across regions. Moreover, smart buildings also enable automation system integration with an enterprise system that improves the productivity of a facility or an organization. This further assists in monitoring the demand and consumption in U.S. in the forecast period 2018-2026.
Competitive Landscape
The smart building market report provides both, qualitative and quantitative research of the market, as well as strategic insights along with developments that are being adopted by the key contenders. The report also offers extensive research on the key players in this market and detailed insights on the competitiveness of these players. The key business strategies such as mergers and acquisition (M&A), affiliations, collaborations, and contracts adopted by the major players are also recognized and analyzed in the report. For each company, the report recognizes their competitors, service type, application and specification, pricing, and gross margin.
Market Participants include Siemens AG, ABB Group, Cisco Systems, Schneider SE, United Technologies Corporation, Building, Inc., Honeywell International, IBM Corporation, Johnson controls, Delta Controls, among others.

Global Smart Building Market Industry Background
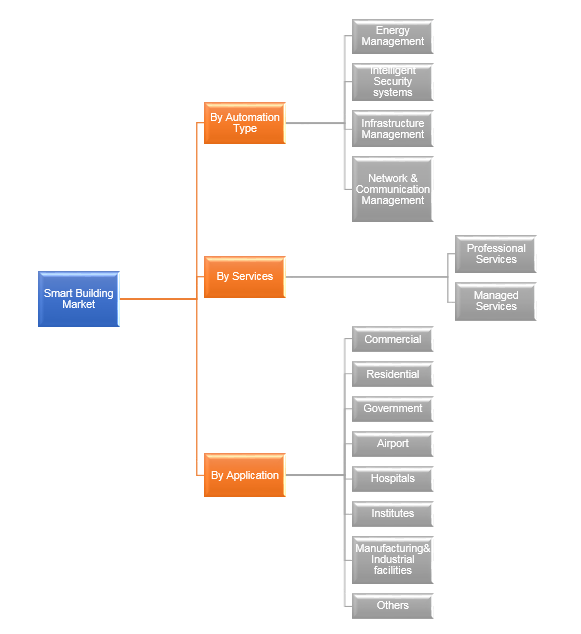
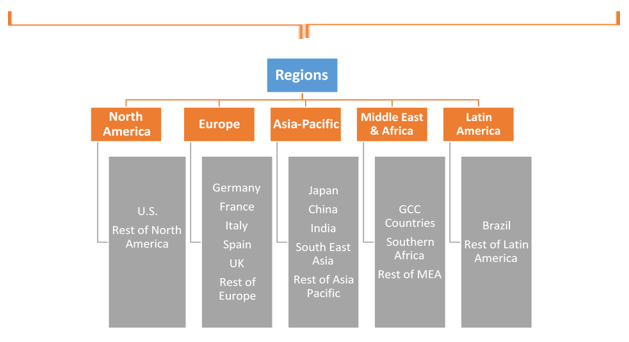
Table of Contents
1. Introduction
1.1. Market Scope
1.2. Market Segmentation
1.3. Methodology
1.4. Assumptions
2. Smart Building Market Snapshot
3. Executive Summary: Smart Building Market
4. Qualitative Analysis: Smart Building Market
4.1. Introduction
4.1.1. Product Definition
4.1.2. Industry Development
4.2. Market Dynamics
4.2.1. Drivers
4.2.2. Restraints
4.2.3. Opportunities
4.3. Trends in Market
5. Global Smart Building Market Analysis and Forecasts, 2018 –
2026
5.1. Overview
5.1.1. Global Market Revenue (US$ Mn) and Forecasts
5.2. Global Smart Building Market Revenue (US$ Mn) and Forecasts,
By Automation Type
5.2.1. Energy Management
5.2.1.1. Definition
5.2.1.2. Market Penetration
5.2.1.3. Market Revenue Expected to Increase by 2026
5.2.1.4. Compound Annual Growth Rate (CAGR)
5.2.2. Intelligent security systems
5.2.2.1. Definition
5.2.2.2. Market Penetration
5.2.2.3. Market Revenue Expected to Increase by 2026
5.2.2.4. Compound Annual Growth Rate (CAGR)
5.2.3. Infrastructure Management
5.2.3.1. Definition
5.2.3.2. Market Penetration
5.2.3.3. Market Revenue Expected to Increase by 2026
5.2.3.4. Compound Annual Growth Rate (CAGR)
5.2.4. Network and Communication Management
5.2.4.1. Definition
5.2.4.2. Market Penetration
5.2.4.3. Market Revenue Expected to Increase by 2026
5.2.4.4. Compound Annual Growth Rate (CAGR)
5.3. Key Segment for Channeling Investments
5.3.1. By Automation Type
6. Global Smart Building Market Analysis and Forecasts, 2018 –
2026
6.1. Overview
6.2. Global Smart Building Market Revenue (US$ Mn) and Forecasts,
By Services
6.2.1. Professional Services
6.2.1.1. Definition
6.2.1.2. Market Penetration
6.2.1.3. Market Revenue Expected to Increase by 2026
6.2.1.4. Compound Annual Growth Rate (CAGR)
6.2.2. Managed Services
6.2.2.1. Definition
6.2.2.2. Market Penetration
6.2.2.3. Market Revenue Expected to Increase by 2026
6.2.2.4. Compound Annual Growth Rate (CAGR)
6.3. Key Segment for Channeling Investments
6.3.1. By Services
7. Global Smart Building Market Analysis and Forecasts, 2018 –
2026
7.1. Overview
7.2. Global Smart Building Market Revenue (US$ Mn) and Forecasts,
By Application
7.2.1. Commercial
7.2.1.1. Definition
7.2.1.2. Market Penetration
7.2.1.3. Market Revenue Expected to Increase by 2026
7.2.1.4. Compound Annual Growth Rate (CAGR)
7.2.2. Residential
7.2.2.1. Definition
7.2.2.2. Market Penetration
7.2.2.3. Market Revenue Expected to Increase by 2026
7.2.2.4. Compound Annual Growth Rate (CAGR)
7.2.3. Government
7.2.3.1. Definition
7.2.3.2. Market Penetration
7.2.3.3. Market Revenue Expected to Increase by 2026
7.2.3.4. Compound Annual Growth Rate (CAGR)
7.2.4. Airports
7.2.4.1. Definition
7.2.4.2. Market Penetration
7.2.4.3. Market Revenue Expected to Increase by 2026
7.2.4.4. Compound Annual Growth Rate (CAGR)
7.2.5. Hospitals
7.2.5.1. Definition
7.2.5.2. Market Penetration
7.2.5.3. Market Revenue Expected to Increase by 2026
7.2.5.4. Compound Annual Growth Rate (CAGR)
7.2.6. Institutes
7.2.6.1. Definition
7.2.6.2. Market Penetration
7.2.6.3. Market Revenue Expected to Increase by 2026
7.2.6.4. Compound Annual Growth Rate (CAGR)
7.2.7. Manufacturing and Industrial Facilities
7.2.7.1. Definition
7.2.7.2. Market Penetration
7.2.7.3. Market Revenue Expected to Increase by 2026
7.2.7.4. Compound Annual Growth Rate (CAGR)
7.2.8. Others
7.2.8.1. Definition
7.2.8.2. Market Penetration
7.2.8.3. Market Revenue Expected to Increase by 2026
7.2.8.4. Compound Annual Growth Rate (CAGR)
7.3. Key Segment for Channeling Investments
7.3.1. By Application
8. North America Smart Building Market Analysis and Forecasts,
2018 – 2026
8.1. Overview
8.1.1. North America Market Revenue (US$ Mn)
8.2. North America Smart Building Market Revenue (US$ Mn) and
Forecasts, By Automation Type
8.2.1. Energy Management
8.2.2. Intelligent security systems
8.2.3. Infrastructure Management
8.2.4. Network and Communication Management
8.3. North America Smart Building Market Revenue (US$ Mn) and
Forecasts, By Services
8.3.1. Professional Services
8.3.2. Managed Services
8.4. North America Smart Building Market Revenue (US$ Mn) and
Forecasts, By Application
8.4.1. Commercial
8.4.2. Residential
8.4.3. Government
8.4.4. Airports
8.4.5. Hospitals
8.4.6. Institutes
8.4.7. Manufacturing and Industrial Facilities
8.4.8. Others
8.5. North America Market Revenue (US$ Mn) and Forecasts, By
Country
8.5.1. U.S.
8.5.1.1. U.S. Smart Building Market Revenue (US$ Mn) and Forecasts, By
Automation Type
8.5.1.1.1. Energy Management
8.5.1.1.2. Intelligent security systems
8.5.1.1.3. Infrastructure Management
8.5.1.1.4. Network and Communication Management
8.5.1.2. U.S. Market Revenue (US$ Mn) and Forecasts, By Services
8.5.1.2.1. Professional Services
8.5.1.2.2. Managed Services
8.5.1.3. U.S. Smart Building Market Revenue (US$ Mn) and Forecasts, By
Application
8.5.1.3.1. Commercial
8.5.1.3.2. Residential
8.5.1.3.3. Government
8.5.1.3.4. Airports
8.5.1.3.5. Hospitals
8.5.1.3.6. Institutes
8.5.1.3.7. Manufacturing and Industrial Facilities
8.5.1.3.8. Others
8.5.2. Rest of North America
8.5.2.1. Rest of North America Smart Building Market Revenue (US$ Mn)
and Forecasts, By Automation Type
8.5.2.1.1. Energy Management
8.5.2.1.2. Intelligent security systems
8.5.2.1.3. Infrastructure Management
8.5.2.1.4. Network and Communication Management
8.5.2.2. Rest of North America Smart Building Market Revenue (US$ Mn)
and Forecasts, By Services
8.5.2.2.1. Professional Services
8.5.2.2.2. Managed Services
8.5.2.3. Rest of North America Smart Building Market Revenue (US$ Mn)
and Forecasts, By Application
8.5.2.3.1. Commercial
8.5.2.3.2. Residential
8.5.2.3.3. Government
8.5.2.3.4. Airports
8.5.2.3.5. Hospitals
8.5.2.3.6. Institutes
8.5.2.3.7. Manufacturing and Industrial Facilities
8.5.2.3.8. Others
8.6. Key Segment for Channeling Investments
8.6.1. By Country
8.6.2. By Automation Type
8.6.3. By Services
8.6.4. By Application
9. Europe Smart Building Market Analysis and Forecasts, 2018 –
2026
9.1. Overview
9.1.1. Europe Market Revenue (US$ Mn)
9.2. Europe Smart Building Market Revenue (US$ Mn) and Forecasts,
By Automation Type
9.2.1. Energy Management
9.2.2. Intelligent security systems
9.2.3. Infrastructure Management
9.2.4. Network and Communication Management
9.3. Europe Market Revenue (US$ Mn) and Forecasts, By Services
9.3.1. Professional Services
9.3.2. Managed Services
9.4. Europe Smart Building Market Revenue (US$ Mn) and Forecasts,
By Application
9.4.1. Commercial
9.4.2. Residential
9.4.3. Government
9.4.4. Airports
9.4.5. Hospitals
9.4.6. Institutes
9.4.7. Manufacturing and Industrial Facilities
9.4.8. Others
9.5. Europe Smart Building Market Revenue (US$ Mn) and Forecasts,
By Country
9.5.1. France
9.5.1.1. France Smart Building Market Revenue (US$ Mn) and Forecasts,
By Automation Type
9.5.1.1.1. Energy Management
9.5.1.1.2. Intelligent security systems
9.5.1.1.3. Infrastructure Management
9.5.1.1.4. Network and Communication Management
9.5.1.2. France Market Revenue (US$ Mn) and Forecasts, By Services
9.5.1.2.1. Professional Services
9.5.1.2.2. Managed Services
9.5.1.3. France Smart Building Market Revenue (US$ Mn) and Forecasts,
By Application
9.5.1.3.1. Commercial
9.5.1.3.2. Residential
9.5.1.3.3. Government
9.5.1.3.4. Airports
9.5.1.3.5. Hospitals
9.5.1.3.6. Institutes
9.5.1.3.7. Manufacturing and Industrial Facilities
9.5.1.3.8. Others
9.5.2. The UK
9.5.2.1. The UK Smart Building Market Revenue (US$ Mn) and Forecasts,
By Automation Type
9.5.2.1.1. Energy Management
9.5.2.1.2. Intelligent security systems
9.5.2.1.3. Infrastructure Management
9.5.2.1.4. Network and Communication Management
9.5.2.2. The UK Smart Building Market Revenue (US$ Mn) and Forecasts,
By Services
9.5.2.2.1. Professional Services
9.5.2.2.2. Managed Services
9.5.2.3. The UK Smart Building Market Revenue (US$ Mn) and Forecasts,
By Application
9.5.2.3.1. Commercial
9.5.2.3.2. Residential
9.5.2.3.3. Government
9.5.2.3.4. Airports
9.5.2.3.5. Hospitals
9.5.2.3.6. Institutes
9.5.2.3.7. Manufacturing and Industrial Facilities
9.5.2.3.8. Others
9.5.3. Spain
9.5.3.1. Spain Smart Building Market Revenue (US$ Mn) and Forecasts, By
Automation Type
9.5.3.1.1. Energy Management
9.5.3.1.2. Intelligent security systems
9.5.3.1.3. Infrastructure Management
9.5.3.1.4. Network and Communication Management
9.5.3.2. Spain Market Revenue (US$ Mn) and Forecasts, By Services
9.5.3.2.1. Professional Services
9.5.3.2.2. Managed Services
9.5.3.3. Spain Smart Building Market Revenue (US$ Mn) and Forecasts, By
Application
9.5.3.3.1. Commercial
9.5.3.3.2. Residential
9.5.3.3.3. Government
9.5.3.3.4. Airports
9.5.3.3.5. Hospitals
9.5.3.3.6. Institutes
9.5.3.3.7. Manufacturing and Industrial Facilities
9.5.3.3.8. Others
9.5.4. Germany
9.5.4.1. Germany Smart Building Market Revenue (US$ Mn) and Forecasts,
By Automation Type
9.5.4.1.1. Energy Management
9.5.4.1.2. Intelligent security systems
9.5.4.1.3. Infrastructure Management
9.5.4.1.4. Network and Communication Management
9.5.4.2. Germany Smart Building Market Revenue (US$ Mn) and Forecasts,
By Services
9.5.4.2.1. Professional Services
9.5.4.2.2. Managed Services
9.5.4.3. Germany Smart Building Market Revenue (US$ Mn) and Forecasts,
By Application
9.5.4.3.1. Commercial
9.5.4.3.2. Residential
9.5.4.3.3. Government
9.5.4.3.4. Airports
9.5.4.3.5. Hospitals
9.5.4.3.6. Institutes
9.5.4.3.7. Manufacturing and Industrial Facilities
9.5.4.3.8. Others
9.5.5. Italy
9.5.5.1. Italy Smart Building Market Revenue (US$ Mn) and Forecasts, By
Automation Type
9.5.5.1.1. Energy Management
9.5.5.1.2. Intelligent security systems
9.5.5.1.3. Infrastructure Management
9.5.5.1.4. Network and Communication Management
9.5.5.2. Italy Market Revenue (US$ Mn) and Forecasts, By Services
9.5.5.2.1. Professional Services
9.5.5.2.2. Managed Services
9.5.5.3. Italy Smart Building Market Revenue (US$ Mn) and Forecasts, By
Application
9.5.5.3.1. Commercial
9.5.5.3.2. Residential
9.5.5.3.3. Government
9.5.5.3.4. Airports
9.5.5.3.5. Hospitals
9.5.5.3.6. Institutes
9.5.5.3.7. Manufacturing and Industrial Facilities
9.5.5.3.8. Others
9.5.6. Rest of Europe
9.5.6.1. Rest of Europe Smart Building Market Revenue (US$ Mn) and
Forecasts, By Automation Type
9.5.6.1.1. Energy Management
9.5.6.1.2. Intelligent security systems
9.5.6.1.3. Infrastructure Management
9.5.6.1.4. Network and Communication Management
9.5.6.2. Rest of Europe Smart Building Market Revenue (US$ Mn) and
Forecasts, By Services
9.5.6.2.1. Professional Services
9.5.6.2.2. Managed Services
9.5.6.3. Rest of Europe Smart Building Market Revenue (US$ Mn) and
Forecasts, By Application
9.5.6.3.1. Commercial
9.5.6.3.2. Residential
9.5.6.3.3. Government
9.5.6.3.4. Airports
9.5.6.3.5. Hospitals
9.5.6.3.6. Institutes
9.5.6.3.7. Manufacturing and Industrial Facilities
9.5.6.3.8. Others
9.6. Key Segment for Channeling Investments
9.6.1. By Country
9.6.2. By Automation Type
9.6.3. By Services
9.6.4. By Application
10. Asia Pacific Smart Building Market Analysis and Forecasts,
2018 – 2026
10.1. Overview
10.1.1. Asia Pacific Market Revenue (US$ Mn)
10.2. Asia Pacific Smart Building Market Revenue (US$ Mn) and
Forecasts, By Automation Type
10.2.1. Energy Management
10.2.2. Intelligent security systems
10.2.3. Infrastructure Management
10.2.4. Network and Communication Management
10.3. Asia Pacific Market Revenue (US$ Mn) and Forecasts, By
Services
10.3.1. Professional Services
10.3.2. Managed Services
10.4. Asia Pacific Smart Building Market Revenue (US$ Mn) and
Forecasts, By Application
10.4.1. Commercial
10.4.2. Residential
10.4.3. Government
10.4.4. Airports
10.4.5. Hospitals
10.4.6. Institutes
10.4.7. Manufacturing and Industrial Facilities
10.4.8. Others
10.5. Asia Pacific Smart Building Market Revenue (US$ Mn) and
Forecasts, By Country
10.5.1. China
10.5.1.1. China Smart Building Market Revenue (US$ Mn) and Forecasts, By
Automation Type
10.5.1.1.1. Energy Management
10.5.1.1.2. Intelligent security systems
10.5.1.1.3. Infrastructure Management
10.5.1.1.4. Network and Communication Management
10.5.1.2. China Market Revenue (US$ Mn) and Forecasts, By Services
10.5.1.2.1. Professional Services
10.5.1.2.2. Managed Services
10.5.1.3. China Smart Building Market Revenue (US$ Mn) and Forecasts, By
Application
10.5.1.3.1. Commercial
10.5.1.3.2. Residential
10.5.1.3.3. Government
10.5.1.3.4. Airports
10.5.1.3.5. Hospitals
10.5.1.3.6. Institutes
10.5.1.3.7. Manufacturing and Industrial Facilities
10.5.1.3.8. Others
10.5.2. Japan
10.5.2.1. Japan Smart Building Market Revenue (US$ Mn) and Forecasts, By
Automation Type
10.5.2.1.1. Energy Management
10.5.2.1.2. Intelligent security systems
10.5.2.1.3. Infrastructure Management
10.5.2.1.4. Network and Communication Management
10.5.2.2. Japan Market Revenue (US$ Mn) and Forecasts, By Services
10.5.2.2.1. Professional Services
10.5.2.2.2. Managed Services
10.5.2.3. Japan Smart Building Market Revenue (US$ Mn) and Forecasts, By
Application
10.5.2.3.1. Commercial
10.5.2.3.2. Residential
10.5.2.3.3. Government
10.5.2.3.4. Airports
10.5.2.3.5. Hospitals
10.5.2.3.6. Institutes
10.5.2.3.7. Manufacturing and Industrial Facilities
10.5.2.3.8. Others
10.5.3. India
10.5.3.1. India Smart Building Market Revenue (US$ Mn) and Forecasts, By
Automation Type
10.5.3.1.1. Energy Management
10.5.3.1.2. Intelligent security systems
10.5.3.1.3. Infrastructure Management
10.5.3.1.4. Network and Communication Management
10.5.3.2. India Market Revenue (US$ Mn) and Forecasts, By Services
10.5.3.2.1. Professional Services
10.5.3.2.2. Managed Services
10.5.3.3. India Smart Building Market Revenue (US$ Mn) and Forecasts, By
Application
10.5.3.3.1. Commercial
10.5.3.3.2. Residential
10.5.3.3.3. Government
10.5.3.3.4. Airports
10.5.3.3.5. Hospitals
10.5.3.3.6. Institutes
10.5.3.3.7. Manufacturing and Industrial Facilities
10.5.3.3.8. Others
10.5.4. Southeast Asia
10.5.4.1. Southeast Asia Smart Building Market Revenue (US$ Mn) and
Forecasts, By Automation Type
10.5.4.1.1. Energy Management
10.5.4.1.2. Intelligent security systems
10.5.4.1.3. Infrastructure Management
10.5.4.1.4. Network and Communication Management
10.5.4.2. Southeast Asia Market Revenue (US$ Mn) and Forecasts, By
Services
10.5.4.2.1. Professional Services
10.5.4.2.2. Managed Services
10.5.4.3. Southeast Asia Smart Building Market Revenue (US$ Mn) and
Forecasts, By Application
10.5.4.3.1. Commercial
10.5.4.3.2. Residential
10.5.4.3.3. Government
10.5.4.3.4. Airports
10.5.4.3.5. Hospitals
10.5.4.3.6. Institutes
10.5.4.3.7. Manufacturing and Industrial Facilities
10.5.4.3.8. Others
10.5.5. Rest of Asia Pacific
10.5.5.1. Rest of Asia Pacific Smart Building Market Revenue (US$ Mn)
and Forecasts, By Automation Type
10.5.5.1.1. Energy Management
10.5.5.1.2. Intelligent security systems
10.5.5.1.3. Infrastructure Management
10.5.5.1.4. Network and Communication Management
10.5.5.2. Rest of Asia Pacific Smart Building Market Revenue (US$ Mn)
and Forecasts, By Services
10.5.5.2.1. Professional Services
10.5.5.2.2. Managed Services
10.5.5.3. Rest of Asia Pacific Smart Building Market Revenue (US$ Mn)
and Forecasts, By Application
10.5.5.3.1. Commercial
10.5.5.3.2. Residential
10.5.5.3.3. Government
10.5.5.3.4. Airports
10.5.5.3.5. Hospitals
10.5.5.3.6. Institutes
10.5.5.3.7. Manufacturing and Industrial Facilities
10.5.5.3.8. Others
10.6. Key Segment for Channeling Investments
10.6.1. By Country
10.6.2. By Automation Type
10.6.3. By Services
10.6.4. By Application
11. Middle East and Africa Smart Building Market Analysis and
Forecasts, 2018 – 2026
11.1. Overview
11.1.1. Middle East and Africa Market Revenue (US$ Mn)
11.2. Middle East and Africa Market Revenue (US$ Mn) and Forecasts,
By Automation Type
11.2.1. Energy Management
11.2.2. Intelligent security systems
11.2.3. Infrastructure Management
11.2.4. Network and Communication Management
11.3. Middle East and Africa Smart Building Market Revenue (US$ Mn)
and Forecasts, By Services
11.3.1. Professional Services
11.3.2. Managed Services
11.4. Middle East and Africa Smart Building Market Revenue (US$ Mn)
and Forecasts, By Application
11.4.1. Commercial
11.4.2. Residential
11.4.3. Government
11.4.4. Airports
11.4.5. Hospitals
11.4.6. Institutes
11.4.7. Manufacturing and Industrial Facilities
11.4.8. Others
11.5. Middle East and Africa Smart Building Market Revenue (US$ Mn)
and Forecasts, By Country
11.5.1. GCC Countries
11.5.1.1. GCC Countries Smart Building Market Revenue (US$ Mn) and
Forecasts, By Automation Type
11.5.1.1.1. Energy Management
11.5.1.1.2. Intelligent security systems
11.5.1.1.3. Infrastructure Management
11.5.1.1.4. Network and Communication Management
11.5.1.2. GCC Countries Smart Building Market Revenue (US$ Mn) and
Forecasts, By Services
11.5.1.2.1. Professional Services
11.5.1.2.2. Managed Services
11.5.1.3. GCC Countries Smart Building Market Revenue (US$ Mn) and Forecasts,
By Application
11.5.1.3.1. Commercial
11.5.1.3.2. Residential
11.5.1.3.3. Government
11.5.1.3.4. Airports
11.5.1.3.5. Hospitals
11.5.1.3.6. Institutes
11.5.1.3.7. Manufacturing and Industrial Facilities
11.5.1.3.8. Others
11.5.2. Southern Africa
11.5.2.1. Southern Africa Smart Building Market Revenue (US$ Mn) and
Forecasts, By Automation Type
11.5.2.1.1. Energy Management
11.5.2.1.2. Intelligent security systems
11.5.2.1.3. Infrastructure Management
11.5.2.1.4. Network and Communication Management
11.5.2.2. Southern Africa Smart Building Market Revenue (US$ Mn) and
Forecasts, By Services
11.5.2.2.1. Professional Services
11.5.2.2.2. Managed Services
11.5.2.3. Southern Africa Smart Building Market Revenue (US$ Mn) and
Forecasts, By Application
11.5.2.3.1. Commercial
11.5.2.3.2. Residential
11.5.2.3.3. Government
11.5.2.3.4. Airports
11.5.2.3.5. Hospitals
11.5.2.3.6. Institutes
11.5.2.3.7. Manufacturing and Industrial Facilities
11.5.2.3.8. Others
11.5.3. Rest of MEA
11.5.3.1. Rest of MEA Smart Building Market Revenue (US$ Mn) and
Forecasts, By Automation Type
11.5.3.1.1. Energy Management
11.5.3.1.2. Intelligent security systems
11.5.3.1.3. Infrastructure Management
11.5.3.1.4. Network and Communication Management
11.5.3.2. Rest of MEA Smart Building Market Revenue (US$ Mn) and
Forecasts, By Services
11.5.3.2.1. Professional Services
11.5.3.2.2. Managed Services
11.5.3.3. Rest of MEA Smart Building Market Revenue (US$ Mn) and
Forecasts, By Application
11.5.3.3.1. Commercial
11.5.3.3.2. Residential
11.5.3.3.3. Government
11.5.3.3.4. Airports
11.5.3.3.5. Hospitals
11.5.3.3.6. Institutes
11.5.3.3.7. Manufacturing and Industrial Facilities
11.5.3.3.8. Others
11.6. Key Segment for Channeling Investments
11.6.1. By Country
11.6.2. By Automation Type
11.6.3. By Services
11.6.4. By Application
12. Latin America Smart Building Market Analysis and Forecasts,
2018 – 2026
12.1. Overview
12.1.1. Latin America Market Revenue (US$ Mn)
12.2. Latin America Smart Building Market Revenue (US$ Mn) and
Forecasts, By Automation Type
12.2.1. Energy Management
12.2.2. Intelligent security systems
12.2.3. Infrastructure Management
12.2.4. Network and Communication Management
12.3. Latin America Market Revenue (US$ Mn) and Forecasts, By
Services
12.3.1. Professional Services
12.3.2. Managed Services
12.4. Latin America Smart Building Market Revenue (US$ Mn) and
Forecasts, By Application
12.4.1. Commercial
12.4.2. Residential
12.4.3. Government
12.4.4. Airports
12.4.5. Hospitals
12.4.6. Institutes
12.4.7. Manufacturing and Industrial Facilities
12.4.8. Others
12.5. Latin America Smart Building Market Revenue (US$ Mn) and
Forecasts, By Country
12.5.1. Brazil
12.5.1.1. Brazil Smart Building Market Revenue (US$ Mn) and Forecasts,
By Automation Type
12.5.1.1.1. Energy Management
12.5.1.1.2. Intelligent security systems
12.5.1.1.3. Infrastructure Management
12.5.1.1.4. Network and Communication Management
12.5.1.2. Brazil Smart Building Market Revenue (US$ Mn) and Forecasts,
By Services
12.5.1.2.1. Professional Services
12.5.1.2.2. Managed Services
12.5.1.3. Brazil Smart Building Market Revenue (US$ Mn) and Forecasts,
By Application
12.5.1.3.1. Commercial
12.5.1.3.2. Residential
12.5.1.3.3. Government
12.5.1.3.4. Airports
12.5.1.3.5. Hospitals
12.5.1.3.6. Institutes
12.5.1.3.7. Manufacturing and Industrial Facilities
12.5.1.3.8. Others
12.5.2. Rest of Latin America
12.5.2.1. Rest of Latin America Smart Building Market Revenue (US$ Mn)
and Forecasts, By Automation Type
12.5.2.1.1. Energy Management
12.5.2.1.2. Intelligent security systems
12.5.2.1.3. Infrastructure Management
12.5.2.1.4. Network and Communication Management
12.5.2.2. Rest of Latin America Smart Building Market Revenue (US$ Mn)
and Forecasts, By Services
12.5.2.2.1. Professional Services
12.5.2.2.2. Managed Services
12.5.2.3. Rest of Latin America Smart Building Market Revenue (US$ Mn)
and Forecasts, By Application
12.5.2.3.1. Commercial
12.5.2.3.2. Residential
12.5.2.3.3. Government
12.5.2.3.4. Airports
12.5.2.3.5. Hospitals
12.5.2.3.6. Institutes
12.5.2.3.7. Manufacturing and Industrial Facilities
12.5.2.3.8. Others
12.6. Key Segment for Channeling Investments
12.6.1. By Country
12.6.2. By Automation Type
12.6.3. By Services
12.6.4. By Application
13. Competitive Benchmarking
13.1. Player Positioning Analysis
13.2. Global Presence and Growth Strategies
14. Player Profiles
14.1. ABB Group
14.1.1. Company Details
14.1.2. Company Overview
14.1.3. Product Offerings
14.1.4. Key Developments
14.1.5. Financial Analysis
14.1.6. SWOT Analysis
14.1.7. Business Strategies
14.2. Building, Inc.
14.2.1. Company Details
14.2.2. Company Overview
14.2.3. Product Offerings
14.2.4. Key Developments
14.2.5. Financial Analysis
14.2.6. SWOT Analysis
14.2.7. Business Strategies
14.3. Cisco Systems
14.3.1. Company Details
14.3.2. Company Overview
14.3.3. Product Offerings
14.3.4. Key Developments
14.3.5. Financial Analysis
14.3.6. SWOT Analysis
14.3.7. Business Strategies
14.4. Delta Controls
14.4.1. Company Details
14.4.2. Company Overview
14.4.3. Product Offerings
14.4.4. Key Developments
14.4.5. Financial Analysis
14.4.6. SWOT Analysis
14.4.7. Business Strategies
14.5. Honeywell International
14.5.1. Company Details
14.5.2. Company Overview
14.5.3. Product Offerings
14.5.4. Key Developments
14.5.5. Financial Analysis
14.5.6. SWOT Analysis
14.5.7. Business Strategies
14.6. IBM Corporation
14.6.1. Company Details
14.6.2. Company Overview
14.6.3. Product Offerings
14.6.4. Key Developments
14.6.5. Financial Analysis
14.6.6. SWOT Analysis
14.6.7. Business Strategies
14.7. Johnson Controls
14.7.1. Company Details
14.7.2. Company Overview
14.7.3. Product Offerings
14.7.4. Key Developments
14.7.5. Financial Analysis
14.7.6. SWOT Analysis
14.7.7. Business Strategies
14.8. Schneider SE
14.8.1. Company Details
14.8.2. Company Overview
14.8.3. Product Offerings
14.8.4. Key Developments
14.8.5. Financial Analysis
14.8.6. SWOT Analysis
14.8.7. Business Strategies
14.9. Siemens AG
14.9.1. Company Details
14.9.2. Company Overview
14.9.3. Product Offerings
14.9.4. Key Developments
14.9.5. Financial Analysis
14.9.6. SWOT Analysis
14.9.7. Business Strategies
14.10. United
Technologies Corporation
14.10.1. Company Details
14.10.2. Company Overview
14.10.3. Product
Offerings
14.10.4. Key
Developments
14.10.5. Financial
Analysis
14.10.6. SWOT Analysis
14.10.7. Business Strategies
At Absolute Markets Insights, we are engaged in building both global as well as country specific reports. As a result, the approach taken for deriving the estimation and forecast for a specific country is a bit unique and different in comparison to the global research studies. In this case, we not only study the concerned market factors & trends prevailing in a particular country (from secondary research) but we also tend to calculate the actual market size & forecast from the revenue generated from the market participants involved in manufacturing or distributing the any concerned product. These companies can also be service providers. For analyzing any country specifically, we do consider the growth factors prevailing under the states/cities/county for the same. For instance, if we are analyzing an industry specific to United States, we primarily need to study about the states present under the same(where the product/service has the highest growth). Similar analysis will be followed by other countries. Our scope of the report changes with different markets.
Our research study is mainly implement through a mix of both secondary and primary research. Various sources such as industry magazines, trade journals, and government websites and trade associations are reviewed for gathering precise data. Primary interviews are conducted to validate the market size derived from secondary research. Industry experts, major manufacturers and distributors are contacted for further validation purpose on the current market penetration and growth trends.
Prominent participants in our primary research process include:
- Key Opinion Leaders namely the CEOs, CSOs, VPs, purchasing managers, amongst others
- Research and development participants, distributors/suppliers and subject matter experts
Secondary Research includes data extracted from paid data sources:
- Reuters
- Factiva
- Bloomberg
- One Source
- Hoovers
Research Methodology

Key Inclusions


