
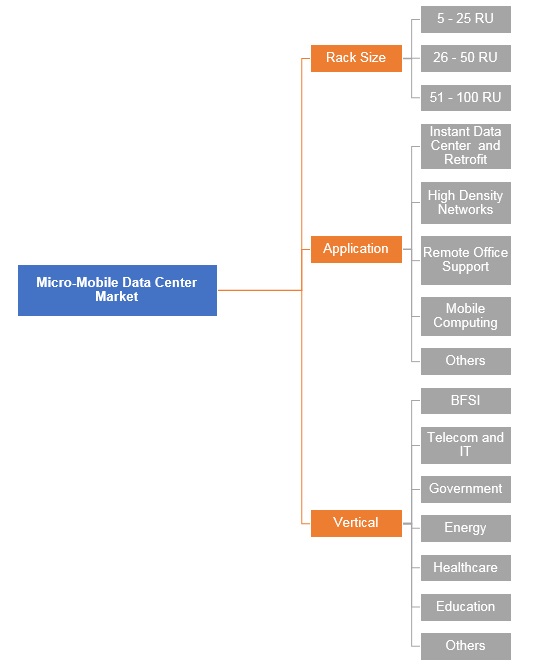
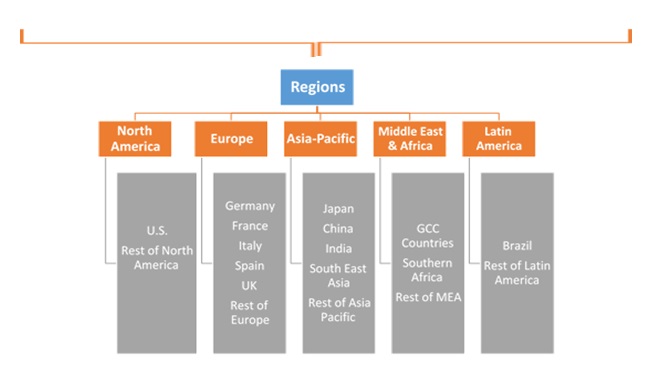
Micro Mobile Data Center Market by Rack Size (5 – 25 RU, 26 – 50 RU and 51 – 100 RU); by Application (Instant Data Center and Retrofit, High Density Networks, Remote Office Support, Mobile Computing and Others); by Vertical (BFSI, Telecom and IT, Government, Energy, Healthcare, Education and Others); by Regional outlook (U.S., Rest of North America, France, UK, Germany, Spain, Italy, Rest of Europe, China, Japan, India, Southeast Asia, Rest of Asia Pacific, GCC Countries, Southern Africa, Rest of MEA, Brazil, Rest of Latin America) – Global Insights, Growth, Size, Comparative Analysis, Trends and Forecast, 2018 - 2026
Industry Trends
Micro Mobile data centers are the rack level configuration data centers which are modular and smaller architectures designed to solve different workloads. These data centers offer plug and play support along with other traditional data center components and devices. Furthermore, the data center comprises of on board cooling systems, security systems, fire suppression and is equipped with uninterrupted power supply (UPS). These data center can be deployed both in indoor, outdoor and in rugged areas, owing to their modular architectures. Hence, micro mobile data centers are used majorly in the areas where, edge analytics are predominantly done.
Micro mobile data center market, in terms of revenue, which was estimated at USD 2740 million in 2017, is expected to reach USD 10450 million in 2022.
Global Micro Mobile Data Center Market, By Rack Size, 2018 - 2026 (USD Million)
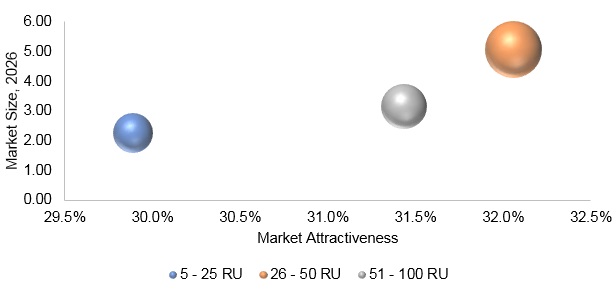
The micro mobile data centers are cabinet and box in sizes, which proves beneficial in deploying inside the premises, thereby resulting in construction delays. These modular data centers can host around 10 servers and an approximate of 100 virtual machines from one single 19-inch box. Hence, it reduces the complexity of deploying data center in remote locations and in dispersed user base branch office. Moreover, the server rooms are energy inefficient and inflexible and thus, require more energy to keep the equipment cool. As the standard servers are space intensive, it requires high capital expenditure to install. Hence, a need in effective optimized server was a concern for the small and medium enterprises. However, on the advent of micro mobile data centers, a steep rise in adoption of modular data centers is perceived among the small enterprises. In addition, these mobile data center offer ease in remote monitoring, security management and managing the temperature and power effectively. Moreover, the rise in cloud-based servers owing to the concerns in low power consumption has enabled a high potency for the micro mobile data center.
Micro Mobile Data Center Market, By Vertical
On the basis of the vertical, the telecom and IT is expected to be the most attractive segment of the global micro mobile data center market. Majority of the business across the globe rely on the telecom and IT industry. This is predominantly due to the high disruptions in technology in the IT sector. Moreover, the need of connectivity, availability of data and ease of sharing information require high energy efficient, cooling and computing servers. In addition, the growth of small IT organizations and their services for other sectors require mobile personalize servers. As a need of commutable and mechanized servers, a rise in micro mobile data centers is witnessed in the IT and Telecom industry.
Micro Mobile Data Center Market, By Region
North America region is estimated to capture the major market share in the global micro mobile data center market. The growth in the region is pronominally owing to the early adoption of micro data centers by the companies. Furthermore, the increasing awareness about the micro data centers has poised the adoption rate in BFSI, healthcare and IT, telecom industry. In addition, the growth of SMEs and the adoption rate of remote mobile data centers are high in the region. Hence, it has anticipated the growth of the market in the region.
Competitive Landscape
The micro mobile data center market report provides both, subjective and quantitative research of the market, as well as integrates worthy insights into the rational scenario and favored development methods adopted by the key contenders. The report also offers extensive research on the key players in this market and detailed insights on the competitiveness of these players. The key business strategies such as M&A, affiliations, collaborations, and contracts adopted by the major players are also recognized and analyzed in the report. For each company, the report recognizes their manufacturing base, competitors, product type, application and specification, pricing, and gross margin.
Some of the primary market participants are AST Modular, Canovate, DELL, Huawei Technologies co., LTD., instant Data Centers, LLC, Panduit, Rittal GmbH & Co. KG, Silicon Graphics international Corp, Wave2Wave, Zellabox, Altron, AS amongst others.

Micro Mobile Data Center Industry Background
1.
Introduction
1.1.
Market Scope
1.2.
Market
Segmentation
1.3.
Methodology
1.4.
Assumptions
2.
Micro mobile data center market Snapshot
3.
Executive Summary: Micro mobile data center
market
4.
Qualitative Analysis: Micro mobile data center
market
4.1.
Introduction
4.1.1.
Product
Definition
4.1.2.
Industry
Development
4.2.
Market Dynamics
4.2.1.
Drivers
4.2.2.
Restraints
4.2.3.
Opportunities
4.3.
Trends in market
5.
Global Micro mobile data center market Analysis
and Forecasts, 2018 – 2026
5.1.
Overview
5.1.1.
Global market
Revenue (US$ Mn) and Forecasts
5.2.
Global Micro
mobile data center market Revenue (US$ Mn) and Forecasts, By Rack Size
5.2.1.
5 - 25 RU
5.2.1.1.
Definition
5.2.1.2.
Market
Penetration
5.2.1.3.
Market Revenue
Expected to Increase by 2026
5.2.1.4.
Compound Annual
Growth Rate (CAGR)
5.2.2.
26 - 50 RU
5.2.2.1.
Definition
5.2.2.2.
Market
Penetration
5.2.2.3.
Market Revenue
Expected to Increase by 2026
5.2.2.4.
Compound Annual
Growth Rate (CAGR)
5.2.3.
51 - 100 RU
5.2.3.1.
Definition
5.2.3.2.
Market Penetration
5.2.3.3.
Market Revenue
Expected to Increase by 2026
5.2.3.4.
Compound Annual
Growth Rate (CAGR)
5.3.
Key Segment for
Channeling Investments
5.3.1.
By Rack Size
6.
Global Micro mobile data center market Analysis
and Forecasts, 2018 – 2026
6.1.
Overview
6.2.
Global Micro
mobile data center market Revenue (US$ Mn) and Forecasts, By Application
6.2.1.
Instant Data
Center and Retrofit
6.2.1.1.
Definition
6.2.1.2.
Market
Penetration
6.2.1.3.
Market Revenue
Expected to Increase by 2026
6.2.1.4.
Compound Annual
Growth Rate (CAGR)
6.2.2.
High Density
Networks
6.2.2.1.
Definition
6.2.2.2.
Market
Penetration
6.2.2.3.
Market Revenue
Expected to Increase by 2026
6.2.2.4.
Compound Annual
Growth Rate (CAGR)
6.2.3.
Remote Office
Support
6.2.3.1.
Definition
6.2.3.2.
Market
Penetration
6.2.3.3.
Market Revenue
Expected to Increase by 2026
6.2.3.4.
Compound Annual
Growth Rate (CAGR)
6.2.4.
Mobile Computing
6.2.4.1.
Definition
6.2.4.2.
Market
Penetration
6.2.4.3.
Market Revenue
Expected to Increase by 2026
6.2.4.4.
Compound Annual
Growth Rate (CAGR)
6.2.5.
Others
6.2.5.1.
Definition
6.2.5.2.
Market
Penetration
6.2.5.3.
Market Revenue
Expected to Increase by 2026
6.2.5.4.
Compound Annual
Growth Rate (CAGR)
6.3.
Key Segment for
Channeling Investments
6.3.1.
By Application
7.
Global Micro mobile data center market Analysis
and Forecasts, 2018 – 2026
7.1.
Overview
7.2.
Global Micro
mobile data center market Revenue (US$ Mn) and Forecasts, By Vertical
7.2.1.
BFSI
7.2.1.1.
Definition
7.2.1.2.
Market
Penetration
7.2.1.3.
Market Revenue
Expected to Increase by 2026
7.2.1.4.
Compound Annual
Growth Rate (CAGR)
7.2.2.
Telecom and IT
7.2.2.1.
Definition
7.2.2.2.
Market
Penetration
7.2.2.3.
Market Revenue
Expected to Increase by 2026
7.2.2.4.
Compound Annual
Growth Rate (CAGR)
7.2.3.
Government
7.2.3.1.
Definition
7.2.3.2.
Market
Penetration
7.2.3.3.
Market Revenue
Expected to Increase by 2026
7.2.3.4.
Compound Annual
Growth Rate (CAGR)
7.2.4.
Energy
7.2.4.1.
Definition
7.2.4.2.
Market
Penetration
7.2.4.3.
Market Revenue
Expected to Increase by 2026
7.2.4.4.
Compound Annual
Growth Rate (CAGR)
7.2.5.
Healthcare
7.2.5.1.
Definition
7.2.5.2.
Market
Penetration
7.2.5.3.
Market Revenue
Expected to Increase by 2026
7.2.5.4.
Compound Annual
Growth Rate (CAGR)
7.2.6.
Education
7.2.6.1.
Definition
7.2.6.2.
Market
Penetration
7.2.6.3.
Market Revenue
Expected to Increase by 2026
7.2.6.4.
Compound Annual
Growth Rate (CAGR)
7.2.7.
Others
7.2.7.1.
Definition
7.2.7.2.
Market
Penetration
7.2.7.3.
Market Revenue
Expected to Increase by 2026
7.2.7.4.
Compound Annual
Growth Rate (CAGR)
7.3.
Key Segment for
Channeling Investments
7.3.1.
By Vertical
8.
North America Micro mobile data center market
Analysis and Forecasts, 2018 – 2026
8.1.
Overview
8.1.1.
North America market
Revenue (US$ Mn)
8.2.
North America Micro
mobile data center market Revenue (US$ Mn) and Forecasts, By Rack Size
8.2.1.
5 - 25 RU
8.2.2.
26 - 50 RU
8.2.3.
51 - 100 RU
8.3.
North America market
Revenue (US$ Mn) and Forecasts, By Application
8.3.1.
Instant Data
Center and Retrofit
8.3.2.
High Density
Networks
8.3.3.
Remote Office
Support
8.3.4.
Mobile Computing
8.3.5.
Others
8.4.
North America Micro
mobile data center market Revenue (US$ Mn) and Forecasts, By Vertical
8.4.1.
BFSI
8.4.2.
Telecom and IT
8.4.3.
Government
8.4.4.
Energy
8.4.5.
Healthcare
8.4.6.
Education
8.4.7.
Others
8.5.
North America market
Revenue (US$ Mn) and Forecasts, By Country
8.5.1.
U.S.
8.5.1.1.
U.S. Micro mobile
data center market Revenue (US$ Mn) and Forecasts, By Rack Size
8.5.1.1.1.
5 - 25 RU
8.5.1.1.2.
26 - 50 RU
8.5.1.1.3.
51 - 100 RU
8.5.1.2.
U.S. market
Revenue (US$ Mn) and Forecasts, By Application
8.5.1.2.1.
Instant Data
Center and Retrofit
8.5.1.2.2.
High Density
Networks
8.5.1.2.3.
Remote Office
Support
8.5.1.2.4.
Mobile Computing
8.5.1.2.5.
Others
8.5.1.3.
U.S. Micro mobile
data center market Revenue (US$ Mn) and Forecasts, By Vertical
8.5.1.3.1.
BFSI
8.5.1.3.2.
Telecom and IT
8.5.1.3.3.
Government
8.5.1.3.4.
Energy
8.5.1.3.5.
Healthcare
8.5.1.3.6.
Education
8.5.1.3.7.
Others
8.5.2.
Rest of North
America
8.5.2.1.
Rest of North
America Micro mobile data center market Revenue (US$ Mn) and Forecasts, By Rack
Size
8.5.2.1.1.
5 - 25 RU
8.5.2.1.2.
26 - 50 RU
8.5.2.1.3.
51 - 100 RU
8.5.2.2.
Rest of North
America market Revenue (US$ Mn) and Forecasts, By Application
8.5.2.2.1.
Instant Data
Center and Retrofit
8.5.2.2.2.
High Density
Networks
8.5.2.2.3.
Remote Office
Support
8.5.2.2.4.
Mobile Computing
8.5.2.2.5.
Others
8.5.2.3.
Rest of North
America Micro mobile data center market Revenue (US$ Mn) and Forecasts, By
Vertical
8.5.2.3.1.
BFSI
8.5.2.3.2.
Telecom and IT
8.5.2.3.3.
Government
8.5.2.3.4.
Energy
8.5.2.3.5.
Healthcare
8.5.2.3.6.
Education
8.5.2.3.7.
Others
8.6.
Key Segment for
Channeling Investments
8.6.1.
By Country
8.6.2.
By Rack Size
8.6.3.
By Application
8.6.4.
By Vertical
9.
Europe Micro mobile data center market Analysis
and Forecasts, 2018 – 2026
9.1.
Overview
9.1.1.
Europe market
Revenue (US$ Mn)
9.2.
Europe Micro
mobile data center market Revenue (US$ Mn) and Forecasts, By Rack Size
9.2.1.
5 - 25 RU
9.2.2.
26 - 50 RU
9.2.3.
51 - 100 RU
9.3.
Europe market
Revenue (US$ Mn) and Forecasts, By Application
9.3.1.
Instant Data
Center and Retrofit
9.3.2.
High Density
Networks
9.3.3.
Remote Office
Support
9.3.4.
Mobile Computing
9.3.5.
Others
9.4.
Europe Micro
mobile data center market Revenue (US$ Mn) and Forecasts, By Vertical
9.4.1.
BFSI
9.4.2.
Telecom and IT
9.4.3.
Government
9.4.4.
Energy
9.4.5.
Healthcare
9.4.6.
Education
9.4.7.
Others
9.5.
Europe market
Revenue (US$ Mn) and Forecasts, By Country
9.5.1.
France
9.5.1.1.
France Micro
mobile data center market Revenue (US$ Mn) and Forecasts, By Rack Size
9.5.1.1.1.
5 - 25 RU
9.5.1.1.2.
26 - 50 RU
9.5.1.1.3.
51 - 100 RU
9.5.1.2.
France market
Revenue (US$ Mn) and Forecasts, By Application
9.5.1.2.1.
Instant Data
Center and Retrofit
9.5.1.2.2.
High Density
Networks
9.5.1.2.3.
Remote Office
Support
9.5.1.2.4.
Mobile Computing
9.5.1.2.5.
Others
9.5.1.3.
France Micro
mobile data center market Revenue (US$ Mn) and Forecasts, By Vertical
9.5.1.3.1.
BFSI
9.5.1.3.2.
Telecom and IT
9.5.1.3.3.
Government
9.5.1.3.4.
Energy
9.5.1.3.5.
Healthcare
9.5.1.3.6.
Education
9.5.1.3.7.
Others
9.5.2.
The UK
9.5.2.1.
The UK Micro
mobile data center market Revenue (US$ Mn) and Forecasts, By Rack Size
9.5.2.1.1.
5 - 25 RU
9.5.2.1.2.
26 - 50 RU
9.5.2.1.3.
51 - 100 RU
9.5.2.2.
The UK market
Revenue (US$ Mn) and Forecasts, By Application
9.5.2.2.1.
Instant Data
Center and Retrofit
9.5.2.2.2.
High Density
Networks
9.5.2.2.3.
Remote Office
Support
9.5.2.2.4.
Mobile Computing
9.5.2.2.5.
Others
9.5.2.3.
The UK Micro
mobile data center market Revenue (US$ Mn) and Forecasts, By Vertical
9.5.2.3.1.
BFSI
9.5.2.3.2.
Telecom and IT
9.5.2.3.3.
Government
9.5.2.3.4.
Energy
9.5.2.3.5.
Healthcare
9.5.2.3.6.
Education
9.5.2.3.7.
Others
9.5.3.
Spain
9.5.3.1.
Spain Micro
mobile data center market Revenue (US$ Mn) and Forecasts, By Rack Size
9.5.3.1.1.
5 - 25 RU
9.5.3.1.2.
26 - 50 RU
9.5.3.1.3.
51 - 100 RU
9.5.3.2.
Spain market
Revenue (US$ Mn) and Forecasts, By Application
9.5.3.2.1.
Instant Data
Center and Retrofit
9.5.3.2.2.
High Density
Networks
9.5.3.2.3.
Remote Office
Support
9.5.3.2.4.
Mobile Computing
9.5.3.2.5.
Others
9.5.3.3.
Spain Micro
mobile data center market Revenue (US$ Mn) and Forecasts, By Vertical
9.5.3.3.1.
BFSI
9.5.3.3.2.
Telecom and IT
9.5.3.3.3.
Government
9.5.3.3.4.
Energy
9.5.3.3.5.
Healthcare
9.5.3.3.6.
Education
9.5.3.3.7.
Others
9.5.4.
Germany
9.5.4.1.
Germany Micro
mobile data center market Revenue (US$ Mn) and Forecasts, By Rack Size
9.5.4.1.1.
5 - 25 RU
9.5.4.1.2.
26 - 50 RU
9.5.4.1.3.
51 - 100 RU
9.5.4.2.
Germany market
Revenue (US$ Mn) and Forecasts, By Application
9.5.4.2.1.
Instant Data
Center and Retrofit
9.5.4.2.2.
High Density
Networks
9.5.4.2.3.
Remote Office
Support
9.5.4.2.4.
Mobile Computing
9.5.4.2.5.
Others
9.5.4.3.
Germany Micro
mobile data center market Revenue (US$ Mn) and Forecasts, By Vertical
9.5.4.3.1.
BFSI
9.5.4.3.2.
Telecom and IT
9.5.4.3.3.
Government
9.5.4.3.4.
Energy
9.5.4.3.5.
Healthcare
9.5.4.3.6.
Education
9.5.4.3.7.
Others
9.5.5.
Italy
9.5.5.1.
Italy Micro
mobile data center market Revenue (US$ Mn) and Forecasts, By Rack Size
9.5.5.1.1.
5 - 25 RU
9.5.5.1.2.
26 - 50 RU
9.5.5.1.3.
51 - 100 RU
9.5.5.2.
Italy market
Revenue (US$ Mn) and Forecasts, By Application
9.5.5.2.1.
Instant Data
Center and Retrofit
9.5.5.2.2.
High Density
Networks
9.5.5.2.3.
Remote Office
Support
9.5.5.2.4.
Mobile Computing
9.5.5.2.5.
Others
9.5.5.3.
Italy Micro
mobile data center market Revenue (US$ Mn) and Forecasts, By Vertical
9.5.5.3.1.
BFSI
9.5.5.3.2.
Telecom and IT
9.5.5.3.3.
Government
9.5.5.3.4.
Energy
9.5.5.3.5.
Healthcare
9.5.5.3.6.
Education
9.5.5.3.7.
Others
9.5.6.
Rest of Europe
9.5.6.1.
Rest of Europe Micro
mobile data center market Revenue (US$ Mn) and Forecasts, By Rack Size
9.5.6.1.1.
5 - 25 RU
9.5.6.1.2.
26 - 50 RU
9.5.6.1.3.
51 - 100 RU
9.5.6.2.
Rest of Europe market
Revenue (US$ Mn) and Forecasts, By Application
9.5.6.2.1.
Instant Data
Center and Retrofit
9.5.6.2.2.
High Density
Networks
9.5.6.2.3.
Remote Office
Support
9.5.6.2.4.
Mobile Computing
9.5.6.2.5.
Others
9.5.6.3.
Rest of Europe Micro
mobile data center market Revenue (US$ Mn) and Forecasts, By Vertical
9.5.6.3.1.
BFSI
9.5.6.3.2.
Telecom and IT
9.5.6.3.3.
Government
9.5.6.3.4.
Energy
9.5.6.3.5.
Healthcare
9.5.6.3.6.
Education
9.5.6.3.7.
Others
9.6.
Key Segment for
Channeling Investments
9.6.1.
By Country
9.6.2.
By Rack Size
9.6.3.
By Application
9.6.4.
By Vertical
10. Asia Pacific
Micro mobile data center market Analysis and Forecasts, 2018 – 2026
10.1. Overview
10.1.1. Asia Pacific market Revenue (US$ Mn)
10.2. Asia Pacific Micro mobile data center market
Revenue (US$ Mn) and Forecasts, By Rack Size
10.2.1. 5 - 25 RU
10.2.2. 26 - 50 RU
10.2.3. 51 - 100 RU
10.3. Asia Pacific market Revenue (US$ Mn) and
Forecasts, By Application
10.3.1. Instant Data Center and Retrofit
10.3.2. High Density Networks
10.3.3. Remote Office Support
10.3.4. Mobile Computing
10.3.5. Others
10.4. Asia Pacific Micro mobile data center market
Revenue (US$ Mn) and Forecasts, By Vertical
10.4.1. BFSI
10.4.2. Telecom and IT
10.4.3. Government
10.4.4. Energy
10.4.5. Healthcare
10.4.6. Education
10.4.7. Others
10.5. Asia Pacific market Revenue (US$ Mn) and
Forecasts, By Country
10.5.1. China
10.5.1.1.
China Micro
mobile data center market Revenue (US$ Mn) and Forecasts, By Rack Size
10.5.1.1.1.
5 - 25 RU
10.5.1.1.2.
26 - 50 RU
10.5.1.1.3.
51 - 100 RU
10.5.1.2.
China market
Revenue (US$ Mn) and Forecasts, By Application
10.5.1.2.1.
Instant Data
Center and Retrofit
10.5.1.2.2.
High Density
Networks
10.5.1.2.3.
Remote Office
Support
10.5.1.2.4.
Mobile Computing
10.5.1.2.5.
Others
10.5.1.3.
China Micro
mobile data center market Revenue (US$ Mn) and Forecasts, By Vertical
10.5.1.3.1.
BFSI
10.5.1.3.2.
Telecom and IT
10.5.1.3.3.
Government
10.5.1.3.4.
Energy
10.5.1.3.5.
Healthcare
10.5.1.3.6.
Education
10.5.1.3.7.
Others
10.5.2. Japan
10.5.2.1.
Japan Micro
mobile data center market Revenue (US$ Mn) and Forecasts, By Rack Size
10.5.2.1.1.
5 - 25 RU
10.5.2.1.2.
26 - 50 RU
10.5.2.1.3.
51 - 100 RU
10.5.2.2.
Japan market
Revenue (US$ Mn) and Forecasts, By Application
10.5.2.2.1.
Instant Data
Center and Retrofit
10.5.2.2.2.
High Density
Networks
10.5.2.2.3.
Remote Office
Support
10.5.2.2.4.
Mobile Computing
10.5.2.2.5.
Others
10.5.2.3.
Japan Micro
mobile data center market Revenue (US$ Mn) and Forecasts, By Vertical
10.5.2.3.1.
BFSI
10.5.2.3.2.
Telecom and IT
10.5.2.3.3.
Government
10.5.2.3.4.
Energy
10.5.2.3.5.
Healthcare
10.5.2.3.6.
Education
10.5.2.3.7.
Others
10.5.3. India
10.5.3.1.
India Micro
mobile data center market Revenue (US$ Mn) and Forecasts, By Rack Size
10.5.3.1.1.
5 - 25 RU
10.5.3.1.2.
26 - 50 RU
10.5.3.1.3.
51 - 100 RU
10.5.3.2.
India market
Revenue (US$ Mn) and Forecasts, By Application
10.5.3.2.1.
Instant Data
Center and Retrofit
10.5.3.2.2.
High Density
Networks
10.5.3.2.3.
Remote Office
Support
10.5.3.2.4.
Mobile Computing
10.5.3.2.5.
Others
10.5.3.3.
India Micro
mobile data center market Revenue (US$ Mn) and Forecasts, By Vertical
10.5.3.3.1.
BFSI
10.5.3.3.2.
Telecom and IT
10.5.3.3.3.
Government
10.5.3.3.4.
Energy
10.5.3.3.5.
Healthcare
10.5.3.3.6.
Education
10.5.3.3.7.
Others
10.5.4. Southeast Asia
10.5.4.1.
Southeast Asia Micro
mobile data center market Revenue (US$ Mn) and Forecasts, By Rack Size
10.5.4.1.1.
5 - 25 RU
10.5.4.1.2.
26 - 50 RU
10.5.4.1.3.
51 - 100 RU
10.5.4.2.
Southeast Asia market
Revenue (US$ Mn) and Forecasts, By Application
10.5.4.2.1.
Instant Data
Center and Retrofit
10.5.4.2.2.
High Density
Networks
10.5.4.2.3.
Remote Office
Support
10.5.4.2.4.
Mobile Computing
10.5.4.2.5.
Others
10.5.4.3.
Southeast Asia Micro
mobile data center market Revenue (US$ Mn) and Forecasts, By Vertical
10.5.4.3.1.
BFSI
10.5.4.3.2.
Telecom and IT
10.5.4.3.3.
Government
10.5.4.3.4.
Energy
10.5.4.3.5.
Healthcare
10.5.4.3.6.
Education
10.5.4.3.7.
Others
10.5.5. Rest of Asia Pacific
10.5.5.1.
Rest of Asia
Pacific Micro mobile data center market Revenue (US$ Mn) and Forecasts, By Rack
Size
10.5.5.1.1.
5 - 25 RU
10.5.5.1.2.
26 - 50 RU
10.5.5.1.3.
51 - 100 RU
10.5.5.2.
Rest of Asia
Pacific market Revenue (US$ Mn) and Forecasts, By Application
10.5.5.2.1.
Instant Data
Center and Retrofit
10.5.5.2.2.
High Density
Networks
10.5.5.2.3.
Remote Office
Support
10.5.5.2.4.
Mobile Computing
10.5.5.2.5.
Others
10.5.5.3.
Rest of Asia
Pacific Micro mobile data center market Revenue (US$ Mn) and Forecasts, By
Vertical
10.5.5.3.1.
BFSI
10.5.5.3.2.
Telecom and IT
10.5.5.3.3.
Government
10.5.5.3.4.
Energy
10.5.5.3.5.
Healthcare
10.5.5.3.6.
Education
10.5.5.3.7.
Others
10.6. Key Segment for Channeling Investments
10.6.1. By Country
10.6.2. By Rack Size
10.6.3. By Application
10.6.4. By Vertical
11. Middle East
and Africa Micro mobile data center market Analysis and Forecasts, 2018 – 2026
11.1. Overview
11.1.1. Middle East and Africa market Revenue (US$ Mn)
11.2. Middle East and Africa Micro mobile data center
market Revenue (US$ Mn) and Forecasts, By Rack Size
11.2.1. 5 - 25 RU
11.2.2. 26 - 50 RU
11.2.3. 51 - 100 RU
11.3. Middle East and Africa market Revenue (US$ Mn)
and Forecasts, By Application
11.3.1. Instant Data Center and Retrofit
11.3.2. High Density Networks
11.3.3. Remote Office Support
11.3.4. Mobile Computing
11.3.5. Others
11.4. Middle East and Africa Micro mobile data center
market Revenue (US$ Mn) and Forecasts, By Vertical
11.4.1. BFSI
11.4.2. Telecom and IT
11.4.3. Government
11.4.4. Energy
11.4.5. Healthcare
11.4.6. Education
11.4.7. Others
11.5. Middle East and Africa market Revenue (US$ Mn)
and Forecasts, By Country
11.5.1. GCC Countries
11.5.1.1.
GCC Countries Micro
mobile data center market Revenue (US$ Mn) and Forecasts, By Rack Size
11.5.1.1.1.
5 - 25 RU
11.5.1.1.2.
26 - 50 RU
11.5.1.1.3.
51 - 100 RU
11.5.1.2.
GCC Countries market
Revenue (US$ Mn) and Forecasts, By Application
11.5.1.2.1.
Instant Data
Center and Retrofit
11.5.1.2.2.
High Density
Networks
11.5.1.2.3.
Remote Office
Support
11.5.1.2.4.
Mobile Computing
11.5.1.2.5.
Others
11.5.1.3.
GCC Countries Micro
mobile data center market Revenue (US$ Mn) and Forecasts, By Vertical
11.5.1.3.1.
BFSI
11.5.1.3.2.
Telecom and IT
11.5.1.3.3.
Government
11.5.1.3.4.
Energy
11.5.1.3.5.
Healthcare
11.5.1.3.6.
Education
11.5.1.3.7.
Others
11.5.2. Southern Africa
11.5.2.1.
Southern Africa Micro
mobile data center market Revenue (US$ Mn) and Forecasts, By Rack Size
11.5.2.1.1.
5 - 25 RU
11.5.2.1.2.
26 - 50 RU
11.5.2.1.3.
51 - 100 RU
11.5.2.2.
Southern Africa market
Revenue (US$ Mn) and Forecasts, By Application
11.5.2.2.1.
Instant Data
Center and Retrofit
11.5.2.2.2.
High Density
Networks
11.5.2.2.3.
Remote Office
Support
11.5.2.2.4.
Mobile Computing
11.5.2.2.5.
Others
11.5.2.3.
Southern Africa Micro
mobile data center market Revenue (US$ Mn) and Forecasts, By Vertical
11.5.2.3.1.
BFSI
11.5.2.3.2.
Telecom and IT
11.5.2.3.3.
Government
11.5.2.3.4.
Energy
11.5.2.3.5.
Healthcare
11.5.2.3.6.
Education
11.5.2.3.7.
Others
11.5.3. Rest of MEA
11.5.3.1.
Rest of MEA Micro
mobile data center market Revenue (US$ Mn) and Forecasts, By Rack Size
11.5.3.1.1.
5 - 25 RU
11.5.3.1.2.
26 - 50 RU
11.5.3.1.3.
51 - 100 RU
11.5.3.2.
Rest of MEA market
Revenue (US$ Mn) and Forecasts, By Application
11.5.3.2.1.
Instant Data
Center and Retrofit
11.5.3.2.2.
High Density
Networks
11.5.3.2.3.
Remote Office
Support
11.5.3.2.4.
Mobile Computing
11.5.3.2.5.
Others
11.5.3.3.
Rest of MEA Micro
mobile data center market Revenue (US$ Mn) and Forecasts, By Vertical
11.5.3.3.1.
BFSI
11.5.3.3.2.
Telecom and IT
11.5.3.3.3.
Government
11.5.3.3.4.
Energy
11.5.3.3.5.
Healthcare
11.5.3.3.6.
Education
11.5.3.3.7.
Others
11.6. Key Segment for Channeling Investments
11.6.1. By Country
11.6.2. By Rack Size
11.6.3. By Application
11.6.4. By Vertical
12. Latin
America Micro mobile data center market Analysis and Forecasts, 2018 – 2026
12.1. Overview
12.1.1. Latin America market Revenue (US$ Mn)
12.2. Latin America Micro mobile data center market
Revenue (US$ Mn) and Forecasts, By Rack Size
12.2.1. 5 - 25 RU
12.2.2. 26 - 50 RU
12.2.3. 51 - 100 RU
12.3. Latin America market Revenue (US$ Mn) and
Forecasts, By Application
12.3.1. Instant Data Center and Retrofit
12.3.2. High Density Networks
12.3.3. Remote Office Support
12.3.4. Mobile Computing
12.3.5. Others
12.4. Latin America Micro mobile data center market
Revenue (US$ Mn) and Forecasts, By Vertical
12.4.1. BFSI
12.4.2. Telecom and IT
12.4.3. Government
12.4.4. Energy
12.4.5. Healthcare
12.4.6. Education
12.4.7. Others
12.5. Latin America market Revenue (US$ Mn) and Forecasts,
By Country
12.5.1. Brazil
12.5.1.1.
Brazil Micro
mobile data center market Revenue (US$ Mn) and Forecasts, By Rack Size
12.5.1.1.1.
5 - 25 RU
12.5.1.1.2.
26 - 50 RU
12.5.1.1.3.
51 - 100 RU
12.5.1.2.
Brazil market
Revenue (US$ Mn) and Forecasts, By Application
12.5.1.2.1.
Instant Data
Center and Retrofit
12.5.1.2.2.
High Density Networks
12.5.1.2.3.
Remote Office
Support
12.5.1.2.4.
Mobile Computing
12.5.1.2.5.
Others
12.5.1.3.
Brazil Micro
mobile data center market Revenue (US$ Mn) and Forecasts, By Vertical
12.5.1.3.1.
BFSI
12.5.1.3.2.
Telecom and IT
12.5.1.3.3.
Government
12.5.1.3.4.
Energy
12.5.1.3.5.
Healthcare
12.5.1.3.6.
Education
12.5.1.3.7.
Others
12.5.2. Rest of Latin America
12.5.2.1.
Rest of Latin
America Micro mobile data center market Revenue (US$ Mn) and Forecasts, By Rack
Size
12.5.2.1.1.
5 - 25 RU
12.5.2.1.2.
26 - 50 RU
12.5.2.1.3.
51 - 100 RU
12.5.2.2.
Rest of Latin
America market Revenue (US$ Mn) and Forecasts, By Application
12.5.2.2.1.
Instant Data
Center and Retrofit
12.5.2.2.2.
High Density
Networks
12.5.2.2.3.
Remote Office
Support
12.5.2.2.4.
Mobile Computing
12.5.2.2.5.
Others
12.5.2.3.
Rest of Latin
America Micro mobile data center market Revenue (US$ Mn) and Forecasts, By
Vertical
12.5.2.3.1.
BFSI
12.5.2.3.2.
Telecom and IT
12.5.2.3.3.
Government
12.5.2.3.4.
Energy
12.5.2.3.5.
Healthcare
12.5.2.3.6.
Education
12.5.2.3.7.
Others
12.6. Key Segment for Channeling Investments
12.6.1. By Country
12.6.2. By Rack Size
12.6.3. By Application
12.6.4. By Vertical
13. Competitive
Benchmarking
13.1. Player Positioning Analysis
13.2. Global Presence and Growth Strategies
14. Player
Profiles
14.1. Altron, AS
14.1.1. Company Details
14.1.2. Company Overview
14.1.3. Product Offerings
14.1.4. Key Developments
14.1.5. Financial Analysis
14.1.6. SWOT Analysis
14.1.7. Business Strategies
14.2. AST Modular (Schneider Electric)
14.2.1. Company Details
14.2.2. Company Overview
14.2.3. Product Offerings
14.2.4. Key Developments
14.2.5. Financial Analysis
14.2.6. SWOT Analysis
14.2.7. Business Strategies
14.3. Canovate
14.3.1. Company Details
14.3.2. Company Overview
14.3.3. Product Offerings
14.3.4. Key Developments
14.3.5. Financial Analysis
14.3.6. SWOT Analysis
14.3.7. Business Strategies
14.4. Dell
14.4.1. Company Details
14.4.2. Company Overview
14.4.3. Product Offerings
14.4.4. Key Developments
14.4.5. Financial Analysis
14.4.6. SWOT Analysis
14.4.7. Business Strategies
14.5. Huawei Technologies Co., Ltd.
14.5.1. Company Details
14.5.2. Company Overview
14.5.3. Product Offerings
14.5.4. Key Developments
14.5.5. Financial Analysis
14.5.6. SWOT Analysis
14.5.7. Business Strategies
14.6. Instant Data Centers, LLC.
14.6.1. Company Details
14.6.2. Company Overview
14.6.3. Product Offerings
14.6.4. Key Developments
14.6.5. Financial Analysis
14.6.6. SWOT Analysis
14.6.7. Business Strategies
14.7. Panduit
14.7.1. Company Details
14.7.2. Company Overview
14.7.3. Product Offerings
14.7.4. Key Developments
14.7.5. Financial Analysis
14.7.6. SWOT Analysis
14.7.7. Business Strategies
14.8. Rittal GmbH & Co. KG
14.8.1. Company Details
14.8.2. Company Overview
14.8.3. Product Offerings
14.8.4. Key Developments
14.8.5. Financial Analysis
14.8.6. SWOT Analysis
14.8.7. Business Strategies
14.9. Silicon Graphics international Corp.
14.9.1. Company Details
14.9.2. Company Overview
14.9.3. Product Offerings
14.9.4. Key Developments
14.9.5. Financial Analysis
14.9.6. SWOT Analysis
14.9.7. Business Strategies
14.10. Wave2Wave
14.10.1.
Company Details
14.10.2.
Company Overview
14.10.3.
Product Offerings
14.10.4.
Key Developments
14.10.5.
Financial
Analysis
14.10.6.
SWOT Analysis
14.10.7.
Business
Strategies
14.11. Zellabox
14.11.1.
Company Details
14.11.2.
Company Overview
14.11.3.
Product Offerings
14.11.4.
Key Developments
14.11.5.
Financial
Analysis
14.11.6.
SWOT Analysis
14.11.7.
Business
Strategies
Note: This ToC is tentative
and can be changed according to the research study conducted during the course
of report completion.
At Absolute Markets Insights, we are engaged in building both global as well as country specific reports. As a result, the approach taken for deriving the estimation and forecast for a specific country is a bit unique and different in comparison to the global research studies. In this case, we not only study the concerned market factors & trends prevailing in a particular country (from secondary research) but we also tend to calculate the actual market size & forecast from the revenue generated from the market participants involved in manufacturing or distributing the any concerned product. These companies can also be service providers. For analyzing any country specifically, we do consider the growth factors prevailing under the states/cities/county for the same. For instance, if we are analyzing an industry specific to United States, we primarily need to study about the states present under the same(where the product/service has the highest growth). Similar analysis will be followed by other countries. Our scope of the report changes with different markets.
Our research study is mainly implement through a mix of both secondary and primary research. Various sources such as industry magazines, trade journals, and government websites and trade associations are reviewed for gathering precise data. Primary interviews are conducted to validate the market size derived from secondary research. Industry experts, major manufacturers and distributors are contacted for further validation purpose on the current market penetration and growth trends.
Prominent participants in our primary research process include:
- Key Opinion Leaders namely the CEOs, CSOs, VPs, purchasing managers, amongst others
- Research and development participants, distributors/suppliers and subject matter experts
Secondary Research includes data extracted from paid data sources:
- Reuters
- Factiva
- Bloomberg
- One Source
- Hoovers
Research Methodology

Key Inclusions


