
Queue Management System Market By Deployment (Cloud Based, On Premise),By Type (Virtual Queuing, Linear Queuing), By Application (Hospitals & Clinics, Banks & Financial Institutions, Retail Outlets, Private Utility Service Providers/Airline Check in Counters, Self Service Restaurants, Government Offices, Telecom Service Centre, Others), By Region (North America, Europe, Asia Pacific, Latin America and Middle East & Africa)– Global Insights, Growth, Size, Comparative Analysis, Trends and Forecast, 2019 – 2027
Industry Trends
Global queue management system market was valued at US$ 420.30 million in 2018 and is expected to reach US$ 611.55 million by 2027, growing at an estimated CAGR of 4.3% over the forecast period. Increasing emphasis by firms on customer satisfaction would boost the queue management system market. Customers get easily frustrated due to disorganized queues leading to longer waiting times, which can hurt the company’s sales. It is estimated that 1 out of 3 potential customers leave the store without making any purchase if they are made to wait for more than 5 minutes in the queue. Hence, it is extremely important that firms adopt queue management system which can measure the customer flow and reduce the waiting time in queues, resulting in superior customer satisfaction.
Vendors currently offer linear queue and virtual queue solutions to firms across various industry verticals. Linear queue management is a traditional way of managing queues. In this system, a single line- first come first serve methodology is applied, which reduces the average waiting time by 30 minutes. However, virtual queue is the latest method which is immensely popular among firms. With the help of virtual queue, customers need not wait in the physical queue, instead an estimated time is given to the customer. During this time the customer can shop or relax which would result in increased customer satisfaction. Virtual queue management segment was valued at US$ 270.76 million in 2018, growing at an estimated CAGR of 4.4% over the next eight years.
Managing queues is extremely important in hospitals and clinics. Because of extended waiting times in the queue, patients are often bothered, thus leading to worsening medical conditions. Queue management systems which are designed for outpatient clinics, diagnostic centers etc. help in optimizing patient flows, resulting in superior customer experience. By application, hospitals and clinic segment was valued at US$ 97.04 million in 2018, exhibiting a significant growth rate over the forecast period.
Another factor which would drive the queue management system market, is the increase in staff efficiency which would result in employee satisfaction. With the help of queue management system, customer peak hours can be understood better. This data can be utilized by the company in deploying staff efficiently. This would ensure better management of customers. High cost of the queue management system software could be a concern for smaller firms to adopt the technology. However, technology such as mobile queuing which would further enhance the customer experience, is set to fuel the growth of the market in the coming years.
By region, North America held the largest market share in 2018, due to increase in demand from healthcare sector. However, Asia pacific is projected to mark the highest growth rate during the forecast period.
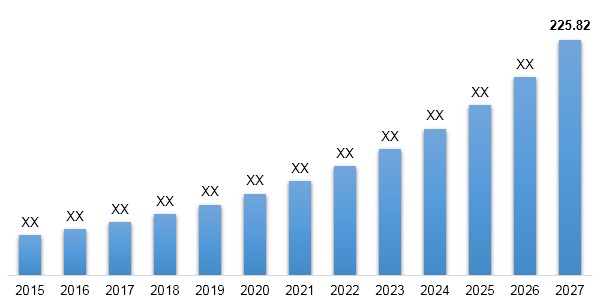
North America Queue Management System Market Revenue & Forecast, (US$ Million), 2015 – 2027
Competitive Landscape
The report provides both, qualitative and quantitative research of Queue Management System Market, as well as provides comprehensive insights and favored development methods adopted by the key contenders. The report also offers extensive research on the key players in this market and details on the competitiveness of these players. Key business strategies such as mergers and acquisitions (M&A), affiliations, collaborations, and contracts adopted by these major market participants are also recognized and analyzed in the report. For each company, the report studies their global presence, competitors, service offerings, specification, pricing, and gross margin.
Some of the players operating in the queue management system market are Advantech Co. Ltd., AKIS Technologies, QLess Company, XIPHIAS Software Technologies, Wavetec, InfraRed Integrated Systems Ltd, Lavi Industries, Multimex, AURIONPRO, ATT System Group, Qmagik, Onlinet, V-Count, Skiplino, Qudini, Qnomy, Qminder Ltd, Qmatic. amongst others.

Queue Management System Market:
- By Deployment
- Cloud Based
- On Premise
- By Type:
- Virtual Queuing
- Linear Queuing
- By Application:
- Hospitals & Clinics
- Banks & Financial Institutions
- Retail Outlets
- Private Utility Service Providers/Airline Check in Counters
- Self Service Restaurants
- Government Offices
- Telecom Service Centre
- Others
- By Geography
- North America
- U.S.
- Canada
- Mexico
- Europe
- France
- The UK
- Spain
- Germany
- Italy
- Nordic Countries
- Denmark
- Finland
- Iceland
- Norway
- Sweden
- Benelux Union
- Belgium
- The Netherlands
- Luxemburg
- Rest of Europe
- Asia Pacific
- China
- Japan
- India
- New Zealand
- Australia
- South Korea
- Southeast Asia
- Indonesia
- Thailand
- Malaysia
- Singapore
- Rest of Southeast Asia
- Rest of Asia Pacific
- Middle East & Africa
- Saudi Arabia
- UAE
- Egypt
- Kuwait
- South Africa
- Rest of Middle East & Africa
- Latin America
- Brazil
- Argentina
- Rest of Latin America
- North America
Table of Contents
![]()
1. Market
Scope
1.1. Market
Segmentation
1.2. Years
Considered
1.2.1. Historic
Years: 2015 - 2017
1.2.2. Base
Year: 2018
1.2.3. Forecast
Years: 2019 – 2027
2. Key Target
Audiences
3. Research
Methodology
3.1. Primary
Research
3.1.1. Research
Questionnaire
3.1.2. Global
Percentage Breakdown
3.1.3. Primary
Interviews: Key Opinion Leaders (KOLs)
3.2. Secondary
Research
3.2.1. Paid
Databases
3.2.2. Secondary
Sources
3.3. Market
Size Estimates
3.3.1. Top-Down
Approach
3.3.2. Bottom-Up
Approach
3.4. Data
Triangulation Methodology
3.5. Research
Assumptions
4. Recommendations
and Insights from AMI’s Perspective**
5. Holistic
Overview of Queue Management System Market
6. Market
Synopsis:Â Queue Management System Market
7. Queue
Management System Market Analysis: Qualitative Perspective
7.1. Introduction
7.1.1. Product
Definition
7.1.2. Industry
Development
7.2. Market
Dynamics
7.2.1. Drivers
7.2.2. Restraints
7.2.3. Opportunities
7.3. Trends in
Queue Management System Market
7.4. Market
Determinants Radar Chart
7.5. Macro-Economic
and Micro-Economic Indicators: Queue Management System Market
7.6. Porter’s Five Force Analysis
8. Global
Queue Management System Market Analysis and Forecasts, 2019 – 2027
8.1. Overview
8.1.1. Global
Queue Management System Market Revenue (US$ Mn)
8.2. Global
Queue Management System Market Revenue (US$ Mn) and Forecasts, By Deployment
8.2.1. Cloud
Based
8.2.1.1. Definition
8.2.1.2. Market
Estimation and Penetration, 2015 – 2018
8.2.1.3. Market
Forecast, 2019 – 2027
8.2.1.4. Compound
Annual Growth Rate (CAGR)
8.2.1.5. Regional
Bifurcation
8.2.1.5.1. North
America
8.2.1.5.1.1. Market
Estimation, 2015 – 2018
8.2.1.5.1.2. Market
Forecast, 2019 – 2027
8.2.1.5.2. Europe
8.2.1.5.2.1. Market
Estimation, 2015 – 2018
8.2.1.5.2.2. Market
Forecast, 2019 – 2027
8.2.1.5.3. Asia
Pacific
8.2.1.5.3.1. Market
Estimation, 2015 – 2018
8.2.1.5.3.2. Market
Forecast, 2019 – 2027
8.2.1.5.4. Middle
East and Africa
8.2.1.5.4.1. Market
Estimation, 2015 – 2018
8.2.1.5.4.2. Market
Forecast, 2019 – 2027
8.2.1.5.5. Latin
America
8.2.1.5.5.1. Market
Estimation, 2015 – 2018
8.2.1.5.5.2. Market
Forecast, 2019 – 2027
8.2.2. On
Premise
8.2.2.1. Definition
8.2.2.2. Market
Estimation and Penetration, 2015 – 2018
8.2.2.3. Market
Forecast, 2019 – 2027
8.2.2.4. Compound
Annual Growth Rate (CAGR)
8.2.2.5. Regional
Bifurcation
8.2.2.5.1. North
America
8.2.2.5.1.1. Market
Estimation, 2015 – 2018
8.2.2.5.1.2. Market
Forecast, 2019 – 2027
8.2.2.5.2. Europe
8.2.2.5.2.1. Market
Estimation, 2015 – 2018
8.2.2.5.2.2. Market
Forecast, 2019 – 2027
8.2.2.5.3. Asia
Pacific
8.2.2.5.3.1. Market
Estimation, 2015 – 2018
8.2.2.5.3.2. Market
Forecast, 2019 – 2027
8.2.2.5.4. Middle
East and Africa
8.2.2.5.4.1. Market
Estimation, 2015 – 2018
8.2.2.5.4.2. Market
Forecast, 2019 – 2027
8.2.2.5.5. Latin
America
8.2.2.5.5.1. Market
Estimation, 2015 – 2018
8.2.2.5.5.2. Market
Forecast, 2019 – 2027
8.3. Key Segment
for Channeling Investments
8.3.1. By
Deployment
9. Global
Queue Management System Market Analysis and Forecasts, 2019 – 2027
9.1. Overview
9.2. Global
Queue Management System Market Revenue (US$ Mn) and Forecasts, By Type
9.2.1. Virtual
Queuing
9.2.1.1. Definition
9.2.1.2. Market
Estimation and Penetration, 2015 – 2018
9.2.1.3. Market
Forecast, 2019 – 2027
9.2.1.4. Compound
Annual Growth Rate (CAGR)
9.2.1.5. Regional
Bifurcation
9.2.1.5.1. North
America
9.2.1.5.1.1. Market
Estimation, 2015 – 2018
9.2.1.5.1.2. Market
Forecast, 2019 – 2027
9.2.1.5.2. Europe
9.2.1.5.2.1. Market
Estimation, 2015 – 2018
9.2.1.5.2.2. Market
Forecast, 2019 – 2027
9.2.1.5.3. Asia
Pacific
9.2.1.5.3.1. Market
Estimation, 2015 – 2018
9.2.1.5.3.2. Market
Forecast, 2019 – 2027
9.2.1.5.4. Middle
East and Africa
9.2.1.5.4.1. Market
Estimation, 2015 – 2018
9.2.1.5.4.2. Market
Forecast, 2019 – 2027
9.2.1.5.5. Latin
America
9.2.1.5.5.1. Market
Estimation, 2015 – 2018
9.2.1.5.5.2. Market
Forecast, 2019 – 2027
9.2.2. Linear
Queuing
9.2.2.1. Definition
9.2.2.2. Market
Estimation and Penetration, 2015 – 2018
9.2.2.3. Market
Forecast, 2019 – 2027
9.2.2.4. Compound
Annual Growth Rate (CAGR)
9.2.2.5. Regional
Bifurcation
9.2.2.5.1. North
America
9.2.2.5.1.1. Market
Estimation, 2015 – 2018
9.2.2.5.1.2. Market
Forecast, 2019 – 2027
9.2.2.5.2. Europe
9.2.2.5.2.1. Market
Estimation, 2015 – 2018
9.2.2.5.2.2. Market
Forecast, 2019 – 2027
9.2.2.5.3. Asia
Pacific
9.2.2.5.3.1. Market
Estimation, 2015 – 2018
9.2.2.5.3.2. Market
Forecast, 2019 – 2027
9.2.2.5.4. Middle
East and Africa
9.2.2.5.4.1. Market
Estimation, 2015 – 2018
9.2.2.5.4.2. Market
Forecast, 2019 – 2027
9.2.2.5.5. Latin
America
9.2.2.5.5.1. Market
Estimation, 2015 – 2018
9.2.2.5.5.2. Market
Forecast, 2019 – 2027
9.3. Key
Segment for Channeling Investments
9.3.1. By Type
10. Global
Queue Management System Market Analysis and Forecasts, 2019 – 2027
10.1. Overview
10.2. Global
Queue Management System Market Revenue (US$ Mn) and Forecasts, By Application
10.2.1. Hospitals
and Clinics
10.2.1.1. Definition
10.2.1.2. Market
Estimation and Penetration, 2015 – 2018
10.2.1.3. Market
Forecast, 2019 – 2027
10.2.1.4. Compound
Annual Growth Rate (CAGR)
10.2.1.5. Regional
Bifurcation
10.2.1.5.1. North
America
10.2.1.5.1.1. Market
Estimation, 2015 – 2018
10.2.1.5.1.2. Market
Forecast, 2019 – 2027
10.2.1.5.2. Europe
10.2.1.5.2.1. Market
Estimation, 2015 – 2018
10.2.1.5.2.2. Market
Forecast, 2019 – 2027
10.2.1.5.3. Asia
Pacific
10.2.1.5.3.1. Market
Estimation, 2015 – 2018
10.2.1.5.3.2. Market
Forecast, 2019 – 2027
10.2.1.5.4. Middle
East and Africa
10.2.1.5.4.1. Market
Estimation, 2015 – 2018
10.2.1.5.4.2. Market
Forecast, 2019 – 2027
10.2.1.5.5. Latin
America
10.2.1.5.5.1. Market
Estimation, 2015 – 2018
10.2.1.5.5.2. Market
Forecast, 2019 – 2027
10.2.2. Banks
and Financial Institutions
10.2.2.1. Definition
10.2.2.2. Market
Estimation and Penetration, 2015 – 2018
10.2.2.3. Market
Forecast, 2019 – 2027
10.2.2.4. Compound
Annual Growth Rate (CAGR)
10.2.2.5. Regional
Bifurcation
10.2.2.5.1. North
America
10.2.2.5.1.1. Market
Estimation, 2015 – 2018
10.2.2.5.1.2. Market
Forecast, 2019 – 2027
10.2.2.5.2. Europe
10.2.2.5.2.1. Market
Estimation, 2015 – 2018
10.2.2.5.2.2. Market
Forecast, 2019 – 2027
10.2.2.5.3. Asia
Pacific
10.2.2.5.3.1. Market
Estimation, 2015 – 2018
10.2.2.5.3.2. Market
Forecast, 2019 – 2027
10.2.2.5.4. Middle
East and Africa
10.2.2.5.4.1. Market
Estimation, 2015 – 2018
10.2.2.5.4.2. Market
Forecast, 2019 – 2027
10.2.2.5.5. Latin
America
10.2.2.5.5.1. Market
Estimation, 2015 – 2018
10.2.2.5.5.2. Market
Forecast, 2019 – 2027
10.2.3. Retail
Outlets
10.2.3.1. Definition
10.2.3.2. Market
Estimation and Penetration, 2015 – 2018
10.2.3.3. Market
Forecast, 2019 – 2027
10.2.3.4. Compound
Annual Growth Rate (CAGR)
10.2.3.5. Regional
Bifurcation
10.2.3.5.1. North
America
10.2.3.5.1.1. Market
Estimation, 2015 – 2018
10.2.3.5.1.2. Market
Forecast, 2019 – 2027
10.2.3.5.2. Europe
10.2.3.5.2.1. Market
Estimation, 2015 – 2018
10.2.3.5.2.2. Market
Forecast, 2019 – 2027
10.2.3.5.3. Asia
Pacific
10.2.3.5.3.1. Market
Estimation, 2015 – 2018
10.2.3.5.3.2. Market
Forecast, 2019 – 2027
10.2.3.5.4. Middle
East and Africa
10.2.3.5.4.1. Market
Estimation, 2015 – 2018
10.2.3.5.4.2. Market
Forecast, 2019 – 2027
10.2.3.5.5. Latin
America
10.2.3.5.5.1. Market
Estimation, 2015 – 2018
10.2.3.5.5.2. Market
Forecast, 2019 – 2027
10.2.4. Private
Utility Service Providers/Airline Check in Counters
10.2.4.1. Definition
10.2.4.2. Market
Estimation and Penetration, 2015 – 2018
10.2.4.3. Market
Forecast, 2019 – 2027
10.2.4.4. Compound
Annual Growth Rate (CAGR)
10.2.4.5. Regional
Bifurcation
10.2.4.5.1. North
America
10.2.4.5.1.1. Market
Estimation, 2015 – 2018
10.2.4.5.1.2. Market
Forecast, 2019 – 2027
10.2.4.5.2. Europe
10.2.4.5.2.1. Market
Estimation, 2015 – 2018
10.2.4.5.2.2. Market
Forecast, 2019 – 2027
10.2.4.5.3. Asia
Pacific
10.2.4.5.3.1. Market
Estimation, 2015 – 2018
10.2.4.5.3.2. Market
Forecast, 2019 – 2027
10.2.4.5.4. Middle
East and Africa
10.2.4.5.4.1. Market
Estimation, 2015 – 2018
10.2.4.5.4.2. Market
Forecast, 2019 – 2027
10.2.4.5.5. Latin
America
10.2.4.5.5.1. Market
Estimation, 2015 – 2018
10.2.4.5.5.2. Market
Forecast, 2019 – 2027
10.2.5. Self
Service Restaurants
10.2.5.1. Definition
10.2.5.2. Market
Estimation and Penetration, 2015 – 2018
10.2.5.3. Market
Forecast, 2019 – 2027
10.2.5.4. Compound
Annual Growth Rate (CAGR)
10.2.5.5. Regional
Bifurcation
10.2.5.5.1. North
America
10.2.5.5.1.1. Market
Estimation, 2015 – 2018
10.2.5.5.1.2. Market
Forecast, 2019 – 2027
10.2.5.5.2. Europe
10.2.5.5.2.1. Market
Estimation, 2015 – 2018
10.2.5.5.2.2. Market
Forecast, 2019 – 2027
10.2.5.5.3. Asia
Pacific
10.2.5.5.3.1. Market
Estimation, 2015 – 2018
10.2.5.5.3.2. Market
Forecast, 2019 – 2027
10.2.5.5.4. Middle
East and Africa
10.2.5.5.4.1. Market
Estimation, 2015 – 2018
10.2.5.5.4.2. Market
Forecast, 2019 – 2027
10.2.5.5.5. Latin
America
10.2.5.5.5.1. Market
Estimation, 2015 – 2018
10.2.5.5.5.2. Market
Forecast, 2019 – 2027
10.2.6. Government
Offices
10.2.6.1. Definition
10.2.6.2. Market
Estimation and Penetration, 2015 – 2018
10.2.6.3. Market
Forecast, 2019 – 2027
10.2.6.4. Compound
Annual Growth Rate (CAGR)
10.2.6.5. Regional
Bifurcation
10.2.6.5.1. North
America
10.2.6.5.1.1. Market
Estimation, 2015 – 2018
10.2.6.5.1.2. Market
Forecast, 2019 – 2027
10.2.6.5.2. Europe
10.2.6.5.2.1. Market
Estimation, 2015 – 2018
10.2.6.5.2.2. Market
Forecast, 2019 – 2027
10.2.6.5.3. Asia
Pacific
10.2.6.5.3.1. Market
Estimation, 2015 – 2018
10.2.6.5.3.2. Market
Forecast, 2019 – 2027
10.2.6.5.4. Middle
East and Africa
10.2.6.5.4.1. Market
Estimation, 2015 – 2018
10.2.6.5.4.2. Market
Forecast, 2019 – 2027
10.2.6.5.5. Latin
America
10.2.6.5.5.1. Market
Estimation, 2015 – 2018
10.2.6.5.5.2. Market
Forecast, 2019 – 2027
10.2.7. Telecom
Service Center
10.2.7.1. Definition
10.2.7.2. Market
Estimation and Penetration, 2015 – 2018
10.2.7.3. Market
Forecast, 2019 – 2027
10.2.7.4. Compound
Annual Growth Rate (CAGR)
10.2.7.5. Regional
Bifurcation
10.2.7.5.1. North
America
10.2.7.5.1.1. Market
Estimation, 2015 – 2018
10.2.7.5.1.2. Market
Forecast, 2019 – 2027
10.2.7.5.2. Europe
10.2.7.5.2.1. Market
Estimation, 2015 – 2018
10.2.7.5.2.2. Market
Forecast, 2019 – 2027
10.2.7.5.3. Asia
Pacific
10.2.7.5.3.1. Market
Estimation, 2015 – 2018
10.2.7.5.3.2. Market
Forecast, 2019 – 2027
10.2.7.5.4. Middle
East and Africa
10.2.7.5.4.1. Market
Estimation, 2015 – 2018
10.2.7.5.4.2. Market
Forecast, 2019 – 2027
10.2.7.5.5. Latin
America
10.2.7.5.5.1. Market
Estimation, 2015 – 2018
10.2.7.5.5.2. Market
Forecast, 2019 – 2027
10.2.8. Others
10.2.8.1. Definition
10.2.8.2. Market
Estimation and Penetration, 2015 – 2018
10.2.8.3. Market
Forecast, 2019 – 2027
10.2.8.4. Compound
Annual Growth Rate (CAGR)
10.2.8.5. Regional
Bifurcation
10.2.8.5.1. North
America
10.2.8.5.1.1. Market
Estimation, 2015 – 2018
10.2.8.5.1.2. Market
Forecast, 2019 – 2027
10.2.8.5.2. Europe
10.2.8.5.2.1. Market
Estimation, 2015 – 2018
10.2.8.5.2.2. Market
Forecast, 2019 – 2027
10.2.8.5.3. Asia
Pacific
10.2.8.5.3.1. Market
Estimation, 2015 – 2018
10.2.8.5.3.2. Market
Forecast, 2019 – 2027
10.2.8.5.4. Middle
East and Africa
10.2.8.5.4.1. Market
Estimation, 2015 – 2018
10.2.8.5.4.2. Market
Forecast, 2019 – 2027
10.2.8.5.5. Latin
America
10.2.8.5.5.1. Market
Estimation, 2015 – 2018
10.2.8.5.5.2. Market
Forecast, 2019 – 2027
10.3. Key
Segment for Channeling Investments
10.3.1. By
Application
11. North
America Queue Management System Market Analysis and Forecasts, 2019 - 2027
11.1. Overview
11.1.1. North
America Queue Management System Market Revenue (US$ Mn)
11.2. North
America Queue Management System Market Revenue (US$ Mn) and Forecasts, By
Deployment
11.2.1. Cloud
Based
11.2.2. On
Premise
11.3. North
America Queue Management System Market Revenue (US$ Mn) and Forecasts, By Type
11.3.1. Virtual
Queuing
11.3.2. Linear
Queuing
11.4. North
America Queue Management System Market Revenue (US$ Mn) and Forecasts, By
Application
11.4.1. Hospitals
and Clinics
11.4.2. Banks
and Financial Institutions
11.4.3. Retail
Outlets
11.4.4. Private
Utility Service Providers/Airline Check in Counters
11.4.5. Self
Service Restaurants
11.4.6. Government
Offices
11.4.7. Telecom
Service Center
11.4.8. Others
11.5. North
America Queue Management System Market Revenue (US$ Mn) and Forecasts, By
Country
11.5.1. U.S
11.5.1.1. U.S
Queue Management System Market Revenue (US$ Mn) and Forecasts, By Deployment
11.5.1.1.1. Cloud
Based
11.5.1.1.2. On
Premise
11.5.1.2. U.S
Queue Management System Market Revenue (US$ Mn) and Forecasts, By Type
11.5.1.2.1. Virtual
Queuing
11.5.1.2.2. Linear
Queuing
11.5.1.3. U.S
Queue Management System Market Revenue (US$ Mn) and Forecasts, By Application
11.5.1.3.1. Hospitals
and Clinics
11.5.1.3.2. Banks
and Financial Institutions
11.5.1.3.3. Retail
Outlets
11.5.1.3.4. Private
Utility Service Providers/Airline Check in Counters
11.5.1.3.5. Self
Service Restaurants
11.5.1.3.6. Government
Offices
11.5.1.3.7. Telecom
Service Center
11.5.1.3.8. Others
11.5.2. Canada
11.5.2.1. Canada
Queue Management System Market Revenue (US$ Mn) and Forecasts, By Deployment
11.5.2.1.1. Cloud
Based
11.5.2.1.2. On
Premise
11.5.2.2. Canada
Queue Management System Market Revenue (US$ Mn) and Forecasts, By Type
11.5.2.2.1. Virtual
Queuing
11.5.2.2.2. Linear
Queuing
11.5.2.3. Canada
Queue Management System Market Revenue (US$ Mn) and Forecasts, By Application
11.5.2.3.1. Hospitals
and Clinics
11.5.2.3.2. Banks
and Financial Institutions
11.5.2.3.3. Retail
Outlets
11.5.2.3.4. Private
Utility Service Providers/Airline Check in Counters
11.5.2.3.5. Self
Service Restaurants
11.5.2.3.6. Government
Offices
11.5.2.3.7. Telecom
Service Center
11.5.2.3.8. Others
11.5.3. Mexico
11.5.3.1. Mexico
Queue Management System Market Revenue (US$ Mn) and Forecasts, By Deployment
11.5.3.1.1. Cloud
Based
11.5.3.1.2. On
Premise
11.5.3.2. Mexico
Queue Management System Market Revenue (US$ Mn) and Forecasts, By Type
11.5.3.2.1. Virtual
Queuing
11.5.3.2.2. Linear
Queuing
11.5.3.3. Mexico
Queue Management System Market Revenue (US$ Mn) and Forecasts, By Application
11.5.3.3.1. Hospitals
and Clinics
11.5.3.3.2. Banks
and Financial Institutions
11.5.3.3.3. Retail
Outlets
11.5.3.3.4. Private
Utility Service Providers/Airline Check in Counters
11.5.3.3.5. Self
Service Restaurants
11.5.3.3.6. Government
Offices
11.5.3.3.7. Telecom
Service Center
11.5.3.3.8. Others
11.5.4. Rest of
North America
11.5.4.1. Rest
of North America Queue Management System Market Revenue (US$ Mn) and Forecasts,
By Deployment
11.5.4.1.1. Cloud
Based
11.5.4.1.2. On
Premise
11.5.4.2. Rest
of North America Queue Management System Market Revenue (US$ Mn) and Forecasts,
By Type
11.5.4.2.1. Virtual
Queuing
11.5.4.2.2. Linear
Queuing
11.5.4.3. Rest
of North America Queue Management System Market Revenue (US$ Mn) and Forecasts,
By Application
11.5.4.3.1. Hospitals
and Clinics
11.5.4.3.2. Banks
and Financial Institutions
11.5.4.3.3. Retail
Outlets
11.5.4.3.4. Private
Utility Service Providers/Airline Check in Counters
11.5.4.3.5. Self
Service Restaurants
11.5.4.3.6. Government
Offices
11.5.4.3.7. Telecom
Service Center
11.5.4.3.8. Others
11.6. Key
Segment for Channeling Investments
11.6.1. By
Country
11.6.2. By
Deployment
11.6.3. By Type
11.6.4. By
Application
12. Europe
Queue Management System Market Analysis and Forecasts, 2019 - 2027
12.1. Overview
12.1.1. Europe
Queue Management System Market Revenue (US$ Mn)
12.2. Europe
Queue Management System Market Revenue (US$ Mn) and Forecasts, By Deployment
12.2.1. Cloud
Based
12.2.2. On
Premise
12.3. Europe
Queue Management System Market Revenue (US$ Mn) and Forecasts, By Type
12.3.1. Virtual
Queuing
12.3.2. Linear
Queuing
12.4. Europe
Queue Management System Market Revenue (US$ Mn) and Forecasts, By Application
12.4.1. Hospitals
and Clinics
12.4.2. Banks
and Financial Institutions
12.4.3. Retail
Outlets
12.4.4. Private
Utility Service Providers/Airline Check in Counters
12.4.5. Self
Service Restaurants
12.4.6. Government
Offices
12.4.7. Telecom
Service Center
12.4.8. Others
12.5. Europe
Queue Management System Market Revenue (US$ Mn) and Forecasts, By Country
12.5.1. France
12.5.1.1. France
Queue Management System Market Revenue (US$ Mn) and Forecasts, By Deployment
12.5.1.1.1. Cloud
Based
12.5.1.1.2. On
Premise
12.5.1.2. France
Queue Management System Market Revenue (US$ Mn) and Forecasts, By Type
12.5.1.2.1. Virtual
Queuing
12.5.1.2.2. Linear
Queuing
12.5.1.3. France
Queue Management System Market Revenue (US$ Mn) and Forecasts, By Application
12.5.1.3.1. Hospitals
and Clinics
12.5.1.3.2. Banks
and Financial Institutions
12.5.1.3.3. Retail
Outlets
12.5.1.3.4. Private
Utility Service Providers/Airline Check in Counters
12.5.1.3.5. Self
Service Restaurants
12.5.1.3.6. Government
Offices
12.5.1.3.7. Telecom
Service Center
12.5.1.3.8. Others
12.5.2. The UK
12.5.2.1. The
UK Queue Management System Market Revenue (US$ Mn) and Forecasts, By Deployment
12.5.2.1.1. Cloud
Based
12.5.2.1.2. On
Premise
12.5.2.2. The
UK Queue Management System Market Revenue (US$ Mn) and Forecasts, By Type
12.5.2.2.1. Virtual
Queuing
12.5.2.2.2. Linear
Queuing
12.5.2.3. The
UK Queue Management System Market Revenue (US$ Mn) and Forecasts, By
Application
12.5.2.3.1. Hospitals
and Clinics
12.5.2.3.2. Banks
and Financial Institutions
12.5.2.3.3. Retail
Outlets
12.5.2.3.4. Private
Utility Service Providers/Airline Check in Counters
12.5.2.3.5. Self
Service Restaurants
12.5.2.3.6. Government
Offices
12.5.2.3.7. Telecom
Service Center
12.5.2.3.8. Others
12.5.3. Spain
12.5.3.1. Spain
Queue Management System Market Revenue (US$ Mn) and Forecasts, By Deployment
12.5.3.1.1. Cloud
Based
12.5.3.1.2. On
Premise
12.5.3.2. Spain
Queue Management System Market Revenue (US$ Mn) and Forecasts, By Type
12.5.3.2.1. Virtual
Queuing
12.5.3.2.2. Linear
Queuing
12.5.3.3. Spain
Queue Management System Market Revenue (US$ Mn) and Forecasts, By Application
12.5.3.3.1. Hospitals
and Clinics
12.5.3.3.2. Banks
and Financial Institutions
12.5.3.3.3. Retail
Outlets
12.5.3.3.4. Private
Utility Service Providers/Airline Check in Counters
12.5.3.3.5. Self
Service Restaurants
12.5.3.3.6. Government
Offices
12.5.3.3.7. Telecom
Service Center
12.5.3.3.8. Others
12.5.4. Germany
12.5.4.1. Germany
Queue Management System Market Revenue (US$ Mn) and Forecasts, By Deployment
12.5.4.1.1. Cloud
Based
12.5.4.1.2. On
Premise
12.5.4.2. Germany
Queue Management System Market Revenue (US$ Mn) and Forecasts, By Type
12.5.4.2.1. Virtual
Queuing
12.5.4.2.2. Linear
Queuing
12.5.4.3. Germany
Queue Management System Market Revenue (US$ Mn) and Forecasts, By Application
12.5.4.3.1. Hospitals
and Clinics
12.5.4.3.2. Banks
and Financial Institutions
12.5.4.3.3. Retail
Outlets
12.5.4.3.4. Private
Utility Service Providers/Airline Check in Counters
12.5.4.3.5. Self
Service Restaurants
12.5.4.3.6. Government
Offices
12.5.4.3.7. Telecom
Service Center
12.5.4.3.8. Others
12.5.5. Italy
12.5.5.1. Italy
Queue Management System Market Revenue (US$ Mn) and Forecasts, By Deployment
12.5.5.1.1. Cloud
Based
12.5.5.1.2. On
Premise
12.5.5.2. Italy
Queue Management System Market Revenue (US$ Mn) and Forecasts, By Type
12.5.5.2.1. Virtual
Queuing
12.5.5.2.2. Linear
Queuing
12.5.5.3. Italy
Queue Management System Market Revenue (US$ Mn) and Forecasts, By Application
12.5.5.3.1. Hospitals
and Clinics
12.5.5.3.2. Banks
and Financial Institutions
12.5.5.3.3. Retail
Outlets
12.5.5.3.4. Private
Utility Service Providers/Airline Check in Counters
12.5.5.3.5. Self
Service Restaurants
12.5.5.3.6. Government
Offices
12.5.5.3.7. Telecom
Service Center
12.5.5.3.8. Others
12.5.6. Nordic
Countries
12.5.6.1. Nordic
Countries Queue Management System Market Revenue (US$ Mn) and Forecasts, By
Deployment
12.5.6.1.1. Cloud
Based
12.5.6.1.2. On
Premise
12.5.6.2. Nordic
Countries Queue Management System Market Revenue (US$ Mn) and Forecasts, By
Type
12.5.6.2.1. Virtual
Queuing
12.5.6.2.2. Linear
Queuing
12.5.6.3. Nordic
Countries Queue Management System Market Revenue (US$ Mn) and Forecasts, By
Application
12.5.6.3.1. Hospitals
and Clinics
12.5.6.3.2. Banks
and Financial Institutions
12.5.6.3.3. Retail
Outlets
12.5.6.3.4. Private
Utility Service Providers/Airline Check in Counters
12.5.6.3.5. Self
Service Restaurants
12.5.6.3.6. Government
Offices
12.5.6.3.7. Telecom
Service Center
12.5.6.3.8. Others
12.5.6.4. Nordic
Countries Queue Management System Market Revenue (US$ Mn) and Forecasts, By
Country
12.5.6.4.1. Denmark
12.5.6.4.2. Finland
12.5.6.4.3. Iceland
12.5.6.4.4. Sweden
12.5.6.4.5. Norway
12.5.7. Benelux
Union
12.5.7.1. Benelux
Union Queue Management System Market Revenue (US$ Mn) and Forecasts, By
Deployment
12.5.7.1.1. Cloud
Based
12.5.7.1.2. On
Premise
12.5.7.2. Benelux
Union Queue Management System Market Revenue (US$ Mn) and Forecasts, By Type
12.5.7.2.1. Virtual
Queuing
12.5.7.2.2. Linear
Queuing
12.5.7.3. Benelux
Union Queue Management System Market Revenue (US$ Mn) and Forecasts, By
Application
12.5.7.3.1. Hospitals
and Clinics
12.5.7.3.2. Banks
and Financial Institutions
12.5.7.3.3. Retail
Outlets
12.5.7.3.4. Private
Utility Service Providers/Airline Check in Counters
12.5.7.3.5. Self
Service Restaurants
12.5.7.3.6. Government
Offices
12.5.7.3.7. Telecom
Service Center
12.5.7.3.8. Others
12.5.7.4. Benelux
Union Queue Management System Market Revenue (US$ Mn) and Forecasts, By Country
12.5.7.4.1. Belgium
12.5.7.4.2. The
Netherlands
12.5.7.4.3. Luxembourg
12.5.8. Rest of
Europe
12.5.8.1. Rest
of Europe Queue Management System Market Revenue (US$ Mn) and Forecasts, By
Deployment
12.5.8.1.1. Cloud
Based
12.5.8.1.2. On
Premise
12.5.8.2. Rest
of Europe Queue Management System Market Revenue (US$ Mn) and Forecasts, By
Type
12.5.8.2.1. Virtual
Queuing
12.5.8.2.2. Linear
Queuing
12.5.8.3. Rest
of Europe Queue Management System Market Revenue (US$ Mn) and Forecasts, By
Application
12.5.8.3.1. Hospitals
and Clinics
12.5.8.3.2. Banks
and Financial Institutions
12.5.8.3.3. Retail
Outlets
12.5.8.3.4. Private
Utility Service Providers/Airline Check in Counters
12.5.8.3.5. Self
Service Restaurants
12.5.8.3.6. Government
Offices
12.5.8.3.7. Telecom
Service Center
12.5.8.3.8. Others
12.6. Key
Segment for Channeling Investments
12.6.1. By
Country
12.6.2. By
Deployment
12.6.3. By Type
12.6.4. By
Application
13. Asia
Pacific Queue Management System Market Analysis and Forecasts, 2019 - 2027
13.1. Overview
13.1.1. Asia
Pacific Queue Management System Market Revenue (US$ Mn)
13.2. Asia
Pacific Queue Management System Market Revenue (US$ Mn) and Forecasts, By
Deployment
13.2.1. Cloud
Based
13.2.2. On Premise
13.3. Asia
Pacific Queue Management System Market Revenue (US$ Mn) and Forecasts, By Type
13.3.1. Virtual
Queuing
13.3.2. Linear
Queuing
13.4. Asia
Pacific Queue Management System Market Revenue (US$ Mn) and Forecasts, By
Application
13.4.1. Hospitals
and Clinics
13.4.2. Banks
and Financial Institutions
13.4.3. Retail
Outlets
13.4.4. Private
Utility Service Providers/Airline Check in Counters
13.4.5. Self
Service Restaurants
13.4.6. Government
Offices
13.4.7. Telecom
Service Center
13.4.8. Others
13.5. Asia
Pacific Queue Management System Market Revenue (US$ Mn) and Forecasts, By
Country
13.5.1. China
13.5.1.1. China
Queue Management System Market Revenue (US$ Mn) and Forecasts, By Deployment
13.5.1.1.1. Cloud
Based
13.5.1.1.2. On
Premise
13.5.1.2. China
Queue Management System Market Revenue (US$ Mn) and Forecasts, By Type
13.5.1.2.1. Virtual
Queuing
13.5.1.2.2. Linear
Queuing
13.5.1.3. China
Queue Management System Market Revenue (US$ Mn) and Forecasts, By Application
13.5.1.3.1. Hospitals
and Clinics
13.5.1.3.2. Banks
and Financial Institutions
13.5.1.3.3. Retail
Outlets
13.5.1.3.4. Private
Utility Service Providers/Airline Check in Counters
13.5.1.3.5. Self
Service Restaurants
13.5.1.3.6. Government
Offices
13.5.1.3.7. Telecom
Service Center
13.5.1.3.8. Others
13.5.2. Japan
13.5.2.1. Japan
Queue Management System Market Revenue (US$ Mn) and Forecasts, By Deployment
13.5.2.1.1. Cloud
Based
13.5.2.1.2. On
Premise
13.5.2.2. Japan
Queue Management System Market Revenue (US$ Mn) and Forecasts, By Type
13.5.2.2.1. Virtual
Queuing
13.5.2.2.2. Linear
Queuing
13.5.2.3. Japan
Queue Management System Market Revenue (US$ Mn) and Forecasts, By Application
13.5.2.3.1. Hospitals
and Clinics
13.5.2.3.2. Banks
and Financial Institutions
13.5.2.3.3. Retail
Outlets
13.5.2.3.4. Private
Utility Service Providers/Airline Check in Counters
13.5.2.3.5. Self
Service Restaurants
13.5.2.3.6. Government
Offices
13.5.2.3.7. Telecom
Service Center
13.5.2.3.8. Others
13.5.3. India
13.5.3.1. India
Queue Management System Market Revenue (US$ Mn) and Forecasts, By Deployment
13.5.3.1.1. Cloud
Based
13.5.3.1.2. On
Premise
13.5.3.2. India
Queue Management System Market Revenue (US$ Mn) and Forecasts, By Type
13.5.3.2.1. Virtual
Queuing
13.5.3.2.2. Linear
Queuing
13.5.3.3. India
Queue Management System Market Revenue (US$ Mn) and Forecasts, By Application
13.5.3.3.1. Hospitals
and Clinics
13.5.3.3.2. Banks
and Financial Institutions
13.5.3.3.3. Retail
Outlets
13.5.3.3.4. Private
Utility Service Providers/Airline Check in Counters
13.5.3.3.5. Self
Service Restaurants
13.5.3.3.6. Government
Offices
13.5.3.3.7. Telecom
Service Center
13.5.3.3.8. Others
13.5.4. New
Zealand
13.5.4.1. New
Zealand Queue Management System Market Revenue (US$ Mn) and Forecasts, By
Deployment
13.5.4.1.1. Cloud
Based
13.5.4.1.2. On
Premise
13.5.4.2. New
Zealand Queue Management System Market Revenue (US$ Mn) and Forecasts, By Type
13.5.4.2.1. Virtual
Queuing
13.5.4.2.2. Linear
Queuing
13.5.4.3. New
Zealand Queue Management System Market Revenue (US$ Mn) and Forecasts, By
Application
13.5.4.3.1. Hospitals
and Clinics
13.5.4.3.2. Banks
and Financial Institutions
13.5.4.3.3. Retail
Outlets
13.5.4.3.4. Private
Utility Service Providers/Airline Check in Counters
13.5.4.3.5. Self
Service Restaurants
13.5.4.3.6. Government
Offices
13.5.4.3.7. Telecom
Service Center
13.5.4.3.8. Others
13.5.5. Australia
13.5.5.1. Australia
Queue Management System Market Revenue (US$ Mn) and Forecasts, By Deployment
13.5.5.1.1. Cloud
Based
13.5.5.1.2. On
Premise
13.5.5.2. Australia
Queue Management System Market Revenue (US$ Mn) and Forecasts, By Type
13.5.5.2.1. Virtual
Queuing
13.5.5.2.2. Linear
Queuing
13.5.5.3. Australia
Queue Management System Market Revenue (US$ Mn) and Forecasts, By Application
13.5.5.3.1. Hospitals
and Clinics
13.5.5.3.2. Banks
and Financial Institutions
13.5.5.3.3. Retail
Outlets
13.5.5.3.4. Private
Utility Service Providers/Airline Check in Counters
13.5.5.3.5. Self
Service Restaurants
13.5.5.3.6. Government
Offices
13.5.5.3.7. Telecom
Service Center
13.5.5.3.8. Others
13.5.6. South
Korea
13.5.6.1. South
Korea Queue Management System Market Revenue (US$ Mn) and Forecasts, By
Deployment
13.5.6.1.1. Cloud
Based
13.5.6.1.2. On
Premise
13.5.6.2. South
Korea Queue Management System Market Revenue (US$ Mn) and Forecasts, By Type
13.5.6.2.1. Virtual
Queuing
13.5.6.2.2. Linear
Queuing
13.5.6.3. South
Korea Queue Management System Market Revenue (US$ Mn) and Forecasts, By
Application
13.5.6.3.1. Hospitals
and Clinics
13.5.6.3.2. Banks
and Financial Institutions
13.5.6.3.3. Retail
Outlets
13.5.6.3.4. Private
Utility Service Providers/Airline Check in Counters
13.5.6.3.5. Self
Service Restaurants
13.5.6.3.6. Government
Offices
13.5.6.3.7. Telecom
Service Center
13.5.6.3.8. Others
13.5.7. Southeast
Asia
13.5.7.1. Southeast
Asia Queue Management System Market Revenue (US$ Mn) and Forecasts, By
Deployment
13.5.7.1.1. Cloud
Based
13.5.7.1.2. On
Premise
13.5.7.2. Southeast
Asia Queue Management System Market Revenue (US$ Mn) and Forecasts, By Type
13.5.7.2.1. Virtual
Queuing
13.5.7.2.2. Linear
Queuing
13.5.7.3. Southeast
Asia Queue Management System Market Revenue (US$ Mn) and Forecasts, By
Application
13.5.7.3.1. Hospitals
and Clinics
13.5.7.3.2. Banks
and Financial Institutions
13.5.7.3.3. Retail
Outlets
13.5.7.3.4. Private
Utility Service Providers/Airline Check in Counters
13.5.7.3.5. Self
Service Restaurants
13.5.7.3.6. Government
Offices
13.5.7.3.7. Telecom
Service Center
13.5.7.3.8. Others
13.5.7.4. Southeast
Asia Queue Management System Market Revenue (US$ Mn) and Forecasts, By Country
13.5.7.4.1. Indonesia
13.5.7.4.2. Thailand
13.5.7.4.3. Malaysia
13.5.7.4.4. Singapore
13.5.7.4.5. Rest
of Southeast Asia
13.5.8. Rest of
Asia Pacific
13.5.8.1. Rest
of Asia Pacific Queue Management System Market Revenue (US$ Mn) and Forecasts,
By Deployment
13.5.8.1.1. Cloud
Based
13.5.8.1.2. On
Premise
13.5.8.2. Rest
of Asia Pacific Queue Management System Market Revenue (US$ Mn) and Forecasts,
By Type
13.5.8.2.1. Virtual
Queuing
13.5.8.2.2. Linear
Queuing
13.5.8.3. Rest
of Asia Pacific Queue Management System Market Revenue (US$ Mn) and Forecasts,
By Application
13.5.8.3.1. Hospitals
and Clinics
13.5.8.3.2. Banks
and Financial Institutions
13.5.8.3.3. Retail
Outlets
13.5.8.3.4. Private
Utility Service Providers/Airline Check in Counters
13.5.8.3.5. Self
Service Restaurants
13.5.8.3.6. Government
Offices
13.5.8.3.7. Telecom
Service Center
13.5.8.3.8. Others
13.6. Key
Segment for Channeling Investments
13.6.1. By
Country
13.6.2. By
Deployment
13.6.3. By Type
13.6.4. By
Application
14. Middle
East and Africa Queue Management System Market Analysis and Forecasts, 2019 -
2027
14.1. Overview
14.1.1. Middle
East and Africa Queue Management System Market Revenue (US$ Mn)
14.2. Middle
East and Africa Queue Management System Market Revenue (US$ Mn) and Forecasts,
By Deployment
14.2.1. Cloud
Based
14.2.2. On
Premise
14.3. Middle
East and Africa Queue Management System Market Revenue (US$ Mn) and Forecasts,
By Type
14.3.1. Virtual
Queuing
14.3.2. Linear
Queuing
14.4. Middle
East and Africa Queue Management System Market Revenue (US$ Mn) and Forecasts,
By Application
14.4.1. Hospitals
and Clinics
14.4.2. Banks
and Financial Institutions
14.4.3. Retail
Outlets
14.4.4. Private
Utility Service Providers/Airline Check in Counters
14.4.5. Self
Service Restaurants
14.4.6. Government
Offices
14.4.7. Telecom
Service Center
14.4.8. Others
14.5. Middle
East and Africa Queue Management System Market Revenue (US$ Mn) and Forecasts,
By Country
14.5.1. Saudi
Arabia
14.5.1.1. Saudi
Arabia Queue Management System Market Revenue (US$ Mn) and Forecasts, By
Deployment
14.5.1.1.1. Cloud
Based
14.5.1.1.2. On
Premise
14.5.1.2. Saudi
Arabia Queue Management System Market Revenue (US$ Mn) and Forecasts, By Type
14.5.1.2.1. Virtual
Queuing
14.5.1.2.2. Linear
Queuing
14.5.1.3. Saudi
Arabia Queue Management System Market Revenue (US$ Mn) and Forecasts, By
Application
14.5.1.3.1. Hospitals
and Clinics
14.5.1.3.2. Banks
and Financial Institutions
14.5.1.3.3. Retail
Outlets
14.5.1.3.4. Private
Utility Service Providers/Airline Check in Counters
14.5.1.3.5. Self
Service Restaurants
14.5.1.3.6. Government
Offices
14.5.1.3.7. Telecom
Service Center
14.5.1.3.8. Others
14.5.2. UAE
14.5.2.1. UAE
Queue Management System Market Revenue (US$ Mn) and Forecasts, By Deployment
14.5.2.1.1. Cloud
Based
14.5.2.1.2. On
Premise
14.5.2.2. UAE
Queue Management System Market Revenue (US$ Mn) and Forecasts, By Type
14.5.2.2.1. Virtual
Queuing
14.5.2.2.2. Linear
Queuing
14.5.2.3. UAE
Queue Management System Market Revenue (US$ Mn) and Forecasts, By Application
14.5.2.3.1. Hospitals
and Clinics
14.5.2.3.2. Banks
and Financial Institutions
14.5.2.3.3. Retail
Outlets
14.5.2.3.4. Private
Utility Service Providers/Airline Check in Counters
14.5.2.3.5. Self
Service Restaurants
14.5.2.3.6. Government
Offices
14.5.2.3.7. Telecom
Service Center
14.5.2.3.8. Others
14.5.3. Egypt
14.5.3.1. Egypt
Queue Management System Market Revenue (US$ Mn) and Forecasts, By Deployment
14.5.3.1.1. Cloud
Based
14.5.3.1.2. On
Premise
14.5.3.2. Egypt
Queue Management System Market Revenue (US$ Mn) and Forecasts, By Type
14.5.3.2.1. Virtual
Queuing
14.5.3.2.2. Linear
Queuing
14.5.3.3. Egypt
Queue Management System Market Revenue (US$ Mn) and Forecasts, By Application
14.5.3.3.1. Hospitals
and Clinics
14.5.3.3.2. Banks
and Financial Institutions
14.5.3.3.3. Retail
Outlets
14.5.3.3.4. Private
Utility Service Providers/Airline Check in Counters
14.5.3.3.5. Self
Service Restaurants
14.5.3.3.6. Government
Offices
14.5.3.3.7. Telecom
Service Center
14.5.3.3.8. Others
14.5.4. Kuwait
14.5.4.1. Kuwait
Queue Management System Market Revenue (US$ Mn) and Forecasts, By Deployment
14.5.4.1.1. Cloud
Based
14.5.4.1.2. On
Premise
14.5.4.2. Kuwait
Queue Management System Market Revenue (US$ Mn) and Forecasts, By Type
14.5.4.2.1. Virtual
Queuing
14.5.4.2.2. Linear
Queuing
14.5.4.3. Kuwait
Queue Management System Market Revenue (US$ Mn) and Forecasts, By Application
14.5.4.3.1. Hospitals
and Clinics
14.5.4.3.2. Banks
and Financial Institutions
14.5.4.3.3. Retail
Outlets
14.5.4.3.4. Private
Utility Service Providers/Airline Check in Counters
14.5.4.3.5. Self
Service Restaurants
14.5.4.3.6. Government
Offices
14.5.4.3.7. Telecom
Service Center
14.5.4.3.8. Others
14.5.5. South
Africa
14.5.5.1. South
Africa Queue Management System Market Revenue (US$ Mn) and Forecasts, By
Deployment
14.5.5.1.1. Cloud
Based
14.5.5.1.2. On
Premise
14.5.5.2. South
Africa Queue Management System Market Revenue (US$ Mn) and Forecasts, By Type
14.5.5.2.1. Virtual
Queuing
14.5.5.2.2. Linear
Queuing
14.5.5.3. South
Africa Queue Management System Market Revenue (US$ Mn) and Forecasts, By Application
14.5.5.3.1. Hospitals
and Clinics
14.5.5.3.2. Banks
and Financial Institutions
14.5.5.3.3. Retail
Outlets
14.5.5.3.4. Private
Utility Service Providers/Airline Check in Counters
14.5.5.3.5. Self
Service Restaurants
14.5.5.3.6. Government
Offices
14.5.5.3.7. Telecom
Service Center
14.5.5.3.8. Others
14.5.6. Rest of
Middle East & Africa
14.5.6.1. Rest
of Middle East & Africa Queue Management System Market Revenue (US$ Mn) and
Forecasts, By Deployment
14.5.6.1.1. Cloud
Based
14.5.6.1.2. On
Premise
14.5.6.2. Rest
of Middle East & Africa Queue Management System Market Revenue (US$ Mn) and
Forecasts, By Type
14.5.6.2.1. Virtual
Queuing
14.5.6.2.2. Linear
Queuing
14.5.6.3. Rest
of Middle East & Africa Queue Management System Market Revenue (US$ Mn) and
Forecasts, By Application
14.5.6.3.1. Hospitals
and Clinics
14.5.6.3.2. Banks
and Financial Institutions
14.5.6.3.3. Retail
Outlets
14.5.6.3.4. Private
Utility Service Providers/Airline Check in Counters
14.5.6.3.5. Self
Service Restaurants
14.5.6.3.6. Government
Offices
14.5.6.3.7. Telecom
Service Center
14.5.6.3.8. Others
14.6. Key
Segment for Channeling Investments
14.6.1. By
Country
14.6.2. By
Deployment
14.6.3. By Type
14.6.4. By
Application
15. Latin
America Queue Management System Market Analysis and Forecasts, 2019 - 2027
15.1. Overview
15.1.1. Latin
America Queue Management System Market Revenue (US$ Mn)
15.2. Latin
America Queue Management System Market Revenue (US$ Mn) and Forecasts, By
Deployment
15.2.1. Cloud
Based
15.2.2. On
Premise
15.3. Latin
America Queue Management System Market Revenue (US$ Mn) and Forecasts, By Type
15.3.1. Virtual
Queuing
15.3.2. Linear
Queuing
15.4. Latin
America Queue Management System Market Revenue (US$ Mn) and Forecasts, By
Application
15.4.1. Hospitals
and Clinics
15.4.2. Banks
and Financial Institutions
15.4.3. Retail
Outlets
15.4.4. Private
Utility Service Providers/Airline Check in Counters
15.4.5. Self
Service Restaurants
15.4.6. Government
Offices
15.4.7. Telecom
Service Center
15.4.8. Others
15.5. Latin
America Queue Management System Market Revenue (US$ Mn) and Forecasts, By
Country
15.5.1. Brazil
15.5.1.1. Brazil
Queue Management System Market Revenue (US$ Mn) and Forecasts, By Deployment
15.5.1.1.1. Cloud
Based
15.5.1.1.2. On
Premise
15.5.1.2. Brazil
Queue Management System Market Revenue (US$ Mn) and Forecasts, By Type
15.5.1.2.1. Virtual
Queuing
15.5.1.2.2. Linear
Queuing
15.5.1.3. Brazil
Queue Management System Market Revenue (US$ Mn) and Forecasts, By Application
15.5.1.3.1. Hospitals
and Clinics
15.5.1.3.2. Banks
and Financial Institutions
15.5.1.3.3. Retail
Outlets
15.5.1.3.4. Private
Utility Service Providers/Airline Check in Counters
15.5.1.3.5. Self
Service Restaurants
15.5.1.3.6. Government
Offices
15.5.1.3.7. Telecom
Service Center
15.5.1.3.8. Others
15.5.2. Argentina
15.5.2.1. Argentina
Queue Management System Market Revenue (US$ Mn) and Forecasts, By Deployment
15.5.2.1.1. Cloud
Based
15.5.2.1.2. On
Premise
15.5.2.2. Argentina
Queue Management System Market Revenue (US$ Mn) and Forecasts, By Type
15.5.2.2.1. Virtual
Queuing
15.5.2.2.2. Linear
Queuing
15.5.2.3. Argentina
Queue Management System Market Revenue (US$ Mn) and Forecasts, By Application
15.5.2.3.1. Hospitals
and Clinics
15.5.2.3.2. Banks
and Financial Institutions
15.5.2.3.3. Retail
Outlets
15.5.2.3.4. Private
Utility Service Providers/Airline Check in Counters
15.5.2.3.5. Self
Service Restaurants
15.5.2.3.6. Government
Offices
15.5.2.3.7. Telecom
Service Center
15.5.2.3.8. Others
15.5.3. Rest of
Latin America
15.5.3.1. Rest
of Latin America Queue Management System Market Revenue (US$ Mn) and Forecasts,
By Deployment
15.5.3.1.1. Cloud
Based
15.5.3.1.2. On
Premise
15.5.3.2. Rest
of Latin America Queue Management System Market Revenue (US$ Mn) and Forecasts,
By Type
15.5.3.2.1. Virtual
Queuing
15.5.3.2.2. Linear
Queuing
15.5.3.3. Rest
of Latin America Queue Management System Market Revenue (US$ Mn) and Forecasts,
By Application
15.5.3.3.1. Hospitals
and Clinics
15.5.3.3.2. Banks
and Financial Institutions
15.5.3.3.3. Retail
Outlets
15.5.3.3.4. Private
Utility Service Providers/Airline Check in Counters
15.5.3.3.5. Self
Service Restaurants
15.5.3.3.6. Government
Offices
15.5.3.3.7. Telecom
Service Center
15.5.3.3.8. Others
15.6. Key
Segment for Channeling Investments
15.6.1. By
Country
15.6.2. By
Deployment
15.6.3. By Type
15.6.4. By
Application
16. Competitive
Benchmarking
16.1. Market
Share Analysis, 2018
16.2. Global
Presence and Growth Strategies
16.2.1. Mergers
and Acquisitions
16.2.2. Product
Launches
16.2.3. Investments
Trends
16.2.4. R&D
Initiatives
17. Player
Profiles
17.1. Advantech
Co. Ltd.
17.1.1. Company
Details
17.1.2. Company
Overview
17.1.3. Product
Offerings
17.1.4. Key
Developments
17.1.5. Financial
Analysis
17.1.6. SWOT
Analysis
17.1.7. Business
Strategies
17.2. AKIS
Technologies
17.2.1. Company
Details
17.2.2. Company
Overview
17.2.3. Product
Offerings
17.2.4. Key
Developments
17.2.5. Financial
Analysis
17.2.6. SWOT
Analysis
17.2.7. Business
Strategies
17.3. QLess
Company
17.3.1. Company
Details
17.3.2. Company
Overview
17.3.3. Product
Offerings
17.3.4. Key
Developments
17.3.5. Financial
Analysis
17.3.6. SWOT
Analysis
17.3.7. Business
Strategies
17.4. XIPHIAS
Software Technologies
17.4.1. Company
Details
17.4.2. Company
Overview
17.4.3. Product
Offerings
17.4.4. Key
Developments
17.4.5. Financial
Analysis
17.4.6. SWOT
Analysis
17.4.7. Business
Strategies
17.5. Wavetec
17.5.1. Company
Details
17.5.2. Company
Overview
17.5.3. Product
Offerings
17.5.4. Key
Developments
17.5.5. Financial
Analysis
17.5.6. SWOT
Analysis
17.5.7. Business
Strategies
17.6. InfraRed
Integrated Systems Ltd
17.6.1. Company
Details
17.6.2. Company
Overview
17.6.3. Product
Offerings
17.6.4. Key
Developments
17.6.5. Financial
Analysis
17.6.6. SWOT
Analysis
17.6.7. Business
Strategies
17.7. Lavi
Industries
17.7.1. Company
Details
17.7.2. Company
Overview
17.7.3. Product
Offerings
17.7.4. Key
Developments
17.7.5. Financial
Analysis
17.7.6. SWOT
Analysis
17.7.7. Business
Strategies
17.8. Multimex
17.8.1. Company
Details
17.8.2. Company
Overview
17.8.3. Product
Offerings
17.8.4. Key
Developments
17.8.5. Financial
Analysis
17.8.6. SWOT
Analysis
17.8.7. Business
Strategies
17.9. AURIONPRO
17.9.1. Company
Details
17.9.2. Company
Overview
17.9.3. Product
Offerings
17.9.4. Key
Developments
17.9.5. Financial
Analysis
17.9.6. SWOT
Analysis
17.9.7. Business
Strategies
17.10. ATT
System Group
17.10.1. Company
Details
17.10.2. Company
Overview
17.10.3. Product
Offerings
17.10.4. Key
Developments
17.10.5. Financial
Analysis
17.10.6. SWOT
Analysis
17.10.7. Business
Strategies
17.11. Qmagik
17.11.1. Company
Details
17.11.2. Company
Overview
17.11.3. Product
Offerings
17.11.4. Key
Developments
17.11.5. Financial
Analysis
17.11.6. SWOT
Analysis
17.11.7. Business
Strategies
17.12. Onlinet
17.12.1. Company
Details
17.12.2. Company
Overview
17.12.3. Product
Offerings
17.12.4. Key
Developments
17.12.5. Financial
Analysis
17.12.6. SWOT
Analysis
17.12.7. Business
Strategies
17.13. V-Count
17.13.1. Company
Details
17.13.2. Company
Overview
17.13.3. Product
Offerings
17.13.4. Key
Developments
17.13.5. Financial
Analysis
17.13.6. SWOT
Analysis
17.13.7. Business
Strategies
17.14. Skiplino
17.14.1. Company
Details
17.14.2. Company
Overview
17.14.3. Product
Offerings
17.14.4. Key
Developments
17.14.5. Financial
Analysis
17.14.6. SWOT
Analysis
17.14.7. Business
Strategies
17.15. Qudini
17.15.1. Company
Details
17.15.2. Company
Overview
17.15.3. Product
Offerings
17.15.4. Key
Developments
17.15.5. Financial
Analysis
17.15.6. SWOT
Analysis
17.15.7. Business
Strategies
17.16. Qnomy
17.16.1. Company
Details
17.16.2. Company
Overview
17.16.3. Product
Offerings
17.16.4. Key
Developments
17.16.5. Financial
Analysis
17.16.6. SWOT
Analysis
17.16.7. Business
Strategies
17.17. Qminder
Ltd
17.17.1. Company
Details
17.17.2. Company
Overview
17.17.3. Product
Offerings
17.17.4. Key
Developments
17.17.5. Financial
Analysis
17.17.6. SWOT
Analysis
17.17.7. Business
Strategies
17.18. Qmatic
17.18.1. Company
Details
17.18.2. Company
Overview
17.18.3. Product
Offerings
17.18.4. Key
Developments
17.18.5. Financial
Analysis
17.18.6. SWOT
Analysis
17.18.7. Business
Strategies
17.19. Other
Market Participants
18. Key
Findings
Note: This ToC is tentative
and can be changed according to the research study conducted during the course
of report completion.
**Exclusive for Multi-User and
Enterprise User.
At Absolute Markets Insights, we are engaged in building both global as well as country specific reports. As a result, the approach taken for deriving the estimation and forecast for a specific country is a bit unique and different in comparison to the global research studies. In this case, we not only study the concerned market factors & trends prevailing in a particular country (from secondary research) but we also tend to calculate the actual market size & forecast from the revenue generated from the market participants involved in manufacturing or distributing the any concerned product. These companies can also be service providers. For analyzing any country specifically, we do consider the growth factors prevailing under the states/cities/county for the same. For instance, if we are analyzing an industry specific to United States, we primarily need to study about the states present under the same(where the product/service has the highest growth). Similar analysis will be followed by other countries. Our scope of the report changes with different markets.
Our research study is mainly implement through a mix of both secondary and primary research. Various sources such as industry magazines, trade journals, and government websites and trade associations are reviewed for gathering precise data. Primary interviews are conducted to validate the market size derived from secondary research. Industry experts, major manufacturers and distributors are contacted for further validation purpose on the current market penetration and growth trends.
Prominent participants in our primary research process include:
- Key Opinion Leaders namely the CEOs, CSOs, VPs, purchasing managers, amongst others
- Research and development participants, distributors/suppliers and subject matter experts
Secondary Research includes data extracted from paid data sources:
- Reuters
- Factiva
- Bloomberg
- One Source
- Hoovers
Research Methodology

Key Inclusions


