
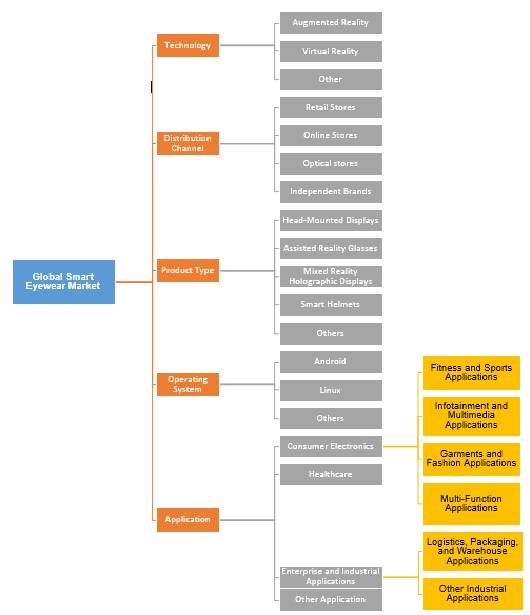
Smart Eyewear Market By Technology (Augmented Reality, Virtual Reality, Other (Mixed reality and other)); By Distribution Channel (Retail Stores, Online Stores, Optical stores, Independent Brands); By Product Type (Head-Mounted Displays, Assisted Reality Glasses, Mixed Reality Holographic Displays, Smart Helmets, Others ); By Operating System (Android, Linux, Others); By Application (Consumer Electronics, (Fitness and Sports Applications, Infotainment and Multimedia Applications, Garments and Fashion Applications, Multi-Function Applications), Healthcare, Enterprise and Industrial Applications (Logistics, Packaging, and Warehouse Applications, Other Industrial Applications) and Other Application); By Region (U.S., Rest of North America, France, UK, Germany, Spain, Italy, Rest of Europe, China, Japan, India, Southeast Asia, Rest of Asia Pacific, GCC Countries, Southern Africa, Rest of MEA, Brazil, Rest of Latin America)) - Global Insights, Growth, Size, Comparative Analysis, Trends and Forecast, 2018 - 2026
Industry Type:
Smart Eyewear are the computerized eyeglasses that generates digitalized images for its user. It helps to gain information, or to take pictures or record a video. It uses gesture and voice trackers that are positioned behind the arms of frame. Smart eyewear tracks user activities, make hands free calls and play music through speakers that are embedded behind ears. These devices are available in clear glasses and tinted (sunglass lenses) glasses. Industries manufacturing smart eye-wears understand the need for developing automated and hands-free applications that can cater to the need of supervision, more accuracy and less need of labor. They use optical mechanisms such as Heads-Up Display (HUD), a Head-Mounted Display (HMD) and Optical Head Mounted Display (OHMD). These devices or applications, provide precise and accurate measurements, thus increasing its application in aerospace & defense, architecture & construction, medical, electronics, energy & power, heavy machinery, entertainment and other sectors. Due to its widespread field’s applications and rising demands, it is expected to show tremendous growth in the future.
The global smart eyewear market, in terms of revenue, which was estimated at US$ 4,548.97 Mn in 2017, is expected to reach US$ 20,796.21 Mn in 2022.
Smart Eyewear Technology Market Revenue (USD Mn), By Technology, 2017 and 2022
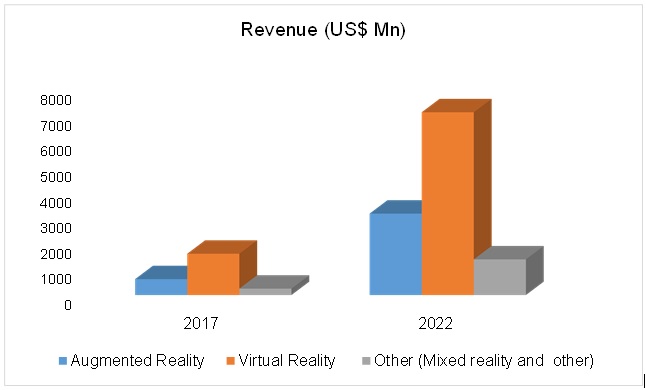
Global Smart Eyewear Market, By Technology:
On the basis of technology, smart eyewear are categorized majorly into augmented reality (AR), virtual reality (VR) and others. Augmented reality is a reality-based, interactive environment, which provides audiovisual and graphical effects based on a person’s real-life experience. Augmented reality and virtual reality makes use of animated hologram, virtual 3D models and interactive display. With the rising use of internet, advanced information and communication technology, smartphones, VR is fostering highest market share. Virtual reality creates an artificial environment to replace the existing reality. Incorporation of VR added functionalities into smartphones, computers and other devices have made VR usage cost-effective and its extensive applications in the field of architecture & construction, medical, electronics and entertainment has driven the smart eyewear market growth.
Global Smart Eyewear Market, By Operating System:
Virtual reality is used on various operating systems (OS) such as android, Linux and others. Unlike other operating systems, android is an open source framework, which uses simple tools and applications. It also provides a user-friendly interface design and an improved power management and application control. These factors are driving the growth of market. The android operating systems presently holds the largest market size and is anticipated to be the fastest growing during the forecast period.
Global Smart Eyewear Market, By Application:
Among the application type, consumer electronics is expected to hold the highest market share. With the increasing population, awareness of their fitness and well-being, growing entertainment and fashion businesses, busier lifestyles and rising standard of living, smart eyewear applications are providing fast, high accuracy and efficient visualization and interactive experiences. All these factors are driving the growth of consumer electronics segment of the market.
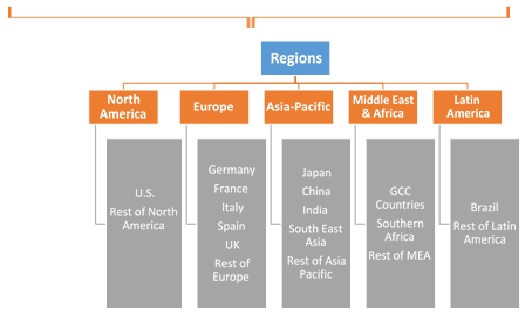
Global Smart Eyewear Market, By Regions:
On the basis of region, Asia Pacific is the fastest growing region in the global market. Emerging economies for instance; India and China are witnessing huge growth due to penetration of advanced technologies and rapid industrialization. Industrialization has facilitated huge employment opportunities, which has ultimately empowered people to purchase smart eye wears. Increasing investments by major players has factored Asia Pacific to evolve as the fastest growing region in the global market.
Company Profile:
The smart eyewear market report provides both, subjective and quantitative research of the market, as well as integrates worthy insights into the rational scenario and favored development methods adopted by the key contenders. The report also offers extensive research on the key players in this market and detailed insights on the competitiveness of these players. The key business strategies such as M&A, affiliations, collaborations, and contracts adopted by the major players are also recognized and analyzed in the report. For each company, the report recognizes their headquarter, competitors, product/service type, application and specification, pricing, and gross margin.
Some of the primary participants in global market are Microsoft Corporation, Meta Company, Epson America, Inc, BAE Systems, Samsung Electronics Co., Ltd, Osterhout Design Group, Inc, Recon Instruments, Inc., Kopin Corporation, Google Inc., Sony Corporation, VUZIX, Lenovo, Lumus Ltd and Optinvent S.A. amongst others.

1. Introduction
1.1. Market Scope
1.2. Market Segmentation
1.3. Methodology
1.4. Assumptions
2. Smart Eyewear Market Snapshot
3. Executive Summary: Smart Eyewear Market
4. Qualitative Analysis: Smart Eyewear Market
4.1. Introduction
4.1.1. Product Definition
4.1.2. Industry Development
4.2. Market Dynamics
4.2.1. Drivers
4.2.2. Restraints
4.2.3. Opportunities
4.3. Trends in Market
5. Global Smart Eyewear Market Analysis and Forecasts, 2018 –
2026
5.1. Overview
5.1.1. Global Market Revenue (US$ Mn) and Forecasts
5.2. Global Market Revenue (US$ Mn) and Forecasts, By Technology
5.2.1. Augmented Reality
5.2.1.1. Definition
5.2.1.2. Market Penetration
5.2.1.3. Market Revenue Expected to Increase by 2026
5.2.1.4. Compound Annual Growth Rate (CAGR)
5.2.2. Virtual Reality
5.2.2.1. Definition
5.2.2.2. Market Penetration
5.2.2.3. Market Revenue Expected to Increase by 2026
5.2.2.4. Compound Annual Growth Rate (CAGR)
5.2.3. Other (Mixed reality and other)
5.2.3.1. Definition
5.2.3.2. Market Penetration
5.2.3.3. Market Revenue Expected to Increase by 2026
5.2.3.4. Compound Annual Growth Rate (CAGR)
5.3. Key Segment for Channeling Investments
5.3.1. By Technology
6. Global Smart Eyewear Market Analysis and Forecasts, 2018 – 2026
6.1. Overview
6.2. Global Market Revenue (US$ Mn) and Forecasts, By Distribution
Channel
6.2.1. Retail Stores
6.2.1.1. Definition
6.2.1.2. Market Penetration
6.2.1.3. Market Revenue Expected to Increase by 2026
6.2.1.4. Compound Annual Growth Rate (CAGR)
6.2.2. Online Stores
6.2.2.1. Definition
6.2.2.2. Market Penetration
6.2.2.3. Market Revenue Expected to Increase by 2026
6.2.2.4. Compound Annual Growth Rate (CAGR)
6.2.3. Optical Stores
6.2.3.1. Definition
6.2.3.2. Market Penetration
6.2.3.3. Market Revenue Expected to Increase by 2026
6.2.3.4. Compound Annual Growth Rate (CAGR)
6.2.4. Independent Brands
6.2.4.1. Definition
6.2.4.2. Market Penetration
6.2.4.3. Market Revenue Expected to Increase by 2026
6.2.4.4. Compound Annual Growth Rate (CAGR)
6.3. Key Segment for Channeling Investments
6.3.1. By Distribution Channel
7. Global Smart Eyewear Market Analysis and Forecasts, 2018 –
2026
7.1. Overview
7.2. Global Market Revenue (US$ Mn) and Forecasts, By Product Type
7.2.1. Head-Mounted Displays
7.2.1.1. Definition
7.2.1.2. Market Penetration
7.2.1.3. Market Revenue Expected to Increase by 2026
7.2.1.4. Compound Annual Growth Rate (CAGR)
7.2.2. Assisted Reality Glasses
7.2.2.1. Definition
7.2.2.2. Market Penetration
7.2.2.3. Market Revenue Expected to Increase by 2026
7.2.2.4. Compound Annual Growth Rate (CAGR)
7.2.3. Mixed Reality Holographic Displays
7.2.3.1. Definition
7.2.3.2. Market Penetration
7.2.3.3. Market Revenue Expected to Increase by 2026
7.2.3.4. Compound Annual Growth Rate (CAGR)
7.2.4. Smart Helmets
7.2.4.1. Definition
7.2.4.2. Market Penetration
7.2.4.3. Market Revenue Expected to Increase by 2026
7.2.4.4. Compound Annual Growth Rate (CAGR)
7.2.5. Others
7.3. Key Segment for Channeling Investments
7.3.1. By Product Type
8. Global Smart Eyewear Market Analysis and Forecasts, 2018 –
2026
8.1. Overview
8.2. Global Market Revenue (US$ Mn) and Forecasts, By Operating
System
8.2.1. Android
8.2.1.1. Definition
8.2.1.2. Market Penetration
8.2.1.3. Market Revenue Expected to Increase by 2026
8.2.1.4. Compound Annual Growth Rate (CAGR)
8.2.2. Linux
8.2.2.1. Definition
8.2.2.2. Market Penetration
8.2.2.3. Market Revenue Expected to Increase by 2026
8.2.2.4. Compound Annual Growth Rate (CAGR)
8.2.3. Others
8.3. Key Segment for Channeling Investments
8.3.1. By Operating System
9. Global Smart Eyewear Market Analysis and Forecasts, 2018 –
2026
9.1. Overview
9.2. Global Market Revenue (US$ Mn) and Forecasts, By Application
9.2.1.
Consumer Electronics
9.2.1.1. Fitness and Sports Applications
9.2.1.2. Infotainment and Multimedia Applications
9.2.1.3. Garments and Fashion Applications
9.2.1.4. Multi-Function Applications
9.2.2. Healthcare
9.2.2.1. Definition
9.2.2.2. Market Penetration
9.2.2.3. Market Revenue Expected to Increase by 2026
9.2.2.4. Compound Annual Growth Rate (CAGR)
9.2.3. Enterprise and Industrial Applications
9.2.3.1. Logistics, Packaging, and Warehouse Applications
9.2.3.2. Other Industrial Applications
9.2.4. Other Application
9.3. Key Segment for Channeling Investments
9.3.1. By Application
10. North America Smart Eyewear Market Analysis and Forecasts,
2018 – 2026
10.1. Overview
10.1.1. North America Market Revenue (US$ Mn)
10.2. North America Market Revenue (US$ Mn) and Forecasts, By
Technology
10.2.1. Augmented Reality
10.2.2. Virtual Reality
10.2.3. Other (Mixed reality and other)
10.3. North America Market Revenue (US$ Mn) and Forecasts, By
Distribution Channel
10.3.1. Retail Stores
10.3.2. Online Stores
10.3.3. Optical Stores
10.3.4. Independent Brands
10.4. North America Market Revenue (US$ Mn) and Forecasts, By
Product Type
10.4.1. Head-Mounted Displays
10.4.2. Assisted Reality Glasses
10.4.3. Mixed Reality Holographic Displays
10.4.4. Smart Helmets
10.4.5. Others
10.5. North America Market Revenue (US$ Mn) and Forecasts, By
Operating System
10.5.1. Android
10.5.2. Linux
10.5.3. Others
10.6. North America Market Revenue (US$ Mn) and Forecasts, By
Application
10.6.1. Consumer Electronics
10.6.1.1. Fitness and Sports Applications
10.6.1.2. Infotainment and Multimedia Applications
10.6.1.3. Garments and Fashion Applications
10.6.1.4. Multi-Function Applications
10.6.2. Healthcare
10.6.3. Enterprise and Industrial Applications
10.6.3.1. Logistics, Packaging, and Warehouse Applications
10.6.3.2. Other Industrial Applications
10.6.4. Other Application
10.7. North America Market Revenue (US$ Mn) and Forecasts, By
Country
10.7.1. U.S.
10.7.1.1. U.S. Smart Eyewear Market Revenue (US$ Mn) and Forecasts, By
Technology
10.7.1.1.1. Augmented Reality
10.7.1.1.2. Virtual Reality
10.7.1.1.3. Other (Mixed reality and other)
10.7.1.2. U.S. Market Revenue (US$ Mn) and Forecasts, By Distribution
Channel
10.7.1.2.1. Retail Stores
10.7.1.2.2. Online Stores
10.7.1.2.3. Optical Stores
10.7.1.2.4. Independent Brands
10.7.1.3. U.S. Market Revenue (US$ Mn) and Forecasts, By Product Type
10.7.1.3.1. Head-Mounted Displays
10.7.1.3.2. Assisted Reality Glasses
10.7.1.3.3. Mixed Reality Holographic Displays
10.7.1.3.4. Smart Helmets
10.7.1.3.5. Others
10.7.1.4. U.S. Market Revenue (US$ Mn) and Forecasts, By Operating
System
10.7.1.4.1. Android
10.7.1.4.2. Linux
10.7.1.4.3. Others
10.7.1.5. U.S. Market Revenue (US$ Mn) and Forecasts, By Application
10.7.1.5.1. Consumer Electronics
10.7.1.5.1.1. Fitness and Sports Applications
10.7.1.5.1.2. Infotainment and Multimedia Applications
10.7.1.5.1.3. Garments and Fashion Applications
10.7.1.5.1.4. Multi-Function Applications
10.7.1.5.2. Healthcare
10.7.1.5.3. Enterprise and Industrial Applications
10.7.1.5.3.1.
Logistics, Packaging, and
Warehouse Applications
10.7.1.5.3.2.
Other Industrial
Applications
10.7.1.5.4. Other Application
10.7.2. Rest of North America
10.7.2.1. Rest of North America Smart Eyewear Market Revenue (US$ Mn)
and Forecasts, By Technology
10.7.2.1.1. Augmented Reality
10.7.2.1.2. Virtual Reality
10.7.2.1.3. Other (Mixed reality and other)
10.7.2.2. Rest of North America Market Revenue (US$ Mn) and Forecasts,
By Distribution Channel
10.7.2.2.1. Retail Stores
10.7.2.2.2. Online Stores
10.7.2.2.3. Optical Stores
10.7.2.2.4. Independent Brands
10.7.2.3. Rest of North America Market Revenue (US$ Mn) and Forecasts,
By Product Type
10.7.2.3.1. Head-Mounted Displays
10.7.2.3.2. Assisted Reality Glasses
10.7.2.3.3. Mixed Reality Holographic Displays
10.7.2.3.4. Smart Helmets
10.7.2.3.5. Others
10.7.2.4. Rest of North America Market Revenue (US$ Mn) and Forecasts,
By Operating System
10.7.2.4.1. Android
10.7.2.4.2. Linux
10.7.2.4.3. Others
10.7.2.5. Rest of North America Market Revenue (US$ Mn) and Forecasts,
By Application
10.7.2.5.1. Consumer Electronics
10.7.2.5.1.1. Fitness and Sports Applications
10.7.2.5.1.2.
Infotainment and
Multimedia Applications
10.7.2.5.1.3.
Garments and Fashion
Applications
10.7.2.5.1.4.
Multi-Function
Applications
10.7.2.5.2. Healthcare
10.7.2.5.3. Enterprise and Industrial Applications
10.7.2.5.3.1.
Logistics, Packaging, and
Warehouse Applications
10.7.2.5.3.2.
Other Industrial
Applications
10.7.2.5.4. Other Application
10.8. Key Segment for Channeling Investments
10.8.1. By Country
10.8.2. By Technology
10.8.3. By Distribution Channel
10.8.4. By Product Type
10.8.5. By Operating System
10.8.6. By Application
11. Europe Smart Eyewear Market Analysis and Forecasts, 2018 –
2026
11.1. Overview
11.1.1. Europe Market Revenue (US$ Mn)
11.2. Europe Market Revenue (US$ Mn) and Forecasts, By Technology
11.2.1. Augmented Reality
11.2.2. Virtual Reality
11.2.3. Other (Mixed reality and other)
11.3. Europe Market Revenue (US$ Mn) and Forecasts, By Distribution
Channel
11.3.1. Retail Stores
11.3.2. Online Stores
11.3.3. Optical Stores
11.3.4. Independent Brands
11.4. Europe Market Revenue (US$ Mn) and Forecasts, By Product Type
11.4.1. Head-Mounted Displays
11.4.2. Assisted Reality Glasses
11.4.3. Mixed Reality Holographic Displays
11.4.4. Smart Helmets
11.4.5. Others
11.5. Europe Market Revenue (US$ Mn) and Forecasts, By Operating
System
11.5.1. Android
11.5.2. Linux
11.5.3. Others
11.6. Europe Market Revenue (US$ Mn) and Forecasts, By Application
11.6.1. Consumer Electronics
11.6.1.1. Fitness and Sports Applications
11.6.1.2. Infotainment and Multimedia Applications
11.6.1.3. Garments and Fashion Applications
11.6.1.4. Multi-Function Applications
11.6.2. Healthcare
11.6.3. Enterprise and Industrial Applications
11.6.3.1. Logistics, Packaging, and Warehouse Applications
11.6.3.2. Other Industrial Applications
11.6.4. Other Application
11.7. Europe Market Revenue (US$ Mn) and Forecasts, By Country
11.7.1. France
11.7.1.1. France Smart Eyewear Market Revenue (US$ Mn) and Forecasts, By
Technology
11.7.1.1.1. Augmented Reality
11.7.1.1.2. Virtual Reality
11.7.1.1.3. Other (Mixed reality and other)
11.7.1.2. France Market Revenue (US$ Mn) and Forecasts, By Distribution
Channel
11.7.1.2.1. Retail Stores
11.7.1.2.2. Online Stores
11.7.1.2.3. Optical Stores
11.7.1.2.4. Independent Brands
11.7.1.3. France Market Revenue (US$ Mn) and Forecasts, By Product Type
11.7.1.3.1. Head-Mounted Displays
11.7.1.3.2. Assisted Reality Glasses
11.7.1.3.3. Mixed Reality Holographic Displays
11.7.1.3.4. Smart Helmets
11.7.1.3.5. Others
11.7.1.4. France Market Revenue (US$ Mn) and Forecasts, By Operating
System
11.7.1.4.1. Android
11.7.1.4.2. Linux
11.7.1.4.3. Others
11.7.1.5. France Market Revenue (US$ Mn) and Forecasts, By Application
11.7.1.5.1. Consumer Electronics
11.7.1.5.1.1. Fitness and Sports Applications
11.7.1.5.1.2. Infotainment and Multimedia Applications
11.7.1.5.1.3. Garments and Fashion Applications
11.7.1.5.1.4. Multi-Function Applications
11.7.1.5.2. Healthcare
11.7.1.5.3. Enterprise and Industrial Applications
11.7.1.5.3.1.
Logistics, Packaging, and
Warehouse Applications
11.7.1.5.3.2.
Other Industrial
Applications
11.7.1.5.4. Other Application
11.7.2. The UK
11.7.2.1. The UK Smart Eyewear Market Revenue (US$ Mn) and Forecasts, By
Technology
11.7.2.1.1. Augmented Reality
11.7.2.1.2. Virtual Reality
11.7.2.1.3. Other (Mixed reality and other)
11.7.2.2. The UK Market Revenue (US$ Mn) and Forecasts, By Distribution
Channel
11.7.2.2.1. Retail Stores
11.7.2.2.2. Online Stores
11.7.2.2.3. Optical Stores
11.7.2.2.4. Independent Brands
11.7.2.3. The UK Market Revenue (US$ Mn) and Forecasts, By Product Type
11.7.2.3.1. Head-Mounted Displays
11.7.2.3.2. Assisted Reality Glasses
11.7.2.3.3. Mixed Reality Holographic Displays
11.7.2.3.4. Smart Helmets
11.7.2.3.5. Others
11.7.2.4. The UK Market Revenue (US$ Mn) and Forecasts, By Operating
System
11.7.2.4.1. Android
11.7.2.4.2. Linux
11.7.2.4.3. Others
11.7.2.5. The UK Market Revenue (US$ Mn) and Forecasts, By Application
11.7.2.5.1. Consumer Electronics
11.7.2.5.1.1.
Fitness and Sports
Applications
11.7.2.5.1.2.
Infotainment and
Multimedia Applications
11.7.2.5.1.3.
Garments and Fashion
Applications
11.7.2.5.1.4.
Multi-Function
Applications
11.7.2.5.2. Healthcare
11.7.2.5.3. Enterprise and Industrial Applications
11.7.2.5.3.1.
Logistics, Packaging, and
Warehouse Applications
11.7.2.5.3.2.
Other Industrial
Applications
11.7.2.5.4. Other Application
11.7.3. Spain
11.7.3.1. Spain Smart Eyewear Market Revenue (US$ Mn) and Forecasts, By
Technology
11.7.3.1.1. Augmented Reality
11.7.3.1.2. Virtual Reality
11.7.3.1.3. Other (Mixed reality and other)
11.7.3.2. Spain Market Revenue (US$ Mn) and Forecasts, By Distribution
Channel
11.7.3.2.1. Retail Stores
11.7.3.2.2. Online Stores
11.7.3.2.3. Optical Stores
11.7.3.2.4. Independent Brands
11.7.3.3. Spain Market Revenue (US$ Mn) and Forecasts, By Product Type
11.7.3.3.1. Head-Mounted Displays
11.7.3.3.2. Assisted Reality Glasses
11.7.3.3.3. Mixed Reality Holographic Displays
11.7.3.3.4. Smart Helmets
11.7.3.3.5. Others
11.7.3.4. Spain Market Revenue (US$ Mn) and Forecasts, By Operating
System
11.7.3.4.1. Android
11.7.3.4.2. Linux
11.7.3.4.3. Others
11.7.3.5. Spain Market Revenue (US$ Mn) and Forecasts, By Application
11.7.3.5.1. Consumer Electronics
11.7.3.5.1.1.
Fitness and Sports
Applications
11.7.3.5.1.2.
Infotainment and
Multimedia Applications
11.7.3.5.1.3.
Garments and Fashion
Applications
11.7.3.5.1.4.
Multi-Function
Applications
11.7.3.5.2. Healthcare
11.7.3.5.3. Enterprise and Industrial Applications
11.7.3.5.3.1.
Logistics, Packaging, and
Warehouse Applications
11.7.3.5.3.2.
Other Industrial
Applications
11.7.3.5.4. Other Application
11.7.4. Germany
11.7.4.1. Germany Smart Eyewear Market Revenue (US$ Mn) and Forecasts,
By Technology
11.7.4.1.1. Augmented Reality
11.7.4.1.2. Virtual Reality
11.7.4.1.3. Other (Mixed reality and other)
11.7.4.2. Germany Market Revenue (US$ Mn) and Forecasts, By Distribution
Channel
11.7.4.2.1. Retail Stores
11.7.4.2.2. Online Stores
11.7.4.2.3. Optical Stores
11.7.4.2.4. Independent Brands
11.7.4.3. Germany Market Revenue (US$ Mn) and Forecasts, By Product Type
11.7.4.3.1. Head-Mounted Displays
11.7.4.3.2. Assisted Reality Glasses
11.7.4.3.3. Mixed Reality Holographic Displays
11.7.4.3.4. Smart Helmets
11.7.4.3.5. Others
11.7.4.4. Germany Market Revenue (US$ Mn) and Forecasts, By Operating
System
11.7.4.4.1. Android
11.7.4.4.2. Linux
11.7.4.4.3. Others
11.7.4.5. Germany Market Revenue (US$ Mn) and Forecasts, By Application
11.7.4.5.1. Consumer Electronics
11.7.4.5.1.1.
Fitness and Sports
Applications
11.7.4.5.1.2.
Infotainment and Multimedia
Applications
11.7.4.5.1.3.
Garments and Fashion
Applications
11.7.4.5.1.4.
Multi-Function
Applications
11.7.4.5.2. Healthcare
11.7.4.5.3. Enterprise and Industrial Applications
11.7.4.5.3.1.
Logistics, Packaging, and
Warehouse Applications
11.7.4.5.3.2.
Other Industrial
Applications
11.7.4.5.4. Other Application
11.7.5. Italy
11.7.5.1. Italy Smart Eyewear Market Revenue (US$ Mn) and Forecasts, By
Technology
11.7.5.1.1. Augmented Reality
11.7.5.1.2. Virtual Reality
11.7.5.1.3. Other (Mixed reality and other)
11.7.5.2. Italy Market Revenue (US$ Mn) and Forecasts, By Distribution
Channel
11.7.5.2.1. Retail Stores
11.7.5.2.2. Online Stores
11.7.5.2.3. Optical Stores
11.7.5.2.4. Independent Brands
11.7.5.3. Italy Market Revenue (US$ Mn) and Forecasts, By Product Type
11.7.5.3.1. Head-Mounted Displays
11.7.5.3.2. Assisted Reality Glasses
11.7.5.3.3. Mixed Reality Holographic Displays
11.7.5.3.4. Smart Helmets
11.7.5.3.5. Others
11.7.5.4. Italy Market Revenue (US$ Mn) and Forecasts, By Operating
System
11.7.5.4.1. Android
11.7.5.4.2. Linux
11.7.5.4.3. Others
11.7.5.5. Italy Market Revenue (US$ Mn) and Forecasts, By Application
11.7.5.5.1. Consumer Electronics
11.7.5.5.1.1.
Fitness and Sports
Applications
11.7.5.5.1.2.
Infotainment and
Multimedia Applications
11.7.5.5.1.3.
Garments and Fashion
Applications
11.7.5.5.1.4.
Multi-Function
Applications
11.7.5.5.2. Healthcare
11.7.5.5.3. Enterprise and Industrial Applications
11.7.5.5.3.1.
Logistics, Packaging, and
Warehouse Applications
11.7.5.5.3.2.
Other Industrial
Applications
11.7.5.5.4. Other Application
11.7.6. Rest of Europe
11.7.6.1. Rest of Europe Smart Eyewear Market Revenue (US$ Mn) and
Forecasts, By Technology
11.7.6.1.1. Augmented Reality
11.7.6.1.2. Virtual Reality
11.7.6.1.3. Other (Mixed reality and other)
11.7.6.2. Rest of Europe Market Revenue (US$ Mn) and Forecasts, By
Distribution Channel
11.7.6.2.1. Retail Stores
11.7.6.2.2. Online Stores
11.7.6.2.3. Optical Stores
11.7.6.2.4. Independent Brands
11.7.6.3. Rest of Europe Smart Eyewear Market Revenue (US$ Mn) and
Forecasts, By Product Type
11.7.6.3.1. Head-Mounted Displays
11.7.6.3.2. Assisted Reality Glasses
11.7.6.3.3. Mixed Reality Holographic Displays
11.7.6.3.4. Smart Helmets
11.7.6.3.5. Others
11.7.6.4. Rest of Europe Market Revenue (US$ Mn) and Forecasts, By
Operating System
11.7.6.4.1. Android
11.7.6.4.2. Linux
11.7.6.4.3. Others
11.7.6.5. Rest of Europe Market Revenue (US$ Mn) and Forecasts, By
Application
11.7.6.5.1. Consumer Electronics
11.7.6.5.1.1.
Fitness and Sports
Applications
11.7.6.5.1.2.
Infotainment and
Multimedia Applications
11.7.6.5.1.3.
Garments and Fashion
Applications
11.7.6.5.1.4.
Multi-Function
Applications
11.7.6.5.2. Healthcare
11.7.6.5.3. Enterprise and Industrial Applications
11.7.6.5.3.1.
Logistics, Packaging, and
Warehouse Applications
11.7.6.5.3.2.
Other Industrial
Applications
11.7.6.5.4. Other Application
11.8. Key Segment for Channeling Investments
11.8.1. By Country
11.8.2. By Technology
11.8.3. By Distribution Channel
11.8.4. By Product Type
11.8.5. By Operating System
11.8.6. By Application
12. Asia Pacific Smart Eyewear Market Analysis and Forecasts,
2018 – 2026
12.1. Overview
12.1.1. Asia Pacific Market Revenue (US$ Mn)
12.2. Asia Pacific Market Revenue (US$ Mn) and Forecasts, By
Technology
12.2.1. Augmented Reality
12.2.2. Virtual Reality
12.2.3. Other (Mixed reality and other)
12.3. Asia Pacific Market Revenue (US$ Mn) and Forecasts, By
Distribution Channel
12.3.1. Retail Stores
12.3.2. Online Stores
12.3.3. Optical Stores
12.3.4. Independent Brands
12.4. Asia Pacific Market Revenue (US$ Mn) and Forecasts, By Product
Type
12.4.1. Head-Mounted Displays
12.4.2. Assisted Reality Glasses
12.4.3. Mixed Reality Holographic Displays
12.4.4. Smart Helmets
12.4.5. Others
12.5. Asia Pacific Market Revenue (US$ Mn) and Forecasts, By
Operating System
12.5.1. Android
12.5.2. Linux
12.5.3. Others
12.6. Asia Pacific Market Revenue (US$ Mn) and Forecasts, By
Application
12.6.1. Consumer Electronics
12.6.1.1. Fitness and Sports Applications
12.6.1.2. Infotainment and Multimedia Applications
12.6.1.3. Garments and Fashion Applications
12.6.1.4. Multi-Function Applications
12.6.2. Healthcare
12.6.3. Enterprise and Industrial Applications
12.6.3.1. Logistics, Packaging, and Warehouse Applications
12.6.3.2. Other Industrial Applications
12.6.4. Other Application
12.7. Asia Pacific Market Revenue (US$ Mn) and Forecasts, By Country
12.7.1. China
12.7.1.1. China Smart Eyewear Market Revenue (US$ Mn) and Forecasts, By
Technology
12.7.1.1.1. Augmented Reality
12.7.1.1.2. Virtual Reality
12.7.1.1.3. Other (Mixed reality and other)
12.7.1.2. China Market Revenue (US$ Mn) and Forecasts, By Distribution
Channel
12.7.1.2.1. Retail Stores
12.7.1.2.2. Online Stores
12.7.1.2.3. Optical Stores
12.7.1.2.4. Independent Brands
12.7.1.3. China Market Revenue (US$ Mn) and Forecasts, By Product Type
12.7.1.3.1. Head-Mounted Displays
12.7.1.3.2. Assisted Reality Glasses
12.7.1.3.3. Mixed Reality Holographic Displays
12.7.1.3.4. Smart Helmets
12.7.1.3.5. Others
12.7.1.4. China Market Revenue (US$ Mn) and Forecasts, By Operating
System
12.7.1.4.1. Android
12.7.1.4.2. Linux
12.7.1.4.3. Others
12.7.1.5. China Market Revenue (US$ Mn) and Forecasts, By Application
12.7.1.5.1. Consumer Electronics
12.7.1.5.1.1. Fitness and Sports Applications
12.7.1.5.1.2. Infotainment and Multimedia Applications
12.7.1.5.1.3. Garments and Fashion Applications
12.7.1.5.1.4. Multi-Function Applications
12.7.1.5.2. Healthcare
12.7.1.5.3. Enterprise and Industrial Applications
12.7.1.5.3.1.
Logistics, Packaging, and
Warehouse Applications
12.7.1.5.3.2.
Other Industrial
Applications
12.7.1.5.4. Other Application
12.7.2. Japan
12.7.2.1. Japan Smart Eyewear Market Revenue (US$ Mn) and Forecasts, By
Technology
12.7.2.1.1. Augmented Reality
12.7.2.1.2. Virtual Reality
12.7.2.1.3. Other (Mixed reality and other)
12.7.2.2. Japan Market Revenue (US$ Mn) and Forecasts, By Distribution
Channel
12.7.2.2.1. Retail Stores
12.7.2.2.2. Online Stores
12.7.2.2.3. Optical Stores
12.7.2.2.4. Independent Brands
12.7.2.3. Japan Market Revenue (US$ Mn) and Forecasts, By Product Type
12.7.2.3.1. Head-Mounted Displays
12.7.2.3.2. Assisted Reality Glasses
12.7.2.3.3. Mixed Reality Holographic Displays
12.7.2.3.4. Smart Helmets
12.7.2.3.5. Others
12.7.2.4. Japan Market Revenue (US$ Mn) and Forecasts, By Operating
System
12.7.2.4.1. Android
12.7.2.4.2. Linux
12.7.2.4.3. Others
12.7.2.5. Japan Smart Eyewear Market Revenue (US$ Mn) and Forecasts, By
Application
12.7.2.5.1. Consumer Electronics
12.7.2.5.1.1.
Fitness and Sports
Applications
12.7.2.5.1.2.
Infotainment and
Multimedia Applications
12.7.2.5.1.3.
Garments and Fashion
Applications
12.7.2.5.1.4.
Multi-Function
Applications
12.7.2.5.2. Healthcare
12.7.2.5.3. Enterprise and Industrial Applications
12.7.2.5.3.1.
Logistics, Packaging, and
Warehouse Applications
12.7.2.5.3.2.
Other Industrial
Applications
12.7.2.5.4. Other Application
12.7.3. India
12.7.3.1. India Smart Eyewear Market Revenue (US$ Mn) and Forecasts, By
Technology
12.7.3.1.1. Augmented Reality
12.7.3.1.2. Virtual Reality
12.7.3.1.3. Other (Mixed reality and other)
12.7.3.2. India Market Revenue (US$ Mn) and Forecasts, By Distribution
Channel
12.7.3.2.1. Retail Stores
12.7.3.2.2. Online Stores
12.7.3.2.3. Optical Stores
12.7.3.2.4. Independent Brands
12.7.3.3. India Market Revenue (US$ Mn) and Forecasts, By Product Type
12.7.3.3.1. Head-Mounted Displays
12.7.3.3.2. Assisted Reality Glasses
12.7.3.3.3. Mixed Reality Holographic Displays
12.7.3.3.4. Smart Helmets
12.7.3.3.5. Others
12.7.3.4. India Smart Eyewear Market Revenue (US$ Mn) and Forecasts, By
Operating System
12.7.3.4.1. Android
12.7.3.4.2. Linux
12.7.3.4.3. Others
12.7.3.5. India Market Revenue (US$ Mn) and Forecasts, By Application
12.7.3.5.1. Consumer Electronics
12.7.3.5.1.1.
Fitness and Sports
Applications
12.7.3.5.1.2.
Infotainment and
Multimedia Applications
12.7.3.5.1.3.
Garments and Fashion
Applications
12.7.3.5.1.4.
Multi-Function
Applications
12.7.3.5.2. Healthcare
12.7.3.5.3. Enterprise and Industrial Applications
12.7.3.5.3.1.
Logistics, Packaging, and
Warehouse Applications
12.7.3.5.3.2.
Other Industrial
Applications
12.7.3.5.4. Other Application
12.7.4. Southeast Asia
12.7.4.1. Southeast Asia Market Revenue (US$ Mn) and Forecasts, By
Technology
12.7.4.1.1. Augmented Reality
12.7.4.1.2. Virtual Reality
12.7.4.1.3. Other (Mixed reality and other)
12.7.4.2. Southeast Asia Smart Eyewear Market Revenue (US$ Mn) and
Forecasts, By Distribution Channel
12.7.4.2.1. Retail Stores
12.7.4.2.2. Online Stores
12.7.4.2.3. Optical Stores
12.7.4.2.4. Independent Brands
12.7.4.3. Southeast Asia Market Revenue (US$ Mn) and Forecasts, By
Product Type
12.7.4.3.1. Head-Mounted Displays
12.7.4.3.2. Assisted Reality Glasses
12.7.4.3.3. Mixed Reality Holographic Displays
12.7.4.3.4. Smart Helmets
12.7.4.3.5. Others
12.7.4.4. Southeast Asia Smart Eyewear Market Revenue (US$ Mn) and
Forecasts, By Operating System
12.7.4.4.1. Android
12.7.4.4.2. Linux
12.7.4.4.3. Others
12.7.4.5. Southeast Asia Market Revenue (US$ Mn) and Forecasts, By
Application
12.7.4.5.1. Consumer Electronics
12.7.4.5.1.1.
Fitness and Sports
Applications
12.7.4.5.1.2.
Infotainment and
Multimedia Applications
12.7.4.5.1.3.
Garments and Fashion
Applications
12.7.4.5.1.4.
Multi-Function
Applications
12.7.4.5.2. Healthcare
12.7.4.5.3. Enterprise and Industrial Applications
12.7.4.5.3.1.
Logistics, Packaging, and
Warehouse Applications
12.7.4.5.3.2.
Other Industrial
Applications
12.7.4.5.4. Other Application
12.7.5. Rest of Asia Pacific
12.7.5.1. Rest of Asia Pacific Smart Eyewear Market Revenue (US$ Mn) and
Forecasts, By Technology
12.7.5.1.1. Augmented Reality
12.7.5.1.2. Virtual Reality
12.7.5.1.3. Other (Mixed reality and other)
12.7.5.2. Rest of Asia Pacific Market Revenue (US$ Mn) and Forecasts, By
Distribution Channel
12.7.5.2.1. Retail Stores
12.7.5.2.2. Online Stores
12.7.5.2.3. Optical Stores
12.7.5.2.4. Independent Brands
12.7.5.3. Rest of Asia Pacific Smart Eyewear Market Revenue (US$ Mn) and
Forecasts, By Product Type
12.7.5.3.1. Head-Mounted Displays
12.7.5.3.2. Assisted Reality Glasses
12.7.5.3.3. Mixed Reality Holographic Displays
12.7.5.3.4. Smart Helmets
12.7.5.3.5. Others
12.7.5.4. Rest of Asia Pacific Market Revenue (US$ Mn) and Forecasts, By
Operating System
12.7.5.4.1. Android
12.7.5.4.2. Linux
12.7.5.4.3. Others
12.7.5.5. Rest of Asia Pacific Market Revenue (US$ Mn) and Forecasts, By
Application
12.7.5.5.1. Consumer Electronics
12.7.5.5.1.1.
Fitness and Sports
Applications
12.7.5.5.1.2.
Infotainment and
Multimedia Applications
12.7.5.5.1.3.
Garments and Fashion
Applications
12.7.5.5.1.4.
Multi-Function
Applications
12.7.5.5.2. Healthcare
12.7.5.5.3. Enterprise and Industrial Applications
12.7.5.5.3.1.
Logistics, Packaging, and
Warehouse Applications
12.7.5.5.3.2.
Other Industrial
Applications
12.7.5.5.4. Other Application
12.8. Key Segment for Channeling Investments
12.8.1. By Country
12.8.2. By Technology
12.8.3. By Distribution Channel
12.8.4. By Product Type
12.8.5. By Operating System
12.8.6. By Application
13. Middle East and Africa Smart Eyewear Market Analysis and
Forecasts, 2018 – 2026
13.1. Overview
13.1.1. Middle East and Africa Market Revenue (US$ Mn)
13.2. Middle East and Africa Market Revenue (US$ Mn) and Forecasts,
By Technology
13.2.1. Augmented Reality
13.2.2. Virtual Reality
13.2.3. Other (Mixed reality and other)
13.3. Middle East and Africa Market Revenue (US$ Mn) and Forecasts,
By Distribution Channel
13.3.1. Retail Stores
13.3.2. Online Stores
13.3.3. Optical Stores
13.3.4. Independent Brands
13.4. Middle East and Africa Market Revenue (US$ Mn) and Forecasts,
By Product Type
13.4.1. Head-Mounted Displays
13.4.2. Assisted Reality Glasses
13.4.3. Mixed Reality Holographic Displays
13.4.4. Smart Helmets
13.4.5. Others
13.5. Middle East and Africa Market Revenue (US$ Mn) and Forecasts,
By Operating System
13.5.1. Android
13.5.2. Linux
13.5.3. Others
13.6. Middle East and Africa Market Revenue (US$ Mn) and Forecasts,
By Application
13.6.1. Consumer Electronics
13.6.1.1. Fitness and Sports Applications
13.6.1.2. Infotainment and Multimedia Applications
13.6.1.3. Garments and Fashion Applications
13.6.1.4. Multi-Function Applications
13.6.2. Healthcare
13.6.3. Enterprise and Industrial Applications
13.6.3.1. Logistics, Packaging, and Warehouse Applications
13.6.3.2. Other Industrial Applications
13.6.4. Other Application
13.7. Middle East and Africa Market Revenue (US$ Mn) and Forecasts,
By Country
13.7.1. GCC Countries
13.7.1.1. GCC Countries Smart Eyewear Market Revenue (US$ Mn) and
Forecasts, By Technology
13.7.1.1.1. Augmented Reality
13.7.1.1.2. Virtual Reality
13.7.1.1.3. Other (Mixed reality and other)
13.7.1.2. GCC Countries Smart Eyewear Market Revenue (US$ Mn) and
Forecasts, By Distribution Channel
13.7.1.2.1. Retail Stores
13.7.1.2.2. Online Stores
13.7.1.2.3. Optical Stores
13.7.1.2.4. Independent Brands
13.7.1.3. GCC Countries Market Revenue (US$ Mn) and Forecasts, By
Product Type
13.7.1.3.1. Head-Mounted Displays
13.7.1.3.2. Assisted Reality Glasses
13.7.1.3.3. Mixed Reality Holographic Displays
13.7.1.3.4. Smart Helmets
13.7.1.3.5. Others
13.7.1.4. GCC Countries Market Revenue (US$ Mn) and Forecasts, By
Operating System
13.7.1.4.1. Android
13.7.1.4.2. Linux
13.7.1.4.3. Others
13.7.1.5. GCC Countries Smart Eyewear Market Revenue (US$ Mn) and
Forecasts, By Application
13.7.1.5.1. Consumer Electronics
13.7.1.5.1.1.
Fitness and Sports
Applications
13.7.1.5.1.2.
Infotainment and
Multimedia Applications
13.7.1.5.1.3.
Garments and Fashion
Applications
13.7.1.5.1.4.
Multi-Function
Applications
13.7.1.5.2. Healthcare
13.7.1.5.3. Enterprise and Industrial Applications
13.7.1.5.3.1.
Logistics, Packaging, and
Warehouse Applications
13.7.1.5.3.2.
Other Industrial
Applications
13.7.1.5.4. Other Application
13.7.2. Southern Africa
13.7.2.1. Southern Africa Smart Eyewear Market Revenue (US$ Mn) and
Forecasts, By Technology
13.7.2.1.1. Augmented Reality
13.7.2.1.2. Virtual Reality
13.7.2.1.3. Other (Mixed reality and other)
13.7.2.2. Southern Africa Market Revenue (US$ Mn) and Forecasts, By
Distribution Channel
13.7.2.2.1. Retail Stores
13.7.2.2.2. Online Stores
13.7.2.2.3. Optical Stores
13.7.2.2.4. Independent Brands
13.7.2.3. Southern Africa Market Revenue (US$ Mn) and Forecasts, By
Product Type
13.7.2.3.1. Head-Mounted Displays
13.7.2.3.2. Assisted Reality Glasses
13.7.2.3.3. Mixed Reality Holographic Displays
13.7.2.3.4. Smart Helmets
13.7.2.3.5. Others
13.7.2.4. Southern Africa Market Revenue (US$ Mn) and Forecasts, By
Operating System
13.7.2.4.1. Android
13.7.2.4.2. Linux
13.7.2.4.3. Others
13.7.2.5. Southern Africa Smart Eyewear Market Revenue (US$ Mn) and
Forecasts, By Application
13.7.2.5.1. Consumer Electronics
13.7.2.5.1.1.
Fitness and Sports
Applications
13.7.2.5.1.2.
Infotainment and
Multimedia Applications
13.7.2.5.1.3.
Garments and Fashion
Applications
13.7.2.5.1.4.
Multi-Function Applications
13.7.2.5.2. Healthcare
13.7.2.5.3. Enterprise and Industrial Applications
13.7.2.5.3.1.
Logistics, Packaging, and
Warehouse Applications
13.7.2.5.3.2.
Other Industrial
Applications
13.7.2.5.4. Other Application
13.7.3. Rest of MEA
13.7.3.1. Rest of MEA Smart Eyewear Market Revenue (US$ Mn) and
Forecasts, By Technology
13.7.3.1.1. Augmented Reality
13.7.3.1.2. Virtual Reality
13.7.3.1.3. Other (Mixed reality and other)
13.7.3.2. Rest of MEA Market Revenue (US$ Mn) and Forecasts, By
Distribution Channel
13.7.3.2.1. Retail Stores
13.7.3.2.2. Online Stores
13.7.3.2.3. Optical Stores
13.7.3.2.4. Independent Brands
13.7.3.3. Rest of MEA Market Revenue (US$ Mn) and Forecasts, By Product
Type
13.7.3.3.1. Head-Mounted Displays
13.7.3.3.2. Assisted Reality Glasses
13.7.3.3.3. Mixed Reality Holographic Displays
13.7.3.3.4. Smart Helmets
13.7.3.3.5. Others
13.7.3.4. Rest of MEA Market Revenue (US$ Mn) and Forecasts, By
Operating System
13.7.3.4.1. Android
13.7.3.4.2. Linux
13.7.3.4.3. Others
13.7.3.5. Rest of MEA Market Revenue (US$ Mn) and Forecasts, By
Application
13.7.3.5.1. Consumer Electronics
13.7.3.5.1.1.
Fitness and Sports
Applications
13.7.3.5.1.2.
Infotainment and
Multimedia Applications
13.7.3.5.1.3.
Garments and Fashion
Applications
13.7.3.5.1.4.
Multi-Function
Applications
13.7.3.5.2. Healthcare
13.7.3.5.3. Enterprise and Industrial Applications
13.7.3.5.3.1.
Logistics, Packaging, and
Warehouse Applications
13.7.3.5.3.2.
Other Industrial
Applications
13.7.3.5.4. Other Application
13.8. Key Segment for Channeling Investments
13.8.1. By Country
13.8.2. By Technology
13.8.3. By Distribution Channel
13.8.4. By Product Type
13.8.5. By Operating System
13.8.6. By Application
14. Latin America Smart Eyewear Market Analysis and Forecasts,
2018 – 2026
14.1. Overview
14.1.1. Latin America Market Revenue (US$ Mn)
14.2. Latin America Market Revenue (US$ Mn) and Forecasts, By
Technology
14.2.1. Augmented Reality
14.2.2. Virtual Reality
14.2.3. Other (Mixed reality and other)
14.3. Latin America Market Revenue (US$ Mn) and Forecasts, By
Distribution Channel
14.3.1. Retail Stores
14.3.2. Online Stores
14.3.3. Optical Stores
14.3.4. Independent Brands
14.4. Latin America Market Revenue (US$ Mn) and Forecasts, By
Product Type
14.4.1. Head-Mounted Displays
14.4.2. Assisted Reality Glasses
14.4.3. Mixed Reality Holographic Displays
14.4.4. Smart Helmets
14.4.5. Others
14.5. Latin America Market Revenue (US$ Mn) and Forecasts, By
Operating System
14.5.1. Android
14.5.2. Linux
14.5.3. Others
14.6. Latin America Market Revenue (US$ Mn) and Forecasts, By
Application
14.6.1. Consumer Electronics
14.6.1.1. Fitness and Sports Applications
14.6.1.2. Infotainment and Multimedia Applications
14.6.1.3. Garments and Fashion Applications
14.6.1.4. Multi-Function Applications
14.6.2. Healthcare
14.6.3. Enterprise and Industrial Applications
14.6.3.1. Logistics, Packaging, and Warehouse Applications
14.6.3.2. Other Industrial Applications
14.6.4. Other Application
14.7. Latin America Market Revenue (US$ Mn) and Forecasts, By
Country
14.7.1. Brazil
14.7.1.1. Brazil Smart Eyewear Market Revenue (US$ Mn) and Forecasts, By
Technology
14.7.1.1.1. Augmented Reality
14.7.1.1.2. Virtual Reality
14.7.1.1.3. Other (Mixed reality and other)
14.7.1.2. Brazil Market Revenue (US$ Mn) and Forecasts, By Distribution
Channel
14.7.1.2.1. Retail Stores
14.7.1.2.2. Online Stores
14.7.1.2.3. Optical Stores
14.7.1.2.4. Independent Brands
14.7.1.3. Brazil Market Revenue (US$ Mn) and Forecasts, By Product Type
14.7.1.3.1. Head-Mounted Displays
14.7.1.3.2. Assisted Reality Glasses
14.7.1.3.3. Mixed Reality Holographic Displays
14.7.1.3.4. Smart Helmets
14.7.1.3.5. Others
14.7.1.4. Brazil Market Revenue (US$ Mn) and Forecasts, By Operating
System
14.7.1.4.1. Android
14.7.1.4.2. Linux
14.7.1.4.3. Others
14.7.1.5. Brazil Market Revenue (US$ Mn) and Forecasts, By Application
14.7.1.5.1. Consumer Electronics
14.7.1.5.1.1.
Fitness and Sports
Applications
14.7.1.5.1.2.
Infotainment and
Multimedia Applications
14.7.1.5.1.3.
Garments and Fashion
Applications
14.7.1.5.1.4.
Multi-Function
Applications
14.7.1.5.2. Healthcare
14.7.1.5.3. Enterprise and Industrial Applications
14.7.1.5.3.1.
Logistics, Packaging, and
Warehouse Applications
14.7.1.5.3.2.
Other Industrial
Applications
14.7.1.5.4. Other Application
14.7.2. Rest of Latin America
14.7.2.1. Rest of Latin America Smart Eyewear Market Revenue (US$ Mn)
and Forecasts, By Technology
14.7.2.1.1. Augmented Reality
14.7.2.1.2. Virtual Reality
14.7.2.1.3. Other (Mixed reality and other)
14.7.2.2. Rest of Latin America Market Revenue (US$ Mn) and Forecasts,
By Distribution Channel
14.7.2.2.1. Retail Stores
14.7.2.2.2. Online Stores
14.7.2.2.3. Optical Stores
14.7.2.2.4. Independent Brands
14.7.2.3. Rest of Latin America Market Revenue (US$ Mn) and Forecasts,
By Product Type
14.7.2.3.1. Head-Mounted Displays
14.7.2.3.2. Assisted Reality Glasses
14.7.2.3.3. Mixed Reality Holographic Displays
14.7.2.3.4. Smart Helmets
14.7.2.3.5. Others
14.7.2.4. Rest of Latin America Market Revenue (US$ Mn) and Forecasts,
By Operating System
14.7.2.4.1. Android
14.7.2.4.2. Linux
14.7.2.4.3. Others
14.7.2.5. Rest of Latin America Market Revenue (US$ Mn) and Forecasts,
By Application
14.7.2.5.1. Consumer Electronics
14.7.2.5.1.1.
Fitness and Sports
Applications
14.7.2.5.1.2.
Infotainment and
Multimedia Applications
14.7.2.5.1.3.
Garments and Fashion
Applications
14.7.2.5.1.4.
Multi-Function
Applications
14.7.2.5.2. Healthcare
14.7.2.5.3. Enterprise and Industrial Applications
14.7.2.5.3.1.
Logistics, Packaging, and
Warehouse Applications
14.7.2.5.3.2.
Other Industrial
Applications
14.7.2.5.4. Other Application
14.8. Key Segment for Channeling Investments
14.8.1. By Country
14.8.2. By Technology
14.8.3. By Distribution Channel
14.8.4. By Product Type
14.8.5. By Operating System
14.8.6. By Application
15. Competitive Benchmarking
15.1. Player Positioning Analysis
15.2. Global Presence and Growth Strategies
16. Player Profiles
16.1. Microsoft Corporation
16.1.1. Company Details
16.1.2. Company Overview
16.1.3. Product Offerings
16.1.4. Key Developments
16.1.5. Financial Analysis
16.1.6. SWOT Analysis
16.1.7. Business Strategies
16.2. Meta Company
16.2.1. Company Details
16.2.2. Company Overview
16.2.3. Product Offerings
16.2.4. Key Developments
16.2.5. Financial Analysis
16.2.6. SWOT Analysis
16.2.7. Business Strategies
16.3. Epson America, Inc
16.3.1. Company Details
16.3.2. Company Overview
16.3.3. Product Offerings
16.3.4. Key Developments
16.3.5. Financial Analysis
16.3.6. SWOT Analysis
16.3.7. Business Strategies
16.4. BAE Systems
16.4.1. Company Details
16.4.2. Company Overview
16.4.3. Product Offerings
16.4.4. Key Developments
16.4.5. Financial Analysis
16.4.6. SWOT Analysis
16.4.7. Business Strategies
16.5. Samsung Electronics Co., Ltd
16.5.1. Company Details
16.5.2. Company Overview
16.5.3. Product Offerings
16.5.4. Key Developments
16.5.5. Financial Analysis
16.5.6. SWOT Analysis
16.5.7. Business Strategies
16.6. Osterhout Design Group, Inc
16.6.1. Company Details
16.6.2. Company Overview
16.6.3. Product Offerings
16.6.4. Key Developments
16.6.5. Financial Analysis
16.6.6. SWOT Analysis
16.6.7. Business Strategies
16.7. Recon Instruments, Inc.
16.7.1. Company Details
16.7.2. Company Overview
16.7.3. Product Offerings
16.7.4. Key Developments
16.7.5. Financial Analysis
16.7.6. SWOT Analysis
16.7.7. Business Strategies
16.8. Kopin Corporation
16.8.1. Company Details
16.8.2. Company Overview
16.8.3. Product Offerings
16.8.4. Key Developments
16.8.5. Financial Analysis
16.8.6. SWOT Analysis
16.8.7. Business Strategies
16.9. Google Inc.
16.9.1. Company Details
16.9.2. Company Overview
16.9.3. Product Offerings
16.9.4. Key Developments
16.9.5. Financial Analysis
16.9.6. SWOT Analysis
16.9.7. Business Strategies
16.10. Sony Corporation
16.10.1.
Company Details
16.10.2.
Company Overview
16.10.3.
Product Offerings
16.10.4.
Key Developments
16.10.5.
Financial Analysis
16.10.6.
SWOT Analysis
16.10.7.
Business Strategies
16.11. VUZIX
16.11.1.
Company Details
16.11.2.
Company Overview
16.11.3.
Product Offerings
16.11.4.
Key Developments
16.11.5.
Financial Analysis
16.11.6.
SWOT Analysis
16.11.7.
Business Strategies
16.12. Lenovo
16.12.1.
Company Details
16.12.2.
Company Overview
16.12.3.
Product Offerings
16.12.4.
Key Developments
16.12.5.
Financial Analysis
16.12.6.
SWOT Analysis
16.12.7.
Business Strategies
16.13. Lumus Ltd
16.13.1.
Company Details
16.13.2.
Company Overview
16.13.3.
Product Offerings
16.13.4.
Key Developments
16.13.5.
Financial Analysis
16.13.6.
SWOT Analysis
16.13.7.
Business Strategies
16.14. Optinvent S.A.
16.14.1. Company Details
16.14.2. Company Overview
16.14.3. Product Offerings
16.14.4. Key Developments
16.14.5. Financial Analysis
16.14.6. SWOT Analysis
16.14.7. Business Strategies
Note: This ToC is
tentative and can be changed according to the research study conducted during
the course of report completion.
At Absolute Markets Insights, we are engaged in building both global as well as country specific reports. As a result, the approach taken for deriving the estimation and forecast for a specific country is a bit unique and different in comparison to the global research studies. In this case, we not only study the concerned market factors & trends prevailing in a particular country (from secondary research) but we also tend to calculate the actual market size & forecast from the revenue generated from the market participants involved in manufacturing or distributing the any concerned product. These companies can also be service providers. For analyzing any country specifically, we do consider the growth factors prevailing under the states/cities/county for the same. For instance, if we are analyzing an industry specific to United States, we primarily need to study about the states present under the same(where the product/service has the highest growth). Similar analysis will be followed by other countries. Our scope of the report changes with different markets.
Our research study is mainly implement through a mix of both secondary and primary research. Various sources such as industry magazines, trade journals, and government websites and trade associations are reviewed for gathering precise data. Primary interviews are conducted to validate the market size derived from secondary research. Industry experts, major manufacturers and distributors are contacted for further validation purpose on the current market penetration and growth trends.
Prominent participants in our primary research process include:
- Key Opinion Leaders namely the CEOs, CSOs, VPs, purchasing managers, amongst others
- Research and development participants, distributors/suppliers and subject matter experts
Secondary Research includes data extracted from paid data sources:
- Reuters
- Factiva
- Bloomberg
- One Source
- Hoovers
Research Methodology

Key Inclusions


