
Smart Router Market Share, Size, Trends, Industry Analysis Report By Product (300 Mbps and below, 300-1000 Mbps, Above 1000 Mbps); By End User (Home Office Using, Entertainment Using); by Region (U.S., Canada, Mexico, France, The UK, Spain, Germany, Italy, Nordic Countries, Benelux Union, Rest of Europe, China, Japan, India, New Zealand, Australia, South Korea, Southeast Asia, Rest of Asia Pacific, Saudi Arabia, UAE, Egypt, Kuwait, South Africa, Rest of Middle East & Africa, Brazil, Argentina, Rest of Latin America) – Global Insights, Growth, Size, Comparative Analysis, Trends and Forecast, 2019–2027
Industry Trends
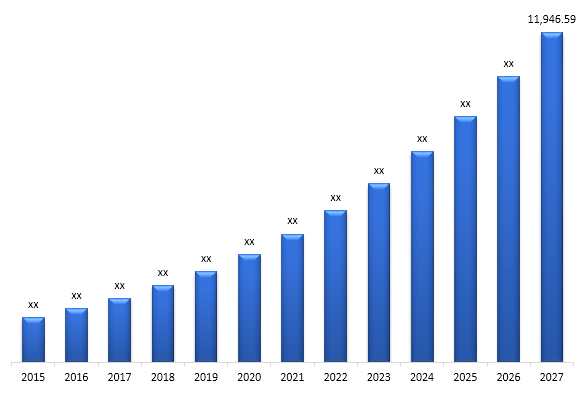
Global Smart Router Market was valued at US$ 7,834.33 million in 2018 and is expected to reach US$ 11,946.59 million by 2027, growing at an estimated CAGR of 4.8% over the forecast period.
Smart Router Market is witnessing a notable growth. The basic drivers of the market are increased consumer and business demand for web-enabled appliances and growth in IP traffic. In addition, the growing need for quicker internet connectivity among customers stimulates demand for wireless routers with efficient connectivity. Internet traffic is growing at a continuous pace. Rising consumption of online videos and social media content is giving rise to a requirement for routers that are relatively more efficient.
The increasing trend of internet-enabled devices and the rising need for internet connectivity are key variables expected to positively affect the development of the Internet of Things industry, globally. In addition, the significance of the Internet of Things (IoT) is increasing in public sectors and governmental organizations due to the increasing need for remote monitoring systems and devices that are enabled by the Internet. These devices and systems can function effectively and serve their customers better. Similarly, customers are putting enormous pressure on sectors to boost IoT consumption by adopting smart devices to decrease time for different purchasing, shopping and similar activities. This is expected to drive the demand for global smart routers market.
The significant growth drivers impacting the smart router market are the Internet industry's volatile growth combined with mobility demand, and the implementation of smart devices such as smart phones, tablets, and smart TV, all driving the worldwide wireless router market's development. In addition, demand for quicker internet, an increase in the range of wireless networks, and the amount of connected phones is driving this market's development. Challenges such as absence of skilled labour needed to deliver and maintain service quality and ease of access lead to a potential hacking risk that requires an efficient cyber-security system in place.
Key Developments
Market participants have been taking efforts to differentiate their solutions by offering solutions that are more reliable and secure. Partnerships with security solution providers have also assisted router companies towards making their devices safer. For instance, in January 2020, a reputed router manufacturer TP Link launched HomeCareTM Pro, which is a router with device security functionalities from Avira, a security software provider. The company also recently announced launch of five high performance, WiFi 6 technology based router products at different price points. Few of the recently launched products of the company include TP Link Deco X10, Archer AX11000 gaming wireless router, Archer AX6000 and Archer AX1800.
Cisco, one of the other major market participants launched WiFi 6 technology based routers in April 2019. The product claims to deliver four times better performance than the company’s previous product, WiFi 5 router. The product is targeted to enterprises as well as individual users.
Product and End User Insights
300 mbps and below held the majority share in the global smart routers market in 2018. This dominance is mainly attributed to the high demand from residential users. However, safety and privacy issues may hamper its growth rate. In addition, the market for residential routers is bound to boost with rising penetration of internet in emerging economies and sale of smart phones. In developed countries such as the U.S., rising investment towards smart homes and demand for high-end products will be the market influencers. In terms of end users, the market has been slit into home users and commercial users. In 2018, the home user segment held a major share in the global smart routers market. Market participants have been introducing innovative products targeting residential users. For instance, NETGEAR routers are capable of turning TV into an entertainment hub with thousands of streaming movies, TV shows and songs.
Region Insights
In the present scenario, the North America region dominates the smart router market generating a significant demand. This is attributed to relatively higher adoption of technology and internet penetration. In the North America, the U.S. holds a market share of slightly more than 73%. The country is a prime target market for players offering WiFi 6 standard routers and high end gaming routers. However, the Asia Pacific region will grow at a faster pace owing to rising demand in countries such as China, Japan, India and South Korea. In the Asia Pacific region, China accounts for a market share of 37% followed by Japan and South Korea. India will witness the fastest growth in terms of demand during the next six years owing to rapid digitization in the country.
Smart Router Market Revenue & Forecast, (US$ Million), 2015 – 2027
Competitive Landscape
The report provides both, qualitative and quantitative research of smart router market, as well as provides comprehensive insights and development methods adopted by the key contenders. The report also offers extensive research on the key players in this market and details on the competitiveness of these players. Key business strategies such as mergers and acquisitions (M&A), affiliations, collaborations, and contracts adopted by these major market participants are also recognized and analysed in the report. For each company, the report studies their global presence, competitors, service offerings and specification amongst others.
Some of the leading manufacturers in the smart router market are TP-Link, D-Link Corporation, Cisco Systems, Inc., Xiaomi Corporation, Allied Telesis Holdings K.K., Huawei Technologies Co., Ltd., Hewlett-Packard, ADTRAN, Inc., Enterasys Networks, Inc., Verizon, AsusTek Computer Inc., Edimax Technology Co., Ltd., and Netgear Inc. among others.

Smart Router Market:
- By Product
- 300 Mbps and below
- 300-1000 Mbps
- Above 1000 Mbps
- By End User
- Residential
- Commercial
- By Geography
- North America
- U.S.
- Canada
- Mexico
- Europe
- France
- The UK
- Spain
- Germany
- Italy
- Nordic Countries
- Denmark
- Finland
- Iceland
- Sweden
- Norway
- Benelux Union
- Belgium
- The Netherlands
- Luxembourg
- Rest of Europe
- Asia Pacific
- China
- Japan
- India
- New Zealand
- Australia
- South Korea
- Southeast Asia
- Indonesia
- Thailand
- Malaysia
- Singapore
- Rest of Southeast Asia
- Rest of Asia Pacific
- Middle East and Africa
- Saudi Arabia
- UAE
- Egypt
- Kuwait
- South Africa
- Rest of Middle East & Africa
- Latin America
- Brazil
- Argentina
- Rest of Latin America
- North America
Table of Contents
![]()
1.
Market Scope
1.1. Market
Segmentation
1.2. Years
Considered
1.2.1. Historic
Years: 2013 - 2017
1.2.2. Base
Year: 2018
1.2.3. Forecast
Years: 2019 – 2027
2.
Key Target Audiences
3.
Research Methodology
3.1. Primary
Research
3.1.1. Research
Questionnaire
3.1.2. Global
Percentage Breakdown
3.1.3. Primary
Interviews: Key Opinion Leaders (KOLs)
3.2. Secondary
Research
3.2.1. Paid
Databases
3.2.2. Secondary
Sources
3.3. Market
Size Estimates
3.3.1. Top-Down
Approach
3.3.2. Bottom-Up
Approach
3.4. Data
Triangulation Methodology
3.5. Research
Assumptions
4.
Recommendations and
Insights from AMI’s Perspective**
5.
Holistic Overview of Smart
Router Market
6.
Market Synopsis: Smart Router Market
7.
Smart Router Market
Analysis: Qualitative Perspective
7.1. Introduction
7.1.1. Product
Definition
7.1.2. Industry
Development
7.2. Market
Dynamics
7.2.1. Drivers
7.2.2. Restraints
7.2.3. Opportunities
7.2.4. Challenges
7.3. Trends in
Smart Router Market
7.4. Market
Determinants Radar Chart
7.5. Macro-Economic
and Micro-Economic Indicators: Smart Router Market
7.6. Porter’s
Five Force Analysis
8.
Global Smart Router Market
Analysis and Forecasts, 2019 – 2027
8.1. Overview
8.1.1. Global
Smart Router Market Revenue (US$ Mn)
8.2. Global
Smart Router Market Revenue (US$ Mn) and Forecasts, By Product
8.2.1. 300 Mbps
and below
8.2.1.1. Definition
8.2.1.2. Market Estimation and Penetration, 2013 – 2018
8.2.1.3. Market Forecast, 2019 – 2027
8.2.1.4. Compound Annual Growth Rate (CAGR)
8.2.1.5. Regional Bifurcation
8.2.1.5.1. North America
8.2.1.5.1.1. Market
Estimation, 2013 – 2018
8.2.1.5.1.2. Market
Forecast, 2019 – 2027
8.2.1.5.2. Europe
8.2.1.5.2.1. Market
Estimation, 2013 – 2018
8.2.1.5.2.2. Market
Forecast, 2019 – 2027
8.2.1.5.3. Asia Pacific
8.2.1.5.3.1. Market
Estimation, 2013 – 2018
8.2.1.5.3.2. Market
Forecast, 2019 – 2027
8.2.1.5.4. Middle East and Africa
8.2.1.5.4.1. Market
Estimation, 2013 – 2018
8.2.1.5.4.2. Market
Forecast, 2019 – 2027
8.2.1.5.5. Latin America
8.2.1.5.5.1. Market
Estimation, 2013 – 2018
8.2.1.5.5.2. Market
Forecast, 2019 – 2027
8.2.2. 300-1000
Mbps
8.2.2.1. Definition
8.2.2.2. Market Estimation and Penetration, 2013 – 2018
8.2.2.3. Market Forecast, 2019 – 2027
8.2.2.4. Compound Annual Growth Rate (CAGR)
8.2.2.5. Regional Bifurcation
8.2.2.5.1. North America
8.2.2.5.1.1. Market
Estimation, 2013 – 2018
8.2.2.5.1.2. Market
Forecast, 2019 – 2027
8.2.2.5.2. Europe
8.2.2.5.2.1. Market
Estimation, 2013 – 2018
8.2.2.5.2.2. Market
Forecast, 2019 – 2027
8.2.2.5.3. Asia Pacific
8.2.2.5.3.1. Market
Estimation, 2013 – 2018
8.2.2.5.3.2. Market
Forecast, 2019 – 2027
8.2.2.5.4. Middle East and Africa
8.2.2.5.4.1. Market
Estimation, 2013 – 2018
8.2.2.5.4.2. Market
Forecast, 2019 – 2027
8.2.2.5.5. Latin America
8.2.2.5.5.1. Market
Estimation, 2013 – 2018
8.2.2.5.5.2. Market
Forecast, 2019 – 2027
8.2.3. Above
1000 Mbps
8.2.3.1. Definition
8.2.3.2. Market Estimation and Penetration, 2013 – 2018
8.2.3.3. Market Forecast, 2019 – 2027
8.2.3.4. Compound Annual Growth Rate (CAGR)
8.2.3.5. Regional Bifurcation
8.2.3.5.1. North America
8.2.3.5.1.1. Market
Estimation, 2013 – 2018
8.2.3.5.1.2. Market
Forecast, 2019 – 2027
8.2.3.5.2. Europe
8.2.3.5.2.1. Market
Estimation, 2013 – 2018
8.2.3.5.2.2. Market
Forecast, 2019 – 2027
8.2.3.5.3. Asia Pacific
8.2.3.5.3.1. Market
Estimation, 2013 – 2018
8.2.3.5.3.2. Market
Forecast, 2019 – 2027
8.2.3.5.4. Middle East and Africa
8.2.3.5.4.1. Market
Estimation, 2013 – 2018
8.2.3.5.4.2. Market
Forecast, 2019 – 2027
8.2.3.5.5. Latin America
8.2.3.5.5.1. Market
Estimation, 2013 – 2018
8.2.3.5.5.2. Market
Forecast, 2019 – 2027
8.3. Key
Segment for Channeling Investments
8.3.1. By
Product
9.
Global Smart Router Market
Analysis and Forecasts, 2019 – 2027
9.1. Overview
9.2. Global
Smart Router Market Revenue (US$ Mn) and Forecasts, By End User
9.2.1. Home
office User
9.2.1.1. Definition
9.2.1.2. Market Estimation and Penetration, 2013 – 2018
9.2.1.3. Market Forecast, 2019 – 2027
9.2.1.4. Compound Annual Growth Rate (CAGR)
9.2.1.5. Regional Bifurcation
9.2.1.5.1. North America
9.2.1.5.1.1. Market
Estimation, 2013 – 2018
9.2.1.5.1.2. Market
Forecast, 2019 – 2027
9.2.1.5.2. Europe
9.2.1.5.2.1. Market
Estimation, 2013 – 2018
9.2.1.5.2.2. Market
Forecast, 2019 – 2027
9.2.1.5.3. Asia Pacific
9.2.1.5.3.1. Market
Estimation, 2013 – 2018
9.2.1.5.3.2. Market
Forecast, 2019 – 2027
9.2.1.5.4. Middle East and Africa
9.2.1.5.4.1. Market
Estimation, 2013 – 2018
9.2.1.5.4.2. Market
Forecast, 2019 – 2027
9.2.1.5.5. Latin America
9.2.1.5.5.1. Market
Estimation, 2013 – 2018
9.2.1.5.5.2. Market
Forecast, 2019 – 2027
9.2.2. Entertainment
User
9.2.2.1. Definition
9.2.2.2. Market Estimation and Penetration, 2013 – 2018
9.2.2.3. Market Forecast, 2019 – 2027
9.2.2.4. Compound Annual Growth Rate (CAGR)
9.2.2.5. Regional Bifurcation
9.2.2.5.1. North America
9.2.2.5.1.1. Market
Estimation, 2013 – 2018
9.2.2.5.1.2. Market
Forecast, 2019 – 2027
9.2.2.5.2. Europe
9.2.2.5.2.1. Market
Estimation, 2013 – 2018
9.2.2.5.2.2. Market
Forecast, 2019 – 2027
9.2.2.5.3. Asia Pacific
9.2.2.5.3.1. Market
Estimation, 2013 – 2018
9.2.2.5.3.2. Market
Forecast, 2019 – 2027
9.2.2.5.4. Middle East and Africa
9.2.2.5.4.1. Market
Estimation, 2013 – 2018
9.2.2.5.4.2. Market
Forecast, 2019 – 2027
9.2.2.5.5. Latin America
9.2.2.5.5.1. Market
Estimation, 2013 – 2018
9.2.2.5.5.2. Market
Forecast, 2019 – 2027
9.3. Key
Segment for Channeling Investments
9.3.1.
By End User
10.
North America Smart Router
Market Analysis and Forecasts, 2019 - 2027
10.1. Overview
10.1.1. North
America Smart Router Market Revenue (US$ Mn)
10.2. North
America Smart Router Market Revenue (US$ Mn) and Forecasts, By Product
10.2.1. 300
Mbps and below
10.2.2. 300-1000
Mbps
10.2.3. Above
1000 Mbps
10.3. North
America Smart Router Market Revenue (US$ Mn) and Forecasts, By End User
10.3.1. Home
office User
10.3.2. Entertainment
User
10.4. North
America Smart Router Market Revenue (US$ Mn) and Forecasts, By Country
10.4.1. U.S
10.4.1.1. U.S Smart Router Market Revenue (US$ Mn) and Forecasts, By
Product
10.4.1.1.1. 300 Mbps and below
10.4.1.1.2. 300-1000 Mbps
10.4.1.1.3. Above 1000 Mbps
10.4.1.2. U.S Smart Router Market Revenue (US$ Mn) and Forecasts, By End
User
10.4.1.2.1. Home office User
10.4.1.2.2. Entertainment User
10.4.2. Canada
10.4.2.1. Canada Smart Router Market Revenue (US$ Mn) and Forecasts, By
Product
10.4.2.1.1. 300 Mbps and below
10.4.2.1.2. 300-1000 Mbps
10.4.2.1.3. Above 1000 Mbps
10.4.2.2. Canada Smart Router Market Revenue (US$ Mn) and Forecasts, By
End User
10.4.2.2.1. Home office User
10.4.2.2.2. Entertainment User
10.4.3. Mexico
10.4.3.1. Mexico Smart Router Market Revenue (US$ Mn) and Forecasts, By
Product
10.4.3.1.1. 300 Mbps and below
10.4.3.1.2. 300-1000 Mbps
10.4.3.1.3. Above 1000 Mbps
10.4.3.2. Mexico Smart Router Market Revenue (US$ Mn) and Forecasts, By
End User
10.4.3.2.1. Home office User
10.4.3.2.2. Entertainment User
10.4.4. Rest of
North America
10.4.4.1. Rest of North America Smart Router Market Revenue (US$ Mn) and
Forecasts, By Product
10.4.4.1.1. 300 Mbps and below
10.4.4.1.2. 300-1000 Mbps
10.4.4.1.3. Above 1000 Mbps
10.4.4.2. Rest of North America Smart Router Market Revenue (US$ Mn) and
Forecasts, By End User
10.4.4.2.1. Home office User
10.4.4.2.2. Entertainment User
10.5. Key
Segment for Channeling Investments
10.5.1. By
Country
10.5.2. By
Product
10.5.3. By End
User
11.
Europe Smart Router Market
Analysis and Forecasts, 2019 - 2027
11.1. Overview
11.1.1. Europe
Smart Router Market Revenue (US$ Mn)
11.2. Europe
Smart Router Market Revenue (US$ Mn) and Forecasts, By Product
11.2.1. 300
Mbps and below
11.2.2. 300-1000
Mbps
11.2.3. Above
1000 Mbps
11.3. Europe
Smart Router Market Revenue (US$ Mn) and Forecasts, By End User
11.3.1. Home
office User
11.3.2. Entertainment
User
11.4. Europe
Smart Router Market Revenue (US$ Mn) and Forecasts, By Country
11.4.1. France
11.4.1.1. France Smart Router Market Revenue (US$ Mn) and Forecasts, By
Product
11.4.1.1.1. 300 Mbps and below
11.4.1.1.2. 300-1000 Mbps
11.4.1.1.3. Above 1000 Mbps
11.4.1.2. France Smart Router Market Revenue (US$ Mn) and Forecasts, By
End User
11.4.1.2.1. Home office User
11.4.1.2.2. Entertainment User
11.4.2. The UK
11.4.2.1. The UK Smart Router Market Revenue (US$ Mn) and Forecasts, By
Product
11.4.2.1.1. 300 Mbps and below
11.4.2.1.2. 300-1000 Mbps
11.4.2.1.3. Above 1000 Mbps
11.4.2.2. The UK Smart Router Market Revenue (US$ Mn) and Forecasts, By
End User
11.4.2.2.1. Home office User
11.4.2.2.2. Entertainment User
11.4.3. Spain
11.4.3.1. Spain Smart Router Market Revenue (US$ Mn) and Forecasts, By
Product
11.4.3.1.1. 300 Mbps and below
11.4.3.1.2. 300-1000 Mbps
11.4.3.1.3. Above 1000 Mbps
11.4.3.2. Spain Smart Router Market Revenue (US$ Mn) and Forecasts, By
End User
11.4.3.2.1. Home office User
11.4.3.2.2. Entertainment User
11.4.4. Germany
11.4.4.1. Germany Smart Router Market Revenue (US$ Mn) and Forecasts, By
Product
11.4.4.1.1. 300 Mbps and below
11.4.4.1.2. 300-1000 Mbps
11.4.4.1.3. Above 1000 Mbps
11.4.4.2. Germany Smart Router Market Revenue (US$ Mn) and Forecasts, By
End User
11.4.4.2.1. Home office User
11.4.4.2.2. Entertainment User
11.4.5. Italy
11.4.5.1. Italy Smart Router Market Revenue (US$ Mn) and Forecasts, By
Product
11.4.5.1.1. 300 Mbps and below
11.4.5.1.2. 300-1000 Mbps
11.4.5.1.3. Above 1000 Mbps
11.4.5.2. Italy Smart Router Market Revenue (US$ Mn) and Forecasts, By
End User
11.4.5.2.1. Home office User
11.4.5.2.2. Entertainment User
11.4.6. Nordic
Countries
11.4.6.1. Nordic Countries Smart Router Market Revenue (US$ Mn) and
Forecasts, By Product
11.4.6.1.1. 300 Mbps and below
11.4.6.1.2. 300-1000 Mbps
11.4.6.1.3. Above 1000 Mbps
11.4.6.2. Nordic Countries Smart Router Market Revenue (US$ Mn) and
Forecasts, By End User
11.4.6.2.1. Home office User
11.4.6.2.2. Entertainment User
11.4.6.3. Nordic Countries Smart Router Market Revenue (US$ Mn) and
Forecasts, By Country
11.4.6.3.1. Denmark
11.4.6.3.2. Finland
11.4.6.3.3. Iceland
11.4.6.3.4. Sweden
11.4.6.3.5. Norway
11.4.7. Benelux
Union
11.4.7.1. Benelux Union Smart Router Market Revenue (US$ Mn) and Forecasts,
By Product
11.4.7.1.1. 300 Mbps and below
11.4.7.1.2. 300-1000 Mbps
11.4.7.1.3. Above 1000 Mbps
11.4.7.2. Benelux Union Smart Router Market Revenue (US$ Mn) and
Forecasts, By End User
11.4.7.2.1. Home office User
11.4.7.2.2. Entertainment User
11.4.7.3. Benelux Union Smart Router Market Revenue (US$ Mn) and
Forecasts, By Country
11.4.7.3.1. Belgium
11.4.7.3.2. The Netherlands
11.4.7.3.3. Luxembourg
11.4.8. Rest of
Europe
11.4.8.1. Rest of Europe Smart Router Market Revenue (US$ Mn) and
Forecasts, By Product
11.4.8.1.1. 300 Mbps and below
11.4.8.1.2. 300-1000 Mbps
11.4.8.1.3. Above 1000 Mbps
11.4.8.2. Rest of Europe Smart Router Market Revenue (US$ Mn) and
Forecasts, By End User
11.4.8.2.1. Home office User
11.4.8.2.2. Entertainment User
11.5. Key
Segment for Channeling Investments
11.5.1. By
Country
11.5.2. By
Product
11.5.3. By End
User
12.
Asia Pacific Smart Router
Market Analysis and Forecasts, 2019 - 2027
12.1. Overview
12.1.1. Asia
Pacific Smart Router Market Revenue (US$ Mn)
12.2. Asia
Pacific Smart Router Market Revenue (US$ Mn) and Forecasts, By Product
12.2.1. 300
Mbps and below
12.2.2. 300-1000
Mbps
12.2.3. Above
1000 Mbps
12.3. Asia
Pacific Smart Router Market Revenue (US$ Mn) and Forecasts, By End User
12.3.1. Home
office User
12.3.2. Entertainment
User
12.4. Asia
Pacific Smart Router Market Revenue (US$ Mn) and Forecasts, By Country
12.4.1. China
12.4.1.1. China Smart Router Market Revenue (US$ Mn) and Forecasts, By
Product
12.4.1.1.1. 300 Mbps and below
12.4.1.1.2. 300-1000 Mbps
12.4.1.1.3. Above 1000 Mbps
12.4.1.2. China Smart Router Market Revenue (US$ Mn) and Forecasts, By
End User
12.4.1.2.1. Home office User
12.4.1.2.2. Entertainment User
12.4.2. Japan
12.4.2.1. Japan Smart Router Market Revenue (US$ Mn) and Forecasts, By
Product
12.4.2.1.1. 300 Mbps and below
12.4.2.1.2. 300-1000 Mbps
12.4.2.1.3. Above 1000 Mbps
12.4.2.2. Japan Smart Router Market Revenue (US$ Mn) and Forecasts, By
End User
12.4.2.2.1. Home office User
12.4.2.2.2. Entertainment User
12.4.3. India
12.4.3.1. India Smart Router Market Revenue (US$ Mn) and Forecasts, By
Product
12.4.3.1.1. 300 Mbps and below
12.4.3.1.2. 300-1000 Mbps
12.4.3.1.3. Above 1000 Mbps
12.4.3.2. India Smart Router Market Revenue (US$ Mn) and Forecasts, By
End User
12.4.3.2.1. Home office User
12.4.3.2.2. Entertainment User
12.4.4. New
Zealand
12.4.4.1. New Zealand Smart Router Market Revenue (US$ Mn) and
Forecasts, By Product
12.4.4.1.1. 300 Mbps and below
12.4.4.1.2. 300-1000 Mbps
12.4.4.1.3. Above 1000 Mbps
12.4.4.2. New Zealand Smart Router Market Revenue (US$ Mn) and
Forecasts, By End User
12.4.4.2.1. Home office User
12.4.4.2.2. Entertainment User
12.4.5. Australia
12.4.5.1. Australia Smart Router Market Revenue (US$ Mn) and Forecasts,
By Product
12.4.5.1.1. 300 Mbps and below
12.4.5.1.2. 300-1000 Mbps
12.4.5.1.3. Above 1000 Mbps
12.4.5.2. Australia Smart Router Market Revenue (US$ Mn) and Forecasts,
By End User
12.4.5.2.1. Home office User
12.4.5.2.2. Entertainment User
12.4.6. South
Korea
12.4.6.1. South Korea Smart Router Market Revenue (US$ Mn) and
Forecasts, By Product
12.4.6.1.1. 300 Mbps and below
12.4.6.1.2. 300-1000 Mbps
12.4.6.1.3. Above 1000 Mbps
12.4.6.2. South Korea Smart Router Market Revenue (US$ Mn) and
Forecasts, By End User
12.4.6.2.1. Home office User
12.4.6.2.2. Entertainment User
12.4.7. Southeast
Asia
12.4.7.1. Southeast Asia Smart Router Market Revenue (US$ Mn) and
Forecasts, By Product
12.4.7.1.1. 300 Mbps and below
12.4.7.1.2. 300-1000 Mbps
12.4.7.1.3. Above 1000 Mbps
12.4.7.2. Southeast Asia Smart Router Market Revenue (US$ Mn) and
Forecasts, By End User
12.4.7.2.1. Home office User
12.4.7.2.2. Entertainment User
12.4.7.3. Southeast Asia Smart Router Market Revenue (US$ Mn) and
Forecasts, By Country
12.4.7.3.1. Indonesia
12.4.7.3.2. Thailand
12.4.7.3.3. Malaysia
12.4.7.3.4. Singapore
12.4.7.3.5. Rest of Southeast Asia
12.4.8. Rest of
Asia Pacific
12.4.8.1. Rest of Asia Pacific Smart Router Market Revenue (US$ Mn) and
Forecasts, By Product
12.4.8.1.1. 300 Mbps and below
12.4.8.1.2. 300-1000 Mbps
12.4.8.1.3. Above 1000 Mbps
12.4.8.2. Rest of Asia Pacific Smart Router Market Revenue (US$ Mn) and
Forecasts, By End User
12.4.8.2.1. Home office User
12.4.8.2.2. Entertainment User
12.5. Key
Segment for Channeling Investments
12.5.1. By
Country
12.5.2. By
Product
12.5.3. By End
User
13.
Middle East and Africa Smart
Router Market Analysis and Forecasts, 2019 - 2027
13.1. Overview
13.1.1. Middle
East and Africa Smart Router Market Revenue (US$ Mn)
13.2. Middle
East and Africa Smart Router Market Revenue (US$ Mn) and Forecasts, By Product
13.2.1. 300
Mbps and below
13.2.2. 300-1000
Mbps
13.2.3. Above
1000 Mbps
13.3. Middle
East and Africa Smart Router Market Revenue (US$ Mn) and Forecasts, By End User
13.3.1. Home
office User
13.3.2. Entertainment
User
13.4. Middle
East and Africa Smart Router Market Revenue (US$ Mn) and Forecasts, By Country
13.4.1. Saudi
Arabia
13.4.1.1. Saudi Arabia Smart Router Market Revenue (US$ Mn) and
Forecasts, By Product
13.4.1.1.1. 300 Mbps and below
13.4.1.1.2. 300-1000 Mbps
13.4.1.1.3. Above 1000 Mbps
13.4.1.2. Saudi Arabia Smart Router Market Revenue (US$ Mn) and
Forecasts, By End User
13.4.1.2.1. Home office User
13.4.1.2.2. Entertainment User
13.4.2. UAE
13.4.2.1. UAE Smart Router Market Revenue (US$ Mn) and Forecasts, By
Product
13.4.2.1.1. 300 Mbps and below
13.4.2.1.2. 300-1000 Mbps
13.4.2.1.3. Above 1000 Mbps
13.4.2.2. UAE Smart Router Market Revenue (US$ Mn) and Forecasts, By End
User
13.4.2.2.1. Home office User
13.4.2.2.2. Entertainment User
13.4.3. Egypt
13.4.3.1. Egypt Smart Router Market Revenue (US$ Mn) and Forecasts, By
Product
13.4.3.1.1. 300 Mbps and below
13.4.3.1.2. 300-1000 Mbps
13.4.3.1.3. Above 1000 Mbps
13.4.3.2. Egypt Smart Router Market Revenue (US$ Mn) and Forecasts, By
End User
13.4.3.2.1. Home office User
13.4.3.2.2. Entertainment User
13.4.4. Kuwait
13.4.4.1. Kuwait Smart Router Market Revenue (US$ Mn) and Forecasts, By
Product
13.4.4.1.1. 300 Mbps and below
13.4.4.1.2. 300-1000 Mbps
13.4.4.1.3. Above 1000 Mbps
13.4.4.2. Kuwait Smart Router Market Revenue (US$ Mn) and Forecasts, By
End User
13.4.4.2.1. Home office User
13.4.4.2.2. Entertainment User
13.4.5. South
Africa
13.4.5.1. South Africa Smart Router Market Revenue (US$ Mn) and
Forecasts, By Product
13.4.5.1.1. 300 Mbps and below
13.4.5.1.2. 300-1000 Mbps
13.4.5.1.3. Above 1000 Mbps
13.4.5.2. South Africa Smart Router Market Revenue (US$ Mn) and
Forecasts, By End User
13.4.5.2.1. Home office User
13.4.5.2.2. Entertainment User
13.4.6. Rest of
Middle East & Africa
13.4.6.1. Rest of Middle East & Africa Smart Router Market Revenue
(US$ Mn) and Forecasts, By Product
13.4.6.1.1. 300 Mbps and below
13.4.6.1.2. 300-1000 Mbps
13.4.6.1.3. Above 1000 Mbps
13.4.6.2. Rest of Middle East & Africa Smart Router Market Revenue
(US$ Mn) and Forecasts, By End User
13.4.6.2.1. Home office User
13.4.6.2.2. Entertainment User
13.5. Key
Segment for Channeling Investments
13.5.1. By
Country
13.5.2. By Product
13.5.3. By End
User
14.
Latin America Smart Router
Market Analysis and Forecasts, 2019 - 2027
14.1. Overview
14.1.1. Latin
America Smart Router Market Revenue (US$ Mn)
14.2. Latin
America Smart Router Market Revenue (US$ Mn) and Forecasts, By Product
14.2.1. 300
Mbps and below
14.2.2. 300-1000
Mbps
14.2.3. Above
1000 Mbps
14.3. Latin
America Smart Router Market Revenue (US$ Mn) and Forecasts, By End User
14.3.1. Home
office User
14.3.2. Entertainment
User
14.4. Latin
America Smart Router Market Revenue (US$ Mn) and Forecasts, By Country
14.4.1. Brazil
14.4.1.1. Brazil Smart Router Market Revenue (US$ Mn) and Forecasts, By
Product
14.4.1.1.1. 300 Mbps and below
14.4.1.1.2. 300-1000 Mbps
14.4.1.1.3. Above 1000 Mbps
14.4.1.2. Brazil Smart Router Market Revenue (US$ Mn) and Forecasts, By
End User
14.4.1.2.1. Home office User
14.4.1.2.2. Entertainment User
14.4.2. Argentina
14.4.2.1. Argentina Smart Router Market Revenue (US$ Mn) and Forecasts,
By Product
14.4.2.1.1. 300 Mbps and below
14.4.2.1.2. 300-1000 Mbps
14.4.2.1.3. Above 1000 Mbps
14.4.2.2. Argentina Smart Router Market Revenue (US$ Mn) and Forecasts,
By End User
14.4.2.2.1. Home office User
14.4.2.2.2. Entertainment User
14.4.3. Rest of
Latin America
14.4.3.1. Rest of Latin America Smart Router Market Revenue (US$ Mn) and
Forecasts, By Product
14.4.3.1.1. 300 Mbps and below
14.4.3.1.2. 300-1000 Mbps
14.4.3.1.3. Above 1000 Mbps
14.4.3.2. Rest of Latin America Smart Router Market Revenue (US$ Mn) and
Forecasts, By End User
14.4.3.2.1. Home office User
14.4.3.2.2. Entertainment User
14.5. Key
Segment for Channeling Investments
14.5.1. By
Country
14.5.2. By Product
14.5.3. By End
User
15.
Competitive Benchmarking
15.1. Market
Share Analysis, 2018
15.2. Global
Presence and Growth Strategies
15.2.1. Mergers
and Acquisitions
15.2.2. Product
Launches
15.2.3. Investments
Trends
15.2.4. R&D
Initiatives
16.
Player Profiles
16.1. ADTRAN,
Inc.
16.1.1. Company
Details
16.1.2. Company
Overview
16.1.3. Product
Offerings
16.1.4. Key
Developments
16.1.5. Financial
Analysis
16.1.6. SWOT
Analysis
16.1.7. Business
Strategies
16.2. Allied
Telesis Holdings K.K.
16.2.1. Company
Details
16.2.2. Company
Overview
16.2.3. Product
Offerings
16.2.4. Key
Developments
16.2.5. Financial
Analysis
16.2.6. SWOT
Analysis
16.2.7. Business
Strategies
16.3. AsusTek
Computer Inc.
16.3.1. Company
Details
16.3.2. Company
Overview
16.3.3. Product
Offerings
16.3.4. Key
Developments
16.3.5. Financial
Analysis
16.3.6. SWOT
Analysis
16.3.7. Business
Strategies
16.4. Cisco
Systems, Inc.
16.4.1. Company
Details
16.4.2. Company
Overview
16.4.3. Product
Offerings
16.4.4. Key
Developments
16.4.5. Financial
Analysis
16.4.6. SWOT
Analysis
16.4.7. Business
Strategies
16.5. D-Link
Corporation
16.5.1. Company
Details
16.5.2. Company
Overview
16.5.3. Product
Offerings
16.5.4. Key
Developments
16.5.5. Financial
Analysis
16.5.6. SWOT
Analysis
16.5.7. Business
Strategies
16.6. Edimax
Technology Co., Ltd.
16.6.1. Company
Details
16.6.2. Company
Overview
16.6.3. Product
Offerings
16.6.4. Key
Developments
16.6.5. Financial
Analysis
16.6.6. SWOT
Analysis
16.6.7. Business
Strategies
16.7. Enterasys
Networks, Inc.
16.7.1. Company
Details
16.7.2. Company
Overview
16.7.3. Product
Offerings
16.7.4. Key
Developments
16.7.5. Financial
Analysis
16.7.6. SWOT
Analysis
16.7.7. Business
Strategies
16.8. Hewlett-Packard
16.8.1. Company
Details
16.8.2. Company
Overview
16.8.3. Product
Offerings
16.8.4. Key
Developments
16.8.5. Financial
Analysis
16.8.6. SWOT
Analysis
16.8.7. Business
Strategies
16.9. Huawei
Technologies Co. Ltd.
16.9.1. Company
Details
16.9.2. Company
Overview
16.9.3. Product
Offerings
16.9.4. Key
Developments
16.9.5. Financial
Analysis
16.9.6. SWOT
Analysis
16.9.7. Business
Strategies
16.10. Netgear
Inc.
16.10.1. Company
Details
16.10.2. Company
Overview
16.10.3. Product
Offerings
16.10.4. Key
Developments
16.10.5. Financial
Analysis
16.10.6. SWOT
Analysis
16.10.7. Business
Strategies
16.11. TP-Link
16.11.1. Company
Details
16.11.2. Company
Overview
16.11.3. Product
Offerings
16.11.4. Key
Developments
16.11.5. Financial
Analysis
16.11.6. SWOT
Analysis
16.11.7. Business
Strategies
16.12. Verizon
16.12.1. Company
Details
16.12.2. Company
Overview
16.12.3. Product
Offerings
16.12.4. Key
Developments
16.12.5. Financial
Analysis
16.12.6. SWOT
Analysis
16.12.7. Business
Strategies
16.13. Xiaomi
Corporation
16.13.1. Company
Details
16.13.2. Company
Overview
16.13.3. Product
Offerings
16.13.4. Key
Developments
16.13.5. Financial
Analysis
16.13.6. SWOT
Analysis
16.13.7. Business
Strategies
16.14. Other
Market Participants
17.
Key Findings
Note: This ToC is tentative
and can be changed according to the research study conducted during the course
of report completion.
**Exclusive for Multi-User and
Enterprise User.
At Absolute Markets Insights, we are engaged in building both global as well as country specific reports. As a result, the approach taken for deriving the estimation and forecast for a specific country is a bit unique and different in comparison to the global research studies. In this case, we not only study the concerned market factors & trends prevailing in a particular country (from secondary research) but we also tend to calculate the actual market size & forecast from the revenue generated from the market participants involved in manufacturing or distributing the any concerned product. These companies can also be service providers. For analyzing any country specifically, we do consider the growth factors prevailing under the states/cities/county for the same. For instance, if we are analyzing an industry specific to United States, we primarily need to study about the states present under the same(where the product/service has the highest growth). Similar analysis will be followed by other countries. Our scope of the report changes with different markets.
Our research study is mainly implement through a mix of both secondary and primary research. Various sources such as industry magazines, trade journals, and government websites and trade associations are reviewed for gathering precise data. Primary interviews are conducted to validate the market size derived from secondary research. Industry experts, major manufacturers and distributors are contacted for further validation purpose on the current market penetration and growth trends.
Prominent participants in our primary research process include:
- Key Opinion Leaders namely the CEOs, CSOs, VPs, purchasing managers, amongst others
- Research and development participants, distributors/suppliers and subject matter experts
Secondary Research includes data extracted from paid data sources:
- Reuters
- Factiva
- Bloomberg
- One Source
- Hoovers
Research Methodology

Key Inclusions


