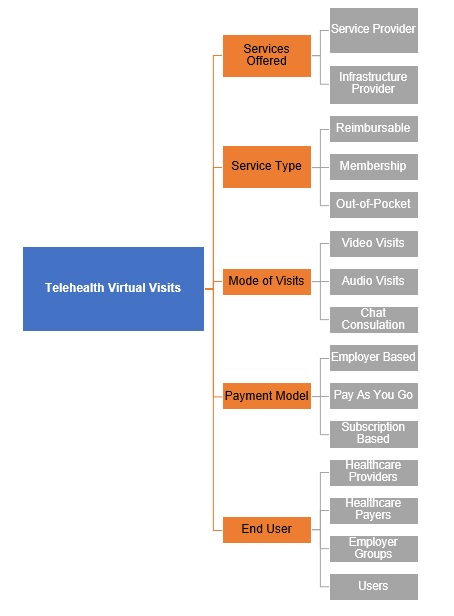
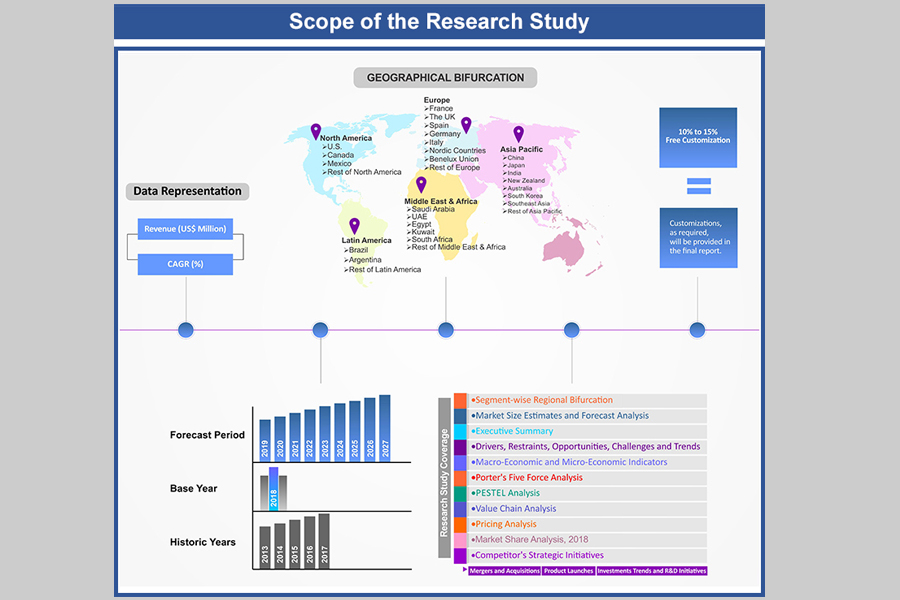
Telehealth Virtual Visits Market by Services Offered (Service provider, Infrastructure provider); by Service Type (Reimbursable, Membership, Out of Pocket); by Mode of Visits (Video Visits, Audio Visits, Chat Consultation); by Payment Model (Subscription based Model, Pay-as-you-go Model, Employer based Model); by End User (Healthcare Providers, Healthcare Payers, Employer Groups, Others); by Regional Outlook (U.S., Rest of North America, France, UK, Germany, Spain, Italy, Rest of Europe, China, Japan, India, Southeast Asia, Rest of Asia Pacific, GCC Countries, Southern Africa, Rest of MEA, Brazil, Rest of Latin America) – Global Insights, Growth, Size, Comparative Analysis, Trends and Forecast, 2018 - 2026
Industry Trends
Telehealth virtual visits are an emerging service offered by healthcare organizations that utilizes audiovisual technologies. It is used for non-emergency situations where physically visiting the medical facility is not obligatory for the patient. Virtual visits significantly save time and travel expenses for the patient. From the healthcare provider’s perspective, space requirement is reduced as well as time is saved. It enables the providers to examine and provide consultation to patients across long distances via mediums such as video chat, telephone, e-mail or others. It also avoids spreading of infections that occur in waiting rooms at the healthcare providers.
Chronic illnesses and disabilities associated with the growing geriatric population primarily in the emerged economies are major drivers for the telehealth virtual visits industry. These complications demand continuous medical consultation. To avoid frequent commute to the healthcare provider, virtual visits offer a fitting alternative. Increasing usage of smartphones and PCs is aiding virtual visits too. Telehealth virtual visits might be greatly benefitted with the cover of health plans. Plans can incent and educate both patients and providers to use telemedicine virtual visits. However, incapability in providing accurate diagnostics every time is restraining the growth of the market. Telehealth can replace consultation visits but cannot completely fulfill the requirement of physical examination.
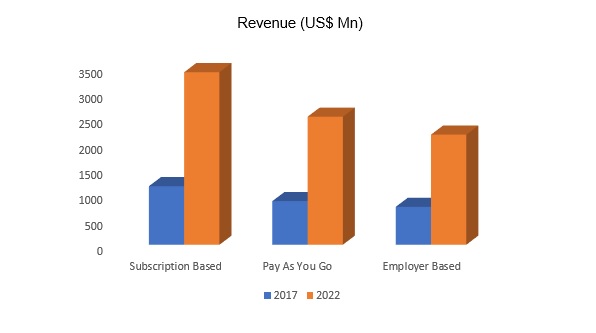
Global Telehealth Virtual Visits Market, By Payment Model, 2017 & 2022 (USD Million)
Telehealth Virtual Visits Market, by Mode of Visits
Among the modes of visits, audio visits generated revenue of US$ 986.41 Mn in 2017 globally and expected to grow as they are the most convenient way of getting consultation without travelling to the provider. They are relatively convenient in terms of technology and gadget- requirement too. Audio visits only require telephone connection or cell signal and there is no requirement of internet and video devices. Even in the less technologically advanced regions of the world, audio visits are possible. It is also easier for the geriatric population to use a phone as compared to video devices.
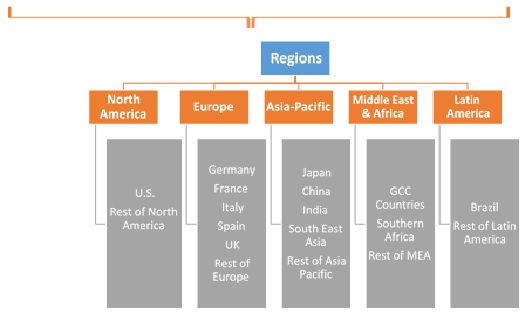
Telehealth Virtual Visits Market, by Region
In terms of revenue, North America telehealth virtual visits market stood at US$ 786.89 Mn in 2017 which is highest among all the regions considered in the report and is expected to expand at a CAGR of 25.8% from 2017 - 2025. The rising crisis of healthcare access, lack of space and available time are some of the factors driving the market. Since North America acts as catalyst for major technological advancements with substantial opportunities in California and New York, the application and consumption of newer technologies is higher in the region. The availability of trained work force and other necessary resources is also driving the growth. Canada is also flourishing as a technological center with growing opportunities and developments in cloud, IT security and software.
Competitive Market Share
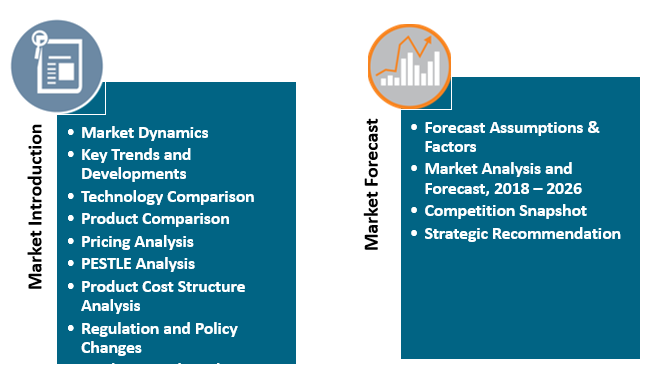
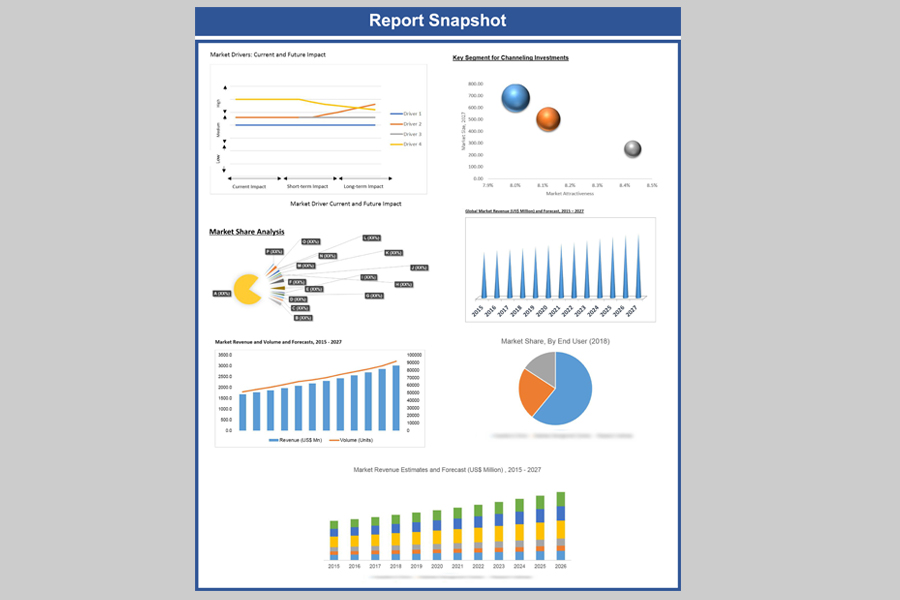
The telehealth virtual visits market report provides both, qualitative and quantitative research of the market, as well as it helps to gain important insights of current and future market and trending technologies adopted by the key players. The report also offers extensive research on the key players in this market and detailed insights on the competitiveness of these players. The key business strategies such as mergers and acquisitions(M&A), affiliations, collaborations, and contracts adopted by the major players are also recognized and analyzed in the report. For each company, the report recognizes their manufacturing base, competitors, product type, application and specification, pricing, and gross margin.
Key participants of global telehealth virtual visits market are American Well Corporation, Carena Inc., Cisco Systems, Inc., Doctor on Demand Inc., eVisit Telemedicine Solution, HealthTap, InteractiveMD LLC, Medtronic, MeMD, Koninklijke Philips N.V., PlushCare, Inc., Practice Fusion Inc., Siemens Healthineers, Teladoc Inc., Vidyo, Inc. and Zipnosis amongst others.
Telehealth Virtual Visits Industry Background
1. Introduction
1.1. Market Scope
1.2. Market Segmentation
1.3. Methodology
1.4. Assumptions
2. Telehealth Virtual Visits Market Snapshot
3. Executive Summary: Telehealth Virtual Visits Market
4. Qualitative Analysis: Telehealth Virtual Visits Market
4.1. Introduction
4.1.1. Product Definition
4.1.2. Industry Development
4.2. Market Dynamics
4.2.1. Drivers
4.2.2. Restraints
4.2.3. Opportunities
4.3. Trends in Market
5. Global Telehealth Virtual Visits Market Analysis and
Forecasts, 2018 – 2026
5.1. Overview
5.1.1. Global Market Revenue (US$ Mn) and Forecasts
5.2. Global Telehealth Virtual Visits Market Revenue (US$ Mn) and
Forecasts, By Services Offered
5.2.1. Service Provider
5.2.1.1. Definition
5.2.1.2. Market Penetration
5.2.1.3. Market Revenue Expected to Increase by 2026
5.2.1.4. Compound Annual Growth Rate (CAGR)
5.2.2. Infrastructure provider
5.2.2.1. Definition
5.2.2.2. Market Penetration
5.2.2.3. Market Revenue Expected to Increase by 2026
5.2.2.4. Compound Annual Growth Rate (CAGR)
5.3. Key Segment for Channeling Investments
5.3.1. By Services Offered
6. Global Telehealth Virtual Visits Market Analysis and
Forecasts, 2018 – 2026
6.1. Overview
6.2. Global Telehealth Virtual Visits Market Revenue (US$ Mn) and
Forecasts, By Service Type
6.2.1. Reimbursable
6.2.1.1. Definition
6.2.1.2. Market Penetration
6.2.1.3. Market Revenue Expected to Increase by 2026
6.2.1.4. Compound Annual Growth Rate (CAGR)
6.2.2. Membership
6.2.2.1. Definition
6.2.2.2. Market Penetration
6.2.2.3. Market Revenue Expected to Increase by 2026
6.2.2.4. Compound Annual Growth Rate (CAGR)
6.2.3. Out-of-Pocket
6.2.3.1. Definition
6.2.3.2. Market Penetration
6.2.3.3. Market Revenue Expected to Increase by 2026
6.2.3.4. Compound Annual Growth Rate (CAGR)
6.3. Key Segment for Channeling Investments
6.3.1. By Service Type
7. Global Telehealth Virtual Visits Market Analysis and
Forecasts, 2018 – 2026
7.1. Overview
7.2. Global Telehealth Virtual Visits Market Revenue (US$ Mn) and
Forecasts, By Mode of visits
7.2.1. Video visits
7.2.1.1. Definition
7.2.1.2. Market Penetration
7.2.1.3. Market Revenue Expected to Increase by 2026
7.2.1.4. Compound Annual Growth Rate (CAGR)
7.2.2. Audio visits
7.2.2.1. Definition
7.2.2.2. Market Penetration
7.2.2.3. Market Revenue Expected to Increase by 2026
7.2.2.4. Compound Annual Growth Rate (CAGR)
7.2.3. Chat consultation
7.2.3.1. Definition
7.2.3.2. Market Penetration
7.2.3.3. Market Revenue Expected to Increase by 2026
7.2.3.4. Compound Annual Growth Rate (CAGR)
7.3. Key Segment for Channeling Investments
7.3.1. By Mode of visits
8. Global Telehealth Virtual Visits Market Analysis and
Forecasts, 2018 – 2026
8.1. Overview
8.2. Global Telehealth Virtual Visits Market Revenue (US$ Mn) and
Forecasts, By Payment model
8.2.1. Subscription based model
8.2.1.1. Definition
8.2.1.2. Market Penetration
8.2.1.3. Market Revenue Expected to Increase by 2026
8.2.1.4. Compound Annual Growth Rate (CAGR)
8.2.2. Pay as you go model
8.2.2.1. Definition
8.2.2.2. Market Penetration
8.2.2.3. Market Revenue Expected to Increase by 2026
8.2.2.4. Compound Annual Growth Rate (CAGR)
8.2.3. Employer based model
8.2.3.1. Definition
8.2.3.2. Market Penetration
8.2.3.3. Market Revenue Expected to Increase by 2026
8.2.3.4. Compound Annual Growth Rate (CAGR)
8.3. Key Segment for Channeling Investments
8.3.1. By Payment model
9. Global Telehealth Virtual Visits Market Analysis and Forecasts,
2018 – 2026
9.1. Overview
9.2. Global Telehealth Virtual Visits Market Revenue (US$ Mn) and
Forecasts, By End-user
9.2.1. Healthcare providers
9.2.1.1. Definition
9.2.1.2. Market Penetration
9.2.1.3. Market Revenue Expected to Increase by 2026
9.2.1.4. Compound Annual Growth Rate (CAGR)
9.2.2. Healthcare payers
9.2.2.1. Definition
9.2.2.2. Market Penetration
9.2.2.3. Market Revenue Expected to Increase by 2026
9.2.2.4. Compound Annual Growth Rate (CAGR)
9.2.3. Employer Groups
9.2.3.1. Definition
9.2.3.2. Market Penetration
9.2.3.3. Market Revenue Expected to Increase by 2026
9.2.3.4. Compound Annual Growth Rate (CAGR)
9.2.4. Users
9.2.4.1. Definition
9.2.4.2. Market Penetration
9.2.4.3. Market Revenue Expected to Increase by 2026
9.2.4.4. Compound Annual Growth Rate (CAGR)
9.3. Key Segment for Channeling Investments
9.3.1. By End-user
10. North America Telehealth Virtual Visits Market Analysis and
Forecasts, 2018 – 2026
10.1. Overview
10.1.1. North America Market Revenue (US$ Mn)
10.2. North America Market Revenue (US$ Mn) and Forecasts, By
Services Offered
10.2.1. Service Provider
10.2.2. Infrastructure provider
10.3. North America Telehealth Virtual Visits Market Revenue (US$
Mn) and Forecasts, By Service Type
10.3.1. Reimbursable
10.3.2. Membership
10.3.3. Out-of-Pocket
10.4. North America Market Revenue (US$ Mn) and Forecasts, By Mode
of visits
10.4.1. Video visits
10.4.2. Audio visits
10.4.3. Chat consultation
10.5. North America Telehealth Virtual Visits Market Revenue (US$
Mn) and Forecasts, By Payment model
10.5.1. Subscription based model
10.5.2. Pay as you go model
10.5.3. Employer based model
10.6. North America Market Revenue (US$ Mn) and Forecasts, By
End-user
10.6.1. Healthcare providers
10.6.2. Healthcare payers
10.6.3. Employer Groups
10.6.4. Users
10.7. North America Telehealth Virtual Visits Market Revenue (US$
Mn) and Forecasts, By Country
10.7.1. U.S.
10.7.1.1. U.S. Telehealth Virtual Visits Market Revenue (US$ Mn) and
Forecasts, By Services Offered
10.7.1.1.1. Service Provider
10.7.1.1.2. Infrastructure provider
10.7.1.2. U.S. Market Revenue (US$ Mn) and Forecasts, By Service Type
10.7.1.2.1. Reimbursable
10.7.1.2.2. Membership
10.7.1.2.3. Out-of-Pocket
10.7.1.3. U.S. Telehealth Virtual Visits Market Revenue (US$ Mn) and
Forecasts, By Mode of visits
10.7.1.3.1. Video visits
10.7.1.3.2. Audio visits
10.7.1.3.3. Chat consultation
10.7.1.4. U.S. Market Revenue (US$ Mn) and Forecasts, By Payment model
10.7.1.4.1. Subscription based model
10.7.1.4.2. Pay as you go model
10.7.1.4.3. Employer based model
10.7.1.5. U.S. Telehealth Virtual Visits Market Revenue (US$ Mn) and
Forecasts, By End-user
10.7.1.5.1. Healthcare providers
10.7.1.5.2. Healthcare payers
10.7.1.5.3. Employer Groups
10.7.1.5.4. Users
10.7.2. Rest of North America
10.7.2.1. Rest of North America Telehealth Virtual Visits Market Revenue
(US$ Mn) and Forecasts, By Services Offered
10.7.2.1.1. Service Provider
10.7.2.1.2. Infrastructure provider
10.7.2.2. Rest of North America Market Revenue (US$ Mn) and Forecasts,
By Service Type
10.7.2.2.1. Reimbursable
10.7.2.2.2. Membership
10.7.2.2.3. Out-of-Pocket
10.7.2.3. Rest of North America Telehealth Virtual Visits Market Revenue
(US$ Mn) and Forecasts, By Mode of visits
10.7.2.3.1. Video visits
10.7.2.3.2. Audio visits
10.7.2.3.3. Chat consultation
10.7.2.4. Rest of North America Market Revenue (US$ Mn) and Forecasts,
By Payment model
10.7.2.4.1. Subscription based model
10.7.2.4.2. Pay as you go model
10.7.2.4.3. Employer based model
10.7.2.5. Rest of North America Telehealth Virtual Visits Market Revenue
(US$ Mn) and Forecasts, By End-user
10.7.2.5.1. Healthcare providers
10.7.2.5.2. Healthcare payers
10.7.2.5.3. Employer Groups
10.7.2.5.4. Users
10.8. Key Segment for Channeling Investments
10.8.1. By Country
10.8.2. By Services Offered
10.8.3. By Service Type
10.8.4. By Mode of visits
10.8.5. By Payment model
10.8.6. By End-user
11. Europe Telehealth Virtual Visits Market Analysis and
Forecasts, 2018 – 2026
11.1. Overview
11.1.1. Europe Market Revenue (US$ Mn)
11.2. Europe Telehealth Virtual Visits Market Revenue (US$ Mn) and
Forecasts, By Services Offered
11.2.1. Service Provider
11.2.2. Infrastructure provider
11.3. Europe Market Revenue (US$ Mn) and Forecasts, By Service Type
11.3.1. Reimbursable
11.3.2. Membership
11.3.3. Out-of-Pocket
11.4. Europe Telehealth Virtual Visits Market Revenue (US$ Mn) and
Forecasts, By Mode of visits
11.4.1. Video visits
11.4.2. Audio visits
11.4.3. Chat consultation
11.5. Europe Market Revenue (US$ Mn) and Forecasts, By Payment model
11.5.1. Subscription based model
11.5.2. Pay as you go model
11.5.3. Employer based model
11.6. Europe Telehealth Virtual Visits Market Revenue (US$ Mn) and
Forecasts, By End-user
11.6.1. Healthcare providers
11.6.2. Healthcare payers
11.6.3. Employer Groups
11.6.4. Users
11.7. Europe Telehealth Virtual Visits Market Revenue (US$ Mn) and
Forecasts, By Country
11.7.1. France
11.7.1.1. France Telehealth Virtual Visits Market Revenue (US$ Mn) and
Forecasts, By Services Offered
11.7.1.1.1. Service Provider
11.7.1.1.2. Infrastructure provider
11.7.1.2. France Market Revenue (US$ Mn) and Forecasts, By Service Type
11.7.1.2.1. Reimbursable
11.7.1.2.2. Membership
11.7.1.2.3. Out-of-Pocket
11.7.1.3. France Telehealth Virtual Visits Market Revenue (US$ Mn) and
Forecasts, By Mode of visits
11.7.1.3.1. Video visits
11.7.1.3.2. Audio visits
11.7.1.3.3. Chat consultation
11.7.1.4. France Market Revenue (US$ Mn) and Forecasts, By Payment model
11.7.1.4.1. Subscription based model
11.7.1.4.2. Pay as you go model
11.7.1.4.3. Employer based model
11.7.1.5. France Telehealth Virtual Visits Market Revenue (US$ Mn) and
Forecasts, By End-user
11.7.1.5.1. Healthcare providers
11.7.1.5.2. Healthcare payers
11.7.1.5.3. Employer Groups
11.7.1.5.4. Users
11.7.2. The UK
11.7.2.1. The UK Telehealth Virtual Visits Market Revenue (US$ Mn) and
Forecasts, By Services Offered
11.7.2.1.1. Service Provider
11.7.2.1.2. Infrastructure provider
11.7.2.2. The UK Market Revenue (US$ Mn) and Forecasts, By Service Type
11.7.2.2.1. Reimbursable
11.7.2.2.2. Membership
11.7.2.2.3. Out-of-Pocket
11.7.2.3. The UK Telehealth Virtual Visits Market Revenue (US$ Mn) and
Forecasts, By Mode of visits
11.7.2.3.1. Video visits
11.7.2.3.2. Audio visits
11.7.2.3.3. Chat consultation
11.7.2.4. The UK Market Revenue (US$ Mn) and Forecasts, By Payment model
11.7.2.4.1. Subscription based model
11.7.2.4.2. Pay as you go model
11.7.2.4.3. Employer based model
11.7.2.5. The UK Telehealth Virtual Visits Market Revenue (US$ Mn) and
Forecasts, By End-user
11.7.2.5.1. Healthcare providers
11.7.2.5.2. Healthcare payers
11.7.2.5.3. Employer Groups
11.7.2.5.4. Users
11.7.3. Spain
11.7.3.1. Spain Telehealth Virtual Visits Market Revenue (US$ Mn) and
Forecasts, By Services Offered
11.7.3.1.1. Service Provider
11.7.3.1.2. Infrastructure provider
11.7.3.2. Spain Market Revenue (US$ Mn) and Forecasts, By Service Type
11.7.3.2.1. Reimbursable
11.7.3.2.2. Membership
11.7.3.2.3. Out-of-Pocket
11.7.3.3. Spain Telehealth Virtual Visits Market Revenue (US$ Mn) and
Forecasts, By Mode of visits
11.7.3.3.1. Video visits
11.7.3.3.2. Audio visits
11.7.3.3.3. Chat consultation
11.7.3.4. Spain Market Revenue (US$ Mn) and Forecasts, By Payment model
11.7.3.4.1. Subscription based model
11.7.3.4.2. Pay as you go model
11.7.3.4.3. Employer based model
11.7.3.5. Spain Telehealth Virtual Visits Market Revenue (US$ Mn) and
Forecasts, By End-user
11.7.3.5.1. Healthcare providers
11.7.3.5.2. Healthcare payers
11.7.3.5.3. Employer Groups
11.7.3.5.4. Users
11.7.4. Germany
11.7.4.1. Germany Telehealth Virtual Visits Market Revenue (US$ Mn) and
Forecasts, By Services Offered
11.7.4.1.1. Service Provider
11.7.4.1.2. Infrastructure provider
11.7.4.2. Germany Market Revenue (US$ Mn) and Forecasts, By Service Type
11.7.4.2.1. Reimbursable
11.7.4.2.2. Membership
11.7.4.2.3. Out-of-Pocket
11.7.4.3. Germany Telehealth Virtual Visits Market Revenue (US$ Mn) and
Forecasts, By Mode of visits
11.7.4.3.1. Video visits
11.7.4.3.2. Audio visits
11.7.4.3.3. Chat consultation
11.7.4.4. Germany Market Revenue (US$ Mn) and Forecasts, By Payment
model
11.7.4.4.1. Subscription based model
11.7.4.4.2. Pay as you go model
11.7.4.4.3. Employer based model
11.7.4.5. Germany Telehealth Virtual Visits Market Revenue (US$ Mn) and
Forecasts, By End-user
11.7.4.5.1. Healthcare providers
11.7.4.5.2. Healthcare payers
11.7.4.5.3. Employer Groups
11.7.4.5.4. Users
11.7.5. Italy
11.7.5.1. Italy Telehealth Virtual Visits Market Revenue (US$ Mn) and
Forecasts, By Services Offered
11.7.5.1.1. Service Provider
11.7.5.1.2. Infrastructure provider
11.7.5.2. Italy Market Revenue (US$ Mn) and Forecasts, By Service Type
11.7.5.2.1. Reimbursable
11.7.5.2.2. Membership
11.7.5.2.3. Out-of-Pocket
11.7.5.3. Italy Telehealth Virtual Visits Market Revenue (US$ Mn) and
Forecasts, By Mode of visits
11.7.5.3.1. Video visits
11.7.5.3.2. Audio visits
11.7.5.3.3. Chat consultation
11.7.5.4. Italy Telehealth Virtual Visits Market Revenue (US$ Mn) and
Forecasts, By Payment model
11.7.5.4.1. Subscription based model
11.7.5.4.2. Pay as you go model
11.7.5.4.3. Employer based model
11.7.5.5. Italy Market Revenue (US$ Mn) and Forecasts, By End-user
11.7.5.5.1. Healthcare providers
11.7.5.5.2. Healthcare payers
11.7.5.5.3. Employer Groups
11.7.5.5.4. Users
11.7.6. Rest of Europe
11.7.6.1. Rest of Europe Telehealth Virtual Visits Market Revenue (US$
Mn) and Forecasts, By Services Offered
11.7.6.1.1. Service Provider
11.7.6.1.2. Infrastructure provider
11.7.6.2. Rest of Europe Market Revenue (US$ Mn) and Forecasts, By
Service Type
11.7.6.2.1. Reimbursable
11.7.6.2.2. Membership
11.7.6.2.3. Out-of-Pocket
11.7.6.3. Rest of Europe Telehealth Virtual Visits Market Revenue (US$
Mn) and Forecasts, By Mode of visits
11.7.6.3.1. Video visits
11.7.6.3.2. Audio visits
11.7.6.3.3. Chat consultation
11.7.6.4. Rest of Europe Market Revenue (US$ Mn) and Forecasts, By
Payment model
11.7.6.4.1. Subscription based model
11.7.6.4.2. Pay as you go model
11.7.6.4.3. Employer based model
11.7.6.5. Rest of Europe Telehealth Virtual Visits Market Revenue (US$
Mn) and Forecasts, By End-user
11.7.6.5.1. Healthcare providers
11.7.6.5.2. Healthcare payers
11.7.6.5.3. Employer Groups
11.7.6.5.4. Users
11.8. Key Segment for Channeling Investments
11.8.1. By Country
11.8.2. By Services Offered
11.8.3. By Service Type
11.8.4. By Mode of visits
11.8.5. By Payment model
11.8.6. By End-user
12. Asia Pacific Telehealth Virtual Visits Market Analysis and
Forecasts, 2018 – 2026
12.1. Overview
12.1.1. Asia Pacific Market Revenue (US$ Mn)
12.2. Asia Pacific Market Revenue (US$ Mn) and Forecasts, By
Services Offered
12.2.1. Service Provider
12.2.2. Infrastructure provider
12.3. Asia Pacific Telehealth Virtual Visits Market Revenue (US$ Mn)
and Forecasts, By Service Type
12.3.1. Reimbursable
12.3.2. Membership
12.3.3. Out-of-Pocket
12.4. Asia Pacific Market Revenue (US$ Mn) and Forecasts, By Mode of
visits
12.4.1. Video visits
12.4.2. Audio visits
12.4.3. Chat consultation
12.5. Asia Pacific Telehealth Virtual Visits Market Revenue (US$ Mn)
and Forecasts, By Payment model
12.5.1. Subscription based model
12.5.2. Pay as you go model
12.5.3. Employer based model
12.6. Asia Pacific Market Revenue (US$ Mn) and Forecasts, By
End-user
12.6.1. Healthcare providers
12.6.2. Healthcare payers
12.6.3. Employer Groups
12.6.4. Users
12.7. Asia Pacific Telehealth Virtual Visits Market Revenue (US$ Mn)
and Forecasts, By Country
12.7.1. China
12.7.1.1. China Telehealth Virtual Visits Market Revenue (US$ Mn) and
Forecasts, By Services Offered
12.7.1.1.1. Service Provider
12.7.1.1.2. Infrastructure provider
12.7.1.2. China Telehealth Virtual Visits Market Revenue (US$ Mn) and
Forecasts, By Service Type
12.7.1.2.1. Reimbursable
12.7.1.2.2. Membership
12.7.1.2.3. Out-of-Pocket
12.7.1.3. China Market Revenue (US$ Mn) and Forecasts, By Mode of visits
12.7.1.3.1. Video visits
12.7.1.3.2. Audio visits
12.7.1.3.3. Chat consultation
12.7.1.4. China Telehealth Virtual Visits Market Revenue (US$ Mn) and
Forecasts, By Payment model
12.7.1.4.1. Subscription based model
12.7.1.4.2. Pay as you go model
12.7.1.4.3. Employer based model
12.7.1.5. China Market Revenue (US$ Mn) and Forecasts, By End-user
12.7.1.5.1. Healthcare providers
12.7.1.5.2. Healthcare payers
12.7.1.5.3. Employer Groups
12.7.1.5.4. Users
12.7.2. Japan
12.7.2.1. Japan Telehealth Virtual Visits Market Revenue (US$ Mn) and
Forecasts, By Services Offered
12.7.2.1.1. Service Provider
12.7.2.1.2. Infrastructure provider
12.7.2.2. Japan Market Revenue (US$ Mn) and Forecasts, By Service Type
12.7.2.2.1. Reimbursable
12.7.2.2.2. Membership
12.7.2.2.3. Out-of-Pocket
12.7.2.3. Japan Telehealth Virtual Visits Market Revenue (US$ Mn) and
Forecasts, By Mode of visits
12.7.2.3.1. Video visits
12.7.2.3.2. Audio visits
12.7.2.3.3. Chat consultation
12.7.2.4. Japan Market Revenue (US$ Mn) and Forecasts, By Payment model
12.7.2.4.1. Subscription based model
12.7.2.4.2. Pay as you go model
12.7.2.4.3. Employer based model
12.7.2.5. Japan Telehealth Virtual Visits Market Revenue (US$ Mn) and
Forecasts, By End-user
12.7.2.5.1. Healthcare providers
12.7.2.5.2. Healthcare payers
12.7.2.5.3. Employer Groups
12.7.2.5.4. Users
12.7.3. India
12.7.3.1. India Telehealth Virtual Visits Market Revenue (US$ Mn) and
Forecasts, By Services Offered
12.7.3.1.1. Service Provider
12.7.3.1.2. Infrastructure provider
12.7.3.2. India Market Revenue (US$ Mn) and Forecasts, By Service Type
12.7.3.2.1. Reimbursable
12.7.3.2.2. Membership
12.7.3.2.3. Out-of-Pocket
12.7.3.3. India Telehealth Virtual Visits Market Revenue (US$ Mn) and
Forecasts, By Mode of visits
12.7.3.3.1. Video visits
12.7.3.3.2. Audio visits
12.7.3.3.3. Chat consultation
12.7.3.4. India Market Revenue (US$ Mn) and Forecasts, By Payment model
12.7.3.4.1. Subscription based model
12.7.3.4.2. Pay as you go model
12.7.3.4.3. Employer based model
12.7.3.5. India Telehealth Virtual Visits Market Revenue (US$ Mn) and
Forecasts, By End-user
12.7.3.5.1. Healthcare providers
12.7.3.5.2. Healthcare payers
12.7.3.5.3. Employer Groups
12.7.3.5.4. Users
12.7.4. Southeast Asia
12.7.4.1. Southeast Asia Telehealth Virtual Visits Market Revenue (US$
Mn) and Forecasts, By Services Offered
12.7.4.1.1. Service Provider
12.7.4.1.2. Infrastructure provider
12.7.4.2. Southeast Asia Market Revenue (US$ Mn) and Forecasts, By
Service Type
12.7.4.2.1. Reimbursable
12.7.4.2.2. Membership
12.7.4.2.3. Out-of-Pocket
12.7.4.3. Southeast Asia Telehealth Virtual Visits Market Revenue (US$
Mn) and Forecasts, By Mode of visits
12.7.4.3.1. Video visits
12.7.4.3.2. Audio visits
12.7.4.3.3. Chat consultation
12.7.4.4. Southeast Asia Market Revenue (US$ Mn) and Forecasts, By
Payment model
12.7.4.4.1. Subscription based model
12.7.4.4.2. Pay as you go model
12.7.4.4.3. Employer based model
12.7.4.5. Southeast Asia Telehealth Virtual Visits Market Revenue (US$
Mn) and Forecasts, By End-user
12.7.4.5.1. Healthcare providers
12.7.4.5.2. Healthcare payers
12.7.4.5.3. Employer Groups
12.7.4.5.4. Users
12.7.5. Rest of Asia Pacific
12.7.5.1. Rest of Asia Pacific Telehealth Virtual Visits Market Revenue
(US$ Mn) and Forecasts, By Services Offered
12.7.5.1.1. Service Provider
12.7.5.1.2. Infrastructure provider
12.7.5.2. Rest of Asia Pacific Market Revenue (US$ Mn) and Forecasts, By
Service Type
12.7.5.2.1. Reimbursable
12.7.5.2.2. Membership
12.7.5.2.3. Out-of-Pocket
12.7.5.3. Rest of Asia Pacific Telehealth Virtual Visits Market Revenue
(US$ Mn) and Forecasts, By Mode of visits
12.7.5.3.1. Video visits
12.7.5.3.2. Audio visits
12.7.5.3.3. Chat consultation
12.7.5.4. Rest of Asia Pacific Market Revenue (US$ Mn) and Forecasts, By
Payment model
12.7.5.4.1. Subscription based model
12.7.5.4.2. Pay as you go model
12.7.5.4.3. Employer based model
12.7.5.5. Rest of Asia Pacific Telehealth Virtual Visits Market Revenue
(US$ Mn) and Forecasts, By End-user
12.7.5.5.1. Healthcare providers
12.7.5.5.2. Healthcare payers
12.7.5.5.3. Employer Groups
12.7.5.5.4. Users
12.8. Key Segment for Channeling Investments
12.8.1. By Country
12.8.2. By Services Offered
12.8.3. By Service Type
12.8.4. By Mode of visits
12.8.5. By Payment model
12.8.6. By End-user
13. Middle East and Africa Telehealth Virtual Visits Market
Analysis and Forecasts, 2018 – 2026
13.1. Overview
13.1.1. Middle East and Africa Market Revenue (US$ Mn)
13.2. Middle East and Africa Telehealth Virtual Visits Market
Revenue (US$ Mn) and Forecasts, By Services Offered
13.2.1. Service Provider
13.2.2. Infrastructure provider
13.3. Middle East and Africa Market Revenue (US$ Mn) and Forecasts,
By Service Type
13.3.1. Reimbursable
13.3.2. Membership
13.3.3. Out-of-Pocket
13.4. Middle East and Africa Telehealth Virtual Visits Market
Revenue (US$ Mn) and Forecasts, By Mode of visits
13.4.1. Video visits
13.4.2. Audio visits
13.4.3. Chat consultation
13.5. Middle East and Africa Market Revenue (US$ Mn) and Forecasts,
By Payment model
13.5.1. Subscription based model
13.5.2. Pay as you go model
13.5.3. Employer based model
13.6. Middle East and Africa Telehealth Virtual Visits Market
Revenue (US$ Mn) and Forecasts, By End-user
13.6.1. Healthcare providers
13.6.2. Healthcare payers
13.6.3. Employer Groups
13.6.4. Users
13.7. Middle East and Africa Telehealth Virtual Visits Market
Revenue (US$ Mn) and Forecasts, By Country
13.7.1. GCC Countries
13.7.1.1. GCC Countries Telehealth Virtual Visits Market Revenue (US$
Mn) and Forecasts, By Services Offered
13.7.1.1.1. Service Provider
13.7.1.1.2. Infrastructure provider
13.7.1.2. GCC Countries Market Revenue (US$ Mn) and Forecasts, By
Service Type
13.7.1.2.1. Reimbursable
13.7.1.2.2. Membership
13.7.1.2.3. Out-of-Pocket
13.7.1.3. GCC Countries Telehealth Virtual Visits Market Revenue (US$
Mn) and Forecasts, By Mode of visits
13.7.1.3.1. Video visits
13.7.1.3.2. Audio visits
13.7.1.3.3. Chat consultation
13.7.1.4. GCC Countries Market Revenue (US$ Mn) and Forecasts, By
Payment model
13.7.1.4.1. Subscription based model
13.7.1.4.2. Pay as you go model
13.7.1.4.3. Employer based model
13.7.1.5. GCC Countries Telehealth Virtual Visits Market Revenue (US$
Mn) and Forecasts, By End-user
13.7.1.5.1. Healthcare providers
13.7.1.5.2. Healthcare payers
13.7.1.5.3. Employer Groups
13.7.1.5.4. Users
13.7.2. Southern Africa
13.7.2.1. Southern Africa Telehealth Virtual Visits Market Revenue (US$
Mn) and Forecasts, By Services Offered
13.7.2.1.1. Service Provider
13.7.2.1.2. Infrastructure provider
13.7.2.2. Southern Africa Market Revenue (US$ Mn) and Forecasts, By
Service Type
13.7.2.2.1. Reimbursable
13.7.2.2.2. Membership
13.7.2.2.3. Out-of-Pocket
13.7.2.3. Southern Africa Telehealth Virtual Visits Market Revenue (US$
Mn) and Forecasts, By Mode of visits
13.7.2.3.1. Video visits
13.7.2.3.2. Audio visits
13.7.2.3.3. Chat consultation
13.7.2.4. Southern Africa Market Revenue (US$ Mn) and Forecasts, By
Payment model
13.7.2.4.1. Subscription based model
13.7.2.4.2. Pay as you go model
13.7.2.4.3. Employer based model
13.7.2.5. Southern Africa Telehealth Virtual Visits Market Revenue (US$
Mn) and Forecasts, By End-user
13.7.2.5.1. Healthcare providers
13.7.2.5.2. Healthcare payers
13.7.2.5.3. Employer Groups
13.7.2.5.4. Users
13.7.3. Rest of MEA
13.7.3.1. Rest of MEA Telehealth Virtual Visits Market Revenue (US$ Mn)
and Forecasts, By Services Offered
13.7.3.1.1. Service Provider
13.7.3.1.2. Infrastructure provider
13.7.3.2. Rest of MEA Market Revenue (US$ Mn) and Forecasts, By Service
Type
13.7.3.2.1. Reimbursable
13.7.3.2.2. Membership
13.7.3.2.3. Out-of-Pocket
13.7.3.3. Rest of MEA Telehealth Virtual Visits Market Revenue (US$ Mn)
and Forecasts, By Mode of visits
13.7.3.3.1. Video visits
13.7.3.3.2. Audio visits
13.7.3.3.3. Chat consultation
13.7.3.4. Rest of MEA Market Revenue (US$ Mn) and Forecasts, By Payment
model
13.7.3.4.1. Subscription based model
13.7.3.4.2. Pay as you go model
13.7.3.4.3. Employer based model
13.7.3.5. Rest of MEA Telehealth Virtual Visits Market Revenue (US$ Mn)
and Forecasts, By End-user
13.7.3.5.1. Healthcare providers
13.7.3.5.2. Healthcare payers
13.7.3.5.3. Employer Groups
13.7.3.5.4. Users
13.8. Key Segment for Channeling Investments
13.8.1. By Country
13.8.2. By Services Offered
13.8.3. By Service Type
13.8.4. By Mode of visits
13.8.5. By Payment model
13.8.6. By End-user
14. Latin America Telehealth Virtual Visits Market Analysis and
Forecasts, 2018 – 2026
14.1. Overview
14.1.1. Latin America Market Revenue (US$ Mn)
14.2. Latin America Telehealth Virtual Visits Market Revenue (US$
Mn) and Forecasts, By Services Offered
14.2.1. Service Provider
14.2.2. Infrastructure provider
14.3. Latin America Market Revenue (US$ Mn) and Forecasts, By
Service Type
14.3.1. Reimbursable
14.3.2. Membership
14.3.3. Out-of-Pocket
14.4. Latin America Telehealth Virtual Visits Market Revenue (US$
Mn) and Forecasts, By Mode of visits
14.4.1. Video visits
14.4.2. Audio visits
14.4.3. Chat consultation
14.5. Latin America Market Revenue (US$ Mn) and Forecasts, By
Payment model
14.5.1. Subscription based model
14.5.2. Pay as you go model
14.5.3. Employer based model
14.6. Latin America Telehealth Virtual Visits Market Revenue (US$
Mn) and Forecasts, By End-user
14.6.1. Healthcare providers
14.6.2. Healthcare payers
14.6.3. Employer Groups
14.6.4. Users
14.7. Latin America Market Revenue (US$ Mn) and Forecasts, By
Country
14.7.1. Brazil
14.7.1.1. Brazil Telehealth Virtual Visits Market Revenue (US$ Mn) and
Forecasts, By Services Offered
14.7.1.1.1. Service Provider
14.7.1.1.2. Infrastructure provider
14.7.1.2. Brazil Market Revenue (US$ Mn) and Forecasts, By Service Type
14.7.1.2.1. Reimbursable
14.7.1.2.2. Membership
14.7.1.2.3. Out-of-Pocket
14.7.1.3. Brazil Telehealth Virtual Visits Market Revenue (US$ Mn) and
Forecasts, By Mode of visits
14.7.1.3.1. Video visits
14.7.1.3.2. Audio visits
14.7.1.3.3. Chat consultation
14.7.1.4. Brazil Market Revenue (US$ Mn) and Forecasts, By Payment model
14.7.1.4.1. Subscription based model
14.7.1.4.2. Pay as you go model
14.7.1.4.3. Employer based model
14.7.1.5. Brazil Telehealth Virtual Visits Market Revenue (US$ Mn) and
Forecasts, By End-user
14.7.1.5.1. Healthcare providers
14.7.1.5.2. Healthcare payers
14.7.1.5.3. Employer Groups
14.7.1.5.4. Users
14.7.2. Rest of Latin America
14.7.2.1. Rest of Latin America Telehealth Virtual Visits Market Revenue
(US$ Mn) and Forecasts, By Services Offered
14.7.2.1.1. Service Provider
14.7.2.1.2. Infrastructure provider
14.7.2.2. Rest of Latin America Market Revenue (US$ Mn) and Forecasts,
By Service Type
14.7.2.2.1. Reimbursable
14.7.2.2.2. Membership
14.7.2.2.3. Out-of-Pocket
14.7.2.3. Rest of Latin America Telehealth Virtual Visits Market Revenue
(US$ Mn) and Forecasts, By Mode of visits
14.7.2.3.1. Video visits
14.7.2.3.2. Audio visits
14.7.2.3.3. Chat consultation
14.7.2.4. Rest of Latin America Market Revenue (US$ Mn) and Forecasts,
By Payment model
14.7.2.4.1. Subscription based model
14.7.2.4.2. Pay as you go model
14.7.2.4.3. Employer based model
14.7.2.5. Rest of Latin America Telehealth Virtual Visits Market Revenue
(US$ Mn) and Forecasts, By End-user
14.7.2.5.1. Healthcare providers
14.7.2.5.2. Healthcare payers
14.7.2.5.3. Employer Groups
14.7.2.5.4. Users
14.8. Key Segment for Channeling Investments
14.8.1. By Country
14.8.2. By Services Offered
14.8.3. By Service Type
14.8.4. By Mode of visits
14.8.5. By Payment model
14.8.6. By End-user
15. Competitive Benchmarking
15.1. Player Positioning Analysis
15.2. Global Presence and Growth Strategies
16. Player Profiles
16.1. American Well Corporation
16.1.1. Company Details
16.1.2. Company Overview
16.1.3. Product Offerings
16.1.4. Key Developments
16.1.5. Financial Analysis
16.1.6. SWOT Analysis
16.1.7. Business Strategies
16.2. Carena Inc.
16.2.1. Company Details
16.2.2. Company Overview
16.2.3. Product Offerings
16.2.4. Key Developments
16.2.5. Financial Analysis
16.2.6. SWOT Analysis
16.2.7. Business Strategies
16.3. Cisco Systems, Inc.
16.3.1. Company Details
16.3.2. Company Overview
16.3.3. Product Offerings
16.3.4. Key Developments
16.3.5. Financial Analysis
16.3.6. SWOT Analysis
16.3.7. Business Strategies
16.4. Doctor on Demand Inc.
16.4.1. Company Details
16.4.2. Company Overview
16.4.3. Product Offerings
16.4.4. Key Developments
16.4.5. Financial Analysis
16.4.6. SWOT Analysis
16.4.7. Business Strategies
16.5. eVisit Telemedicine Solution
16.5.1. Company Details
16.5.2. Company Overview
16.5.3. Product Offerings
16.5.4. Key Developments
16.5.5. Financial Analysis
16.5.6. SWOT Analysis
16.5.7. Business Strategies
16.6. HealthTap
16.6.1. Company Details
16.6.2. Company Overview
16.6.3. Product Offerings
16.6.4. Key Developments
16.6.5. Financial Analysis
16.6.6. SWOT Analysis
16.6.7. Business Strategies
16.7. InteractiveMD LLC
16.7.1. Company Details
16.7.2. Company Overview
16.7.3. Product Offerings
16.7.4. Key Developments
16.7.5. Financial Analysis
16.7.6. SWOT Analysis
16.7.7. Business Strategies
16.8. Koninklijke Philips N.V.
16.8.1. Company Details
16.8.2. Company Overview
16.8.3. Product Offerings
16.8.4. Key Developments
16.8.5. Financial Analysis
16.8.6. SWOT Analysis
16.8.7. Business Strategies
16.9. Medtronic
16.9.1. Company Details
16.9.2. Company Overview
16.9.3. Product Offerings
16.9.4. Key Developments
16.9.5. Financial Analysis
16.9.6. SWOT Analysis
16.9.7. Business Strategies
16.10. MeMD
16.10.1. Company Details
16.10.2. Company Overview
16.10.3. Product Offerings
16.10.4. Key Developments
16.10.5. Financial Analysis
16.10.6. SWOT Analysis
16.10.7. Business Strategies
16.11. PlushCare, Inc.
16.11.1.
Company Details
16.11.2.
Company Overview
16.11.3.
Product Offerings
16.11.4.
Key Developments
16.11.5.
Financial Analysis
16.11.6.
SWOT Analysis
16.11.7.
Business Strategies
16.12. Practice Fusion Inc.
16.12.1.
Company Details
16.12.2.
Company Overview
16.12.3.
Product Offerings
16.12.4.
Key Developments
16.12.5.
Financial Analysis
16.12.6.
SWOT Analysis
16.12.7.
Business Strategies
16.13. Siemens Healthineers
16.13.1.
Company Details
16.13.2.
Company Overview
16.13.3.
Product Offerings
16.13.4.
Key Developments
16.13.5.
Financial Analysis
16.13.6.
SWOT Analysis
16.13.7.
Business Strategies
16.14. Teladoc Inc.
16.14.1.
Company Details
16.14.2.
Company Overview
16.14.3.
Product Offerings
16.14.4.
Key Developments
16.14.5.
Financial Analysis
16.14.6.
SWOT Analysis
16.14.7.
Business Strategies
16.15. Vidyo, Inc.
16.15.1.
Company Details
16.15.2.
Company Overview
16.15.3.
Product Offerings
16.15.4.
Key Developments
16.15.5.
Financial Analysis
16.15.6.
SWOT Analysis
16.15.7.
Business Strategies
16.16. Zipnosis
16.16.1.
Company Details
16.16.2.
Company Overview
16.16.3.
Product Offerings
16.16.4.
Key Developments
16.16.5.
Financial Analysis
16.16.6.
SWOT Analysis
16.16.7.
Business Strategies
Note:
This ToC is tentative and can be changed according to the research study
conducted during the course of report completion.
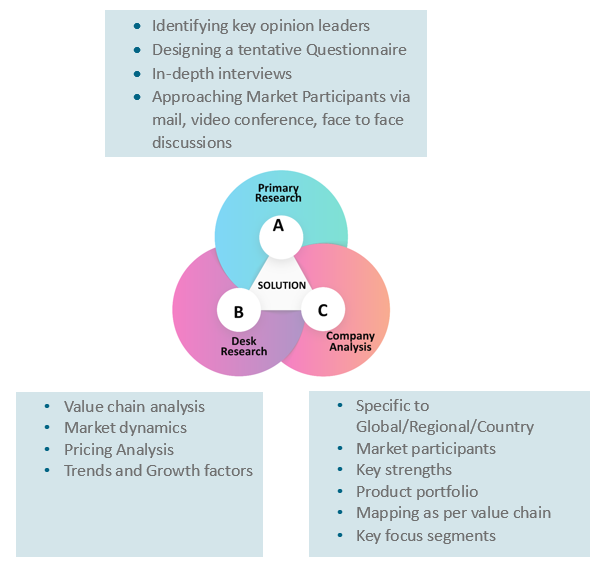
At Absolute Markets Insights, we are engaged in building both global as well as country specific reports. As a result, the approach taken for deriving the estimation and forecast for a specific country is a bit unique and different in comparison to the global research studies. In this case, we not only study the concerned market factors & trends prevailing in a particular country (from secondary research) but we also tend to calculate the actual market size & forecast from the revenue generated from the market participants involved in manufacturing or distributing the any concerned product. These companies can also be service providers. For analyzing any country specifically, we do consider the growth factors prevailing under the states/cities/county for the same. For instance, if we are analyzing an industry specific to United States, we primarily need to study about the states present under the same(where the product/service has the highest growth). Similar analysis will be followed by other countries. Our scope of the report changes with different markets.
Our research study is mainly implement through a mix of both secondary and primary research. Various sources such as industry magazines, trade journals, and government websites and trade associations are reviewed for gathering precise data. Primary interviews are conducted to validate the market size derived from secondary research. Industry experts, major manufacturers and distributors are contacted for further validation purpose on the current market penetration and growth trends.
Prominent participants in our primary research process include:
- Key Opinion Leaders namely the CEOs, CSOs, VPs, purchasing managers, amongst others
- Research and development participants, distributors/suppliers and subject matter experts
Secondary Research includes data extracted from paid data sources:
- Reuters
- Factiva
- Bloomberg
- One Source
- Hoovers
Research Methodology
Key Inclusions
Reach to us
Call us on
+91-74002-42424
Drop us an email at
sales@absolutemarketsinsights.com
Why Absolute Markets Insights?
An effective strategy is the entity that influences a business to stand out of the crowd. An organization with a phenomenal strategy for success dependably has the edge over the rivals in the market. It offers the organizations a head start in planning their strategy. Absolute Market Insights is the new initiation in the industry that will furnish you with the lead your business needs. Absolute Market Insights is the best destination for your business intelligence and analytical solutions; essentially because our qualitative and quantitative sources of information are competent to give one-stop solutions. We inventively combine qualitative and quantitative research in accurate proportions to have the best report, which not only gives the most recent insights but also assists you to grow.


