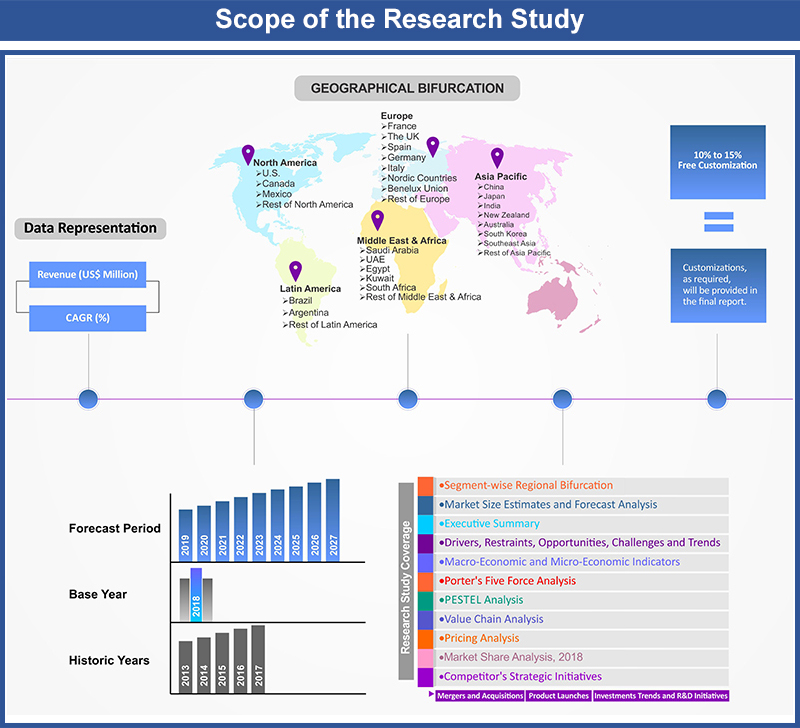
Europe 3D Machine Vision Market By Market Structure (3D Machine Vision Systems, 3D Machine Vision Components (Cameras, Sensors, Others); By Product Type (Monochromatic Machine Vision, Color Machine Vision System); By End-use Industry (Manufacturing, Automotive and Transportation, Printing and Packaging, Semiconductor, Food and Beverage, Healthcare, Pharmaceuticals, Aerospace and Defense, Others); By Competition Type (Minor League, Major League); By Countries (The UK, France, Germany, Italy, Spain, Nordic Countries (Denmark, Finland, Iceland, Sweden, Norway), Benelux Union (Belgium, the Netherlands, Luxembourg), Rest of Europe) – Europe Insights, Growth, Size, Comparative Analysis, Trends and Forecast, 2019 - 2027
Industry Trends
Businesses across Europe are adopting solutions for reducing operational costs and increasing their efficiency and quality. Machine vision systems termed as ‘eye of the machines’ are assisting business owners achieve these capabilities. Machine vision is the ability of the machines to capture and process image based information of real world objects. Automated Imaging Association (AIA) defines machine vision as a combination of hardware and software to provide operational guidance for devices, in industrial and non-industrial applications in execution of functions, based on the capture and processing of images. These machine vision systems encompasses a set of digital sensors, coupled with cameras or lasers, collectively working through a software programmed for acquiring image based data. The basic principle of operation in machine vision systems is detection of object by sensor followed by triggering transmission of light or laser beams on the object which are then returned to camera or sensor for generation of image data. This principle remains same irrespective of application or end use industry. Machine vision systems include 1D vision systems, 2D vision systems, Line Scan or Area Scans and 3D vision systems which are used in wide array of applications such as testing and inspection, calibration, robot/machine guidance, machine monitoring, sorting or counting and process control amongst others. All of these machine vision systems provide additional information about an object than simple absence/presence type sensors. 3D machine vision systems are the most commonly used method for the precise three-dimensional inspection and measurement of complex 3D free formed surfaces. This system generally uses multiple cameras or laser displacement sensors mounted at various locations and in triangulation on an objective position in the 3D space. The 3D machine vision systems facilitates surface inspection and volume measurement hence making inspection and handling accurate and error free due to elimination of human factor. Thus, the adoption of machine vision systems by businesses across Europe to increase efficiency and quality is driving the growth of Europe 3D machine vision market.
Europe has pioneered in industrial revolutions resulting in early adoption of latest technologies by businesses in the region. The automation in European industries has witnessed growth owing to competition posed from low wage countries. Industrial automation has enabled many manufacturing firms to continue their operations in Europe without relocating or outsourcing parts of production process by reducing the labour costs and also increasing the output. Governments of European countries are boosting the adoption of industrial automation. For instance, the UK government allotted a fund of US$ 114.79 Mn for research and development of industrial robots and automation from a US$ 2.96 Bn Industrial Strategy Challenge Fund (ISCF). Robotics and automation solutions in industries use multi camera 3D machine vision for application in guiding the robots with the part orientation data gathered. In contrast, these 3D machine vision systems can also deploy a set of multiple 3D laser-displacement sensors. Typical industrial application of this industrial robots range from inspection, quality control to assembling, locating and transporting parts amongst others. Thus, the wide array of industrial automation application coupled with the push from governmental entities towards the development of advanced robotics for industries is fuelling the growth of Europe 3D machine vision market.
Although, 3D machine vision solutions were initially designed for industrial/factory applications, advancement in technology has expanded its scope of applications to various non-industrial operations. The type of machine vision system, either scene-related or object-related, is determined based on the application. The most prominent applications of machine vision include healthcare and medical imaging, autonomous vehicle, traffic management and security surveillance. Medical and healthcare industry is widely adopting machine vision solutions for medical, microscopy, and life science applications. European companies such as STEMMER IMAGING AG, Basler AG and others are providing cameras and other machine vision solutions specifically designed for healthcare industry. The medical robots powered by 3D machine vision are capable of handling complex surgeries, thus increasing its demand in the sector. These systems are potential solutions in recent outbreak of COVID-19 for reducing the spread of infection in hospitals and industries by eliminating human contact. Thus, the wide array of applications for 3D machine vision systems coupled with its potential to tackle COVID-19 crisis are poised to drive the growth of Europe 3D machine vision market over the forecast period.
Market Structure Outlook:
Based on market structure, 3D machine vision systems dominated the Europe 3D machine vision market in 2018 owing to high adoption of the automation and robotic systems by enterprises. However, the 3D machine vision components are expected show fastest growth rate over the forecast period. As number of automation and robotics solution providers are equipping their robots with 3D machine vision, demand for components such as cameras, sensors and others are witnessing an upsurge in demand. For instance, DENSO WAVE Inc. provides robotic solutions to their customers powered with Canon 3D machine vision. Also, components are prone to replacements considering their continuous operations in harsh environments. Thus, the frequent need for replenishments or upgrades of components is posing higher demand. These factors are poised to boost the share of 3D machine vision components in Europe 3D machine vision market over forecast years.
End Use Industry Outlook:
Based on type of end use industry, automotive and transport contributed highest share in the Europe 3D machine vision market in 2018. The machine vision systems are applied in automotive industry for capturing images on manufacturing and assembly lines and to analyse this captured image information for identifying defects. Also, as these machine vision systems are becoming smaller and faster, they are increasingly being used in emerging automotive applications such as autonomous vehicles, advanced inspection technologies, and others. Industrial Vision Systems, a machine vision solutions provider from the UK, has installed their machine vision solutions in various automobile factories for inspecting door handles and the sub-assemblies. This wide array of applications for 3D machine vision in automotive and transport has contributed towards its growth in Europe 3D machine vision market.
Regional Outlook:
Germany dominated the Europe 3D machine vision market in 2018 and is expected to maintain this dominance over forecast year by growing at the fastest rate. High presence of global automobile and manufacturing giants, which contribute highest end use applications, in the country have contributed towards Germany’s high share in 3D machine vision market across Europe.
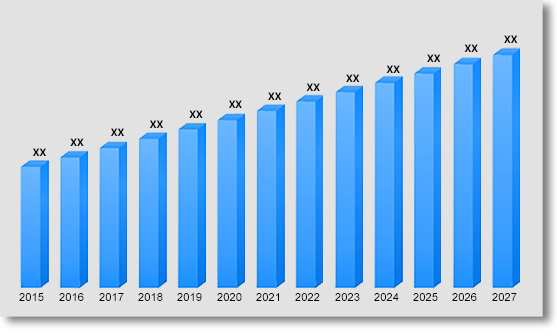
In terms of revenue, Europe 3D machine vision market was valued at US$ 370.0 Mn in 2018 and is anticipated to grow at a CAGR of 5.25% over the forecast period reaching US$ 617.5 Mn by 2027. The study analyses the market in terms of revenue across all the major countries in Europe.
Europe 3D Machine Vision Market Revenue & Forecast, (US$ Million), 2015 – 2027
Competitive Landscape
The report provides both, qualitative and quantitative research of Europe 3D machine vision market, as well as provides comprehensive insights and development methods adopted by the key contenders. The report also offers extensive research on the key players in this market and details on the competitiveness of these players. Key business strategies such as mergers and acquisitions (M&A), affiliations, collaborations, and contracts adopted by these major market participants are also recognized and analyzed in the report. For each company, the report studies their Europe presence, competitors, service offerings and specification amongst others.
Some of the players operating in the Europe 3D machine vision market are Allied Vision Technologies GmbH, Basler AG, Canon Europe, Chromasens GmbH, FRAMOS GmbH, IDS Imaging Development Systems GmbH, i-mation GmbH, ISRA VISION AG, MVTec Software GmbH and STEMMER IMAGING AG Corporation amongst others.
Europe 3D Machine Vision Market:
- By Market Structure
- 3D Machine Vision Systems
- 3D Machine Vision Components
- Cameras
- Sensors
- Others (Reader, Software, etc.)
- By Product Type
- Monochromatic Machine Vision
- Colour Machine Vision System
- By End-use Industry
- Manufacturing
- Automotive and Transportation
- Printing and Packaging
- Semiconductor
- Food and Beverage
- Healthcare
- Pharmaceuticals
- Aerospace and Defense
- Others (logistics, Sports, etc.)
- By Country
- France
- The UK
- Spain
- Germany
- Italy
- Nordic Countries
- Denmark
- Finland
- Iceland
- Sweden
- Norway
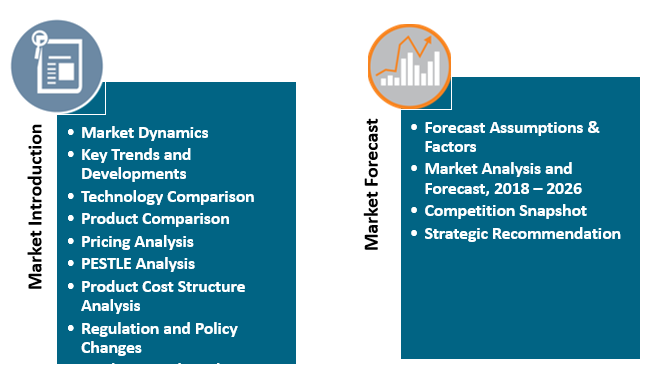
Table of Contents
![]()
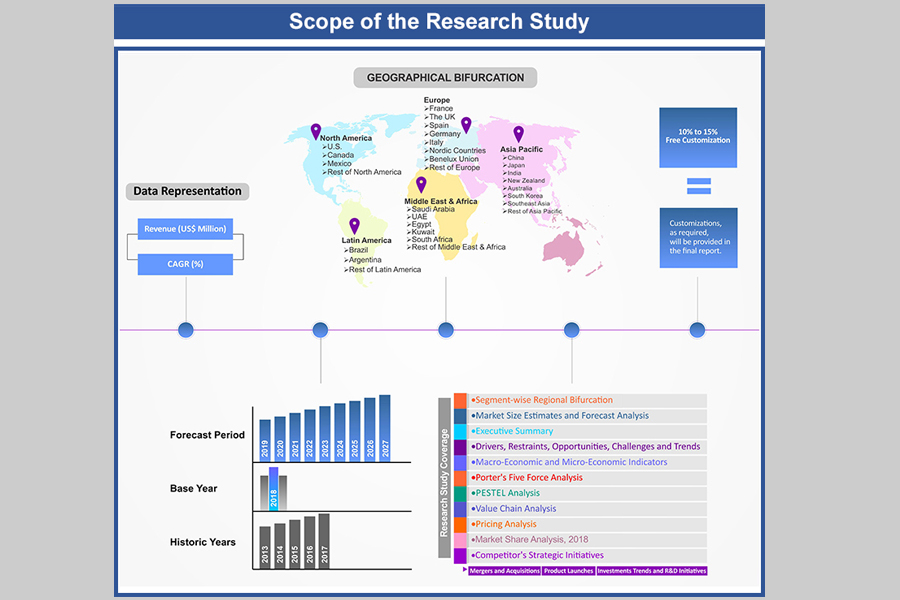
1. Market Scope
1.1. Market
Segmentation
1.2. Years
Considered
1.2.1. Historic
Years: 2013 - 2017
1.2.2. Base
Year: 2018
1.2.3. Forecast
Years: 2019 – 2027
2. Key Target Audiences
3. Research Methodology
3.1. Primary
Research
3.1.1. Research
Questionnaire
3.1.2. Europe
Percentage Breakdown
3.1.3. Primary
Interviews: Key Opinion Leaders (KOLs)
3.2. Secondary
Research
3.2.1. Paid
Databases
3.2.2. Secondary
Sources
3.3. Market
Size Estimates
3.3.1. Top-Down
Approach
3.3.2. Bottom-Up
Approach
3.4. Data
Triangulation Methodology
3.5. Research
Assumptions
4. Recommendations and Insights from AMI’s Perspective**
5. Holistic Overview of 3D Machine Vision Market
6. Market Synopsis: 3D
Machine Vision Market
7. 3D Machine Vision Market Analysis: Qualitative Perspective
7.1. Introduction
7.1.1. Product
Definition
7.1.2. Industry
Development
7.2. Market
Dynamics
7.2.1. Drivers
7.2.2. Restraints
7.2.3. Opportunities
7.3. Trends in
3D Machine Vision Market
7.4. Market
Determinants Radar Chart
7.5. Macro-Economic
and Micro-Economic Indicators: 3D Machine Vision Market
7.6. Porter’s Five Force Analysis
7.7. Analysis
on Impact of Covid-19 on Europe 3D Machine Vision Market
8. Europe 3D Machine Vision Market Analysis and Forecasts, 2019
– 2027
8.1. Overview
8.1.1. Europe
3D Machine Vision Market Revenue (US$ Mn)
8.2. Europe 3D
Machine Vision Market Revenue (US$ Mn) and Forecasts, By Market Structure
8.2.1. 3D
Machine Vision Systems
8.2.1.1. Definition
8.2.1.2. Market Penetration, 2018
8.2.1.3. Market Estimation, 2013 – 2018
8.2.1.4. Market Forecast, 2019 – 2027
8.2.1.5. Compound Annual Growth Rate (CAGR)
8.2.1.6. Regional Bifurcation
8.2.1.6.1. France
8.2.1.6.1.1. Market
Estimation, 2013 – 2018
8.2.1.6.1.2. Market
Forecast, 2019 – 2027
8.2.1.6.2. The UK
8.2.1.6.2.1. Market
Estimation, 2013 – 2018
8.2.1.6.2.2. Market
Forecast, 2019 – 2027
8.2.1.6.3. Spain
8.2.1.6.3.1. Market
Estimation, 2013 – 2018
8.2.1.6.3.2. Market
Forecast, 2019 – 2027
8.2.1.6.4. Germany
8.2.1.6.4.1. Market
Estimation, 2013 – 2018
8.2.1.6.4.2. Market
Forecast, 2019 – 2027
8.2.1.6.5. Italy
8.2.1.6.5.1. Market
Estimation, 2013 – 2018
8.2.1.6.5.2. Market
Forecast, 2019 – 2027
8.2.1.6.6. Nordic Countries
8.2.1.6.6.1. Market
Estimation, 2013 – 2018
8.2.1.6.6.2. Market
Forecast, 2019 – 2027
8.2.1.6.7. Benelux Union
8.2.1.6.7.1. Market
Estimation, 2013 – 2018
8.2.1.6.7.2. Market
Forecast, 2019 – 2027
8.2.1.6.8. Rest of Europe
8.2.1.6.8.1. Market
Estimation, 2013 – 2018
8.2.1.6.8.2. Market
Forecast, 2019 – 2027
8.2.2. 3D
Machine Vision Components
8.2.2.1. Definition
8.2.2.2. Market Penetration, 2018
8.2.2.3. Market Estimation, 2013 – 2018
8.2.2.4. Market Forecast, 2019 – 2027
8.2.2.5. Compound Annual Growth Rate (CAGR)
8.2.2.6. Regional Bifurcation
8.2.2.6.1. France
8.2.2.6.1.1. Market
Estimation, 2013 – 2018
8.2.2.6.1.2. Market
Forecast, 2019 – 2027
8.2.2.6.2. The UK
8.2.2.6.2.1. Market
Estimation, 2013 – 2018
8.2.2.6.2.2. Market
Forecast, 2019 – 2027
8.2.2.6.3. Spain
8.2.2.6.3.1. Market
Estimation, 2013 – 2018
8.2.2.6.3.2. Market
Forecast, 2019 – 2027
8.2.2.6.4. Germany
8.2.2.6.4.1. Market
Estimation, 2013 – 2018
8.2.2.6.4.2. Market
Forecast, 2019 – 2027
8.2.2.6.5. Italy
8.2.2.6.5.1. Market
Estimation, 2013 – 2018
8.2.2.6.5.2. Market
Forecast, 2019 – 2027
8.2.2.6.6. Nordic Countries
8.2.2.6.6.1. Market
Estimation, 2013 – 2018
8.2.2.6.6.2. Market
Forecast, 2019 – 2027
8.2.2.6.7. Benelux Union
8.2.2.6.7.1. Market
Estimation, 2013 – 2018
8.2.2.6.7.2. Market
Forecast, 2019 – 2027
8.2.2.6.8. Rest of Europe
8.2.2.6.8.1. Market
Estimation, 2013 – 2018
8.2.2.6.8.2. Market
Forecast, 2019 – 2027
8.3. Key
Segment for Channeling Investments
8.3.1. By
Market Structure
9. Europe 3D Machine Vision Market Analysis and Forecasts, 2019
– 2027
9.1. Overview
9.2. Europe 3D
Machine Vision Market Revenue (US$ Mn) and Forecasts, By Product Type
9.2.1. Monochromatic
Machine Vision
9.2.1.1. Definition
9.2.1.2. Market Penetration, 2018
9.2.1.3. Market Estimation, 2013 – 2018
9.2.1.4. Market Forecast, 2019 – 2027
9.2.1.5. Compound Annual Growth Rate (CAGR)
9.2.1.6. Regional Bifurcation
9.2.1.6.1. France
9.2.1.6.1.1. Market
Estimation, 2013 – 2018
9.2.1.6.1.2. Market
Forecast, 2019 – 2027
9.2.1.6.2. The UK
9.2.1.6.2.1. Market
Estimation, 2013 – 2018
9.2.1.6.2.2. Market
Forecast, 2019 – 2027
9.2.1.6.3. Spain
9.2.1.6.3.1. Market
Estimation, 2013 – 2018
9.2.1.6.3.2. Market
Forecast, 2019 – 2027
9.2.1.6.4. Germany
9.2.1.6.4.1. Market
Estimation, 2013 – 2018
9.2.1.6.4.2. Market
Forecast, 2019 – 2027
9.2.1.6.5. Italy
9.2.1.6.5.1. Market
Estimation, 2013 – 2018
9.2.1.6.5.2. Market
Forecast, 2019 – 2027
9.2.1.6.6. Nordic Countries
9.2.1.6.6.1. Market
Estimation, 2013 – 2018
9.2.1.6.6.2. Market
Forecast, 2019 – 2027
9.2.1.6.7. Benelux Union
9.2.1.6.7.1. Market
Estimation, 2013 – 2018
9.2.1.6.7.2. Market
Forecast, 2019 – 2027
9.2.1.6.8. Rest of Europe
9.2.1.6.8.1. Market
Estimation, 2013 – 2018
9.2.1.6.8.2. Market
Forecast, 2019 – 2027
9.2.2. Colour
Machine Vision System
9.2.2.1. Definition
9.2.2.2. Market Penetration, 2018
9.2.2.3. Market Estimation, 2013 – 2018
9.2.2.4. Market Forecast, 2019 – 2027
9.2.2.5. Compound Annual Growth Rate (CAGR)
9.2.2.6. Regional Bifurcation
9.2.2.6.1. France
9.2.2.6.1.1. Market
Estimation, 2013 – 2018
9.2.2.6.1.2. Market
Forecast, 2019 – 2027
9.2.2.6.2. The UK
9.2.2.6.2.1. Market
Estimation, 2013 – 2018
9.2.2.6.2.2. Market
Forecast, 2019 – 2027
9.2.2.6.3. Spain
9.2.2.6.3.1. Market
Estimation, 2013 – 2018
9.2.2.6.3.2. Market
Forecast, 2019 – 2027
9.2.2.6.4. Germany
9.2.2.6.4.1. Market
Estimation, 2013 – 2018
9.2.2.6.4.2. Market
Forecast, 2019 – 2027
9.2.2.6.5. Italy
9.2.2.6.5.1. Market
Estimation, 2013 – 2018
9.2.2.6.5.2. Market
Forecast, 2019 – 2027
9.2.2.6.6. Nordic Countries
9.2.2.6.6.1. Market
Estimation, 2013 – 2018
9.2.2.6.6.2. Market
Forecast, 2019 – 2027
9.2.2.6.7. Benelux Union
9.2.2.6.7.1. Market
Estimation, 2013 – 2018
9.2.2.6.7.2. Market
Forecast, 2019 – 2027
9.2.2.6.8. Rest of Europe
9.2.2.6.8.1. Market
Estimation, 2013 – 2018
9.2.2.6.8.2. Market
Forecast, 2019 – 2027
9.3. Key
Segment for Channeling Investments
9.3.1. By
Product Type
10. Europe 3D Machine Vision Market Analysis and Forecasts, 2019
– 2027
10.1. Overview
10.2. Europe 3D
Machine Vision Market Revenue (US$ Mn) and Forecasts, By End-use Industry
10.2.1. Manufacturing
10.2.1.1. Definition
10.2.1.2. Market Penetration, 2018
10.2.1.3. Market Estimation, 2013 – 2018
10.2.1.4. Market Forecast, 2019 – 2027
10.2.1.5. Compound Annual Growth Rate (CAGR)
10.2.1.6. Regional Bifurcation
10.2.1.6.1. France
10.2.1.6.1.1. Market
Estimation, 2013 – 2018
10.2.1.6.1.2. Market
Forecast, 2019 – 2027
10.2.1.6.2. The UK
10.2.1.6.2.1. Market
Estimation, 2013 – 2018
10.2.1.6.2.2. Market
Forecast, 2019 – 2027
10.2.1.6.3. Spain
10.2.1.6.3.1. Market
Estimation, 2013 – 2018
10.2.1.6.3.2. Market
Forecast, 2019 – 2027
10.2.1.6.4. Germany
10.2.1.6.4.1. Market
Estimation, 2013 – 2018
10.2.1.6.4.2. Market
Forecast, 2019 – 2027
10.2.1.6.5. Italy
10.2.1.6.5.1. Market
Estimation, 2013 – 2018
10.2.1.6.5.2. Market
Forecast, 2019 – 2027
10.2.1.6.6. Nordic Countries
10.2.1.6.6.1. Market
Estimation, 2013 – 2018
10.2.1.6.6.2. Market
Forecast, 2019 – 2027
10.2.1.6.7. Benelux Union
10.2.1.6.7.1. Market
Estimation, 2013 – 2018
10.2.1.6.7.2. Market
Forecast, 2019 – 2027
10.2.1.6.8. Rest of Europe
10.2.1.6.8.1. Market
Estimation, 2013 – 2018
10.2.1.6.8.2. Market
Forecast, 2019 – 2027
10.2.2. Automotive
and Transportation
10.2.2.1. Definition
10.2.2.2. Market Penetration, 2018
10.2.2.3. Market Estimation, 2013 – 2018
10.2.2.4. Market Forecast, 2019 – 2027
10.2.2.5. Compound Annual Growth Rate (CAGR)
10.2.2.6. Regional Bifurcation
10.2.2.6.1. France
10.2.2.6.1.1. Market
Estimation, 2013 – 2018
10.2.2.6.1.2. Market
Forecast, 2019 – 2027
10.2.2.6.2. The UK
10.2.2.6.2.1. Market
Estimation, 2013 – 2018
10.2.2.6.2.2. Market
Forecast, 2019 – 2027
10.2.2.6.3. Spain
10.2.2.6.3.1. Market
Estimation, 2013 – 2018
10.2.2.6.3.2. Market
Forecast, 2019 – 2027
10.2.2.6.4. Germany
10.2.2.6.4.1. Market
Estimation, 2013 – 2018
10.2.2.6.4.2. Market
Forecast, 2019 – 2027
10.2.2.6.5. Italy
10.2.2.6.5.1. Market
Estimation, 2013 – 2018
10.2.2.6.5.2. Market
Forecast, 2019 – 2027
10.2.2.6.6. Nordic Countries
10.2.2.6.6.1. Market
Estimation, 2013 – 2018
10.2.2.6.6.2. Market
Forecast, 2019 – 2027
10.2.2.6.7. Benelux Union
10.2.2.6.7.1. Market
Estimation, 2013 – 2018
10.2.2.6.7.2. Market
Forecast, 2019 – 2027
10.2.2.6.8. Rest of Europe
10.2.2.6.8.1. Market
Estimation, 2013 – 2018
10.2.2.6.8.2. Market
Forecast, 2019 – 2027
10.2.3. Printing
and Packaging
10.2.3.1. Definition
10.2.3.2. Market Penetration, 2018
10.2.3.3. Market Estimation, 2013 – 2018
10.2.3.4. Market Forecast, 2019 – 2027
10.2.3.5. Compound Annual Growth Rate (CAGR)
10.2.3.6. Regional Bifurcation
10.2.3.6.1. France
10.2.3.6.1.1. Market
Estimation, 2013 – 2018
10.2.3.6.1.2. Market
Forecast, 2019 – 2027
10.2.3.6.2. The UK
10.2.3.6.2.1. Market
Estimation, 2013 – 2018
10.2.3.6.2.2. Market
Forecast, 2019 – 2027
10.2.3.6.3. Spain
10.2.3.6.3.1. Market
Estimation, 2013 – 2018
10.2.3.6.3.2. Market
Forecast, 2019 – 2027
10.2.3.6.4. Germany
10.2.3.6.4.1. Market
Estimation, 2013 – 2018
10.2.3.6.4.2. Market
Forecast, 2019 – 2027
10.2.3.6.5. Italy
10.2.3.6.5.1. Market
Estimation, 2013 – 2018
10.2.3.6.5.2. Market
Forecast, 2019 – 2027
10.2.3.6.6. Nordic Countries
10.2.3.6.6.1. Market
Estimation, 2013 – 2018
10.2.3.6.6.2. Market
Forecast, 2019 – 2027
10.2.3.6.7. Benelux Union
10.2.3.6.7.1. Market
Estimation, 2013 – 2018
10.2.3.6.7.2. Market
Forecast, 2019 – 2027
10.2.3.6.8. Rest of Europe
10.2.3.6.8.1. Market
Estimation, 2013 – 2018
10.2.3.6.8.2. Market
Forecast, 2019 – 2027
10.2.4. Semiconductor
10.2.4.1. Definition
10.2.4.2. Market Penetration, 2018
10.2.4.3. Market Estimation, 2013 – 2018
10.2.4.4. Market Forecast, 2019 – 2027
10.2.4.5. Compound Annual Growth Rate (CAGR)
10.2.4.6. Regional Bifurcation
10.2.4.6.1. France
10.2.4.6.1.1. Market
Estimation, 2013 – 2018
10.2.4.6.1.2. Market
Forecast, 2019 – 2027
10.2.4.6.2. The UK
10.2.4.6.2.1. Market
Estimation, 2013 – 2018
10.2.4.6.2.2. Market
Forecast, 2019 – 2027
10.2.4.6.3. Spain
10.2.4.6.3.1. Market
Estimation, 2013 – 2018
10.2.4.6.3.2. Market
Forecast, 2019 – 2027
10.2.4.6.4. Germany
10.2.4.6.4.1. Market
Estimation, 2013 – 2018
10.2.4.6.4.2. Market
Forecast, 2019 – 2027
10.2.4.6.5. Italy
10.2.4.6.5.1. Market
Estimation, 2013 – 2018
10.2.4.6.5.2. Market
Forecast, 2019 – 2027
10.2.4.6.6. Nordic Countries
10.2.4.6.6.1. Market
Estimation, 2013 – 2018
10.2.4.6.6.2. Market
Forecast, 2019 – 2027
10.2.4.6.7. Benelux Union
10.2.4.6.7.1. Market
Estimation, 2013 – 2018
10.2.4.6.7.2. Market
Forecast, 2019 – 2027
10.2.4.6.8. Rest of Europe
10.2.4.6.8.1. Market
Estimation, 2013 – 2018
10.2.4.6.8.2. Market
Forecast, 2019 – 2027
10.2.5. Food
and Beverage
10.2.5.1. Definition
10.2.5.2. Market Penetration, 2018
10.2.5.3. Market Estimation, 2013 – 2018
10.2.5.4. Market Forecast, 2019 – 2027
10.2.5.5. Compound Annual Growth Rate (CAGR)
10.2.5.6. Regional Bifurcation
10.2.5.6.1. France
10.2.5.6.1.1. Market
Estimation, 2013 – 2018
10.2.5.6.1.2. Market
Forecast, 2019 – 2027
10.2.5.6.2. The UK
10.2.5.6.2.1. Market
Estimation, 2013 – 2018
10.2.5.6.2.2. Market
Forecast, 2019 – 2027
10.2.5.6.3. Spain
10.2.5.6.3.1. Market
Estimation, 2013 – 2018
10.2.5.6.3.2. Market
Forecast, 2019 – 2027
10.2.5.6.4. Germany
10.2.5.6.4.1. Market
Estimation, 2013 – 2018
10.2.5.6.4.2. Market
Forecast, 2019 – 2027
10.2.5.6.5. Italy
10.2.5.6.5.1. Market
Estimation, 2013 – 2018
10.2.5.6.5.2. Market
Forecast, 2019 – 2027
10.2.5.6.6. Nordic Countries
10.2.5.6.6.1. Market
Estimation, 2013 – 2018
10.2.5.6.6.2. Market
Forecast, 2019 – 2027
10.2.5.6.7. Benelux Union
10.2.5.6.7.1. Market
Estimation, 2013 – 2018
10.2.5.6.7.2. Market
Forecast, 2019 – 2027
10.2.5.6.8. Rest of Europe
10.2.5.6.8.1. Market
Estimation, 2013 – 2018
10.2.5.6.8.2. Market
Forecast, 2019 – 2027
10.2.6. Healthcare
10.2.6.1. Definition
10.2.6.2. Market Penetration, 2018
10.2.6.3. Market Estimation, 2013 – 2018
10.2.6.4. Market Forecast, 2019 – 2027
10.2.6.5. Compound Annual Growth Rate (CAGR)
10.2.6.6. Regional Bifurcation
10.2.6.6.1. France
10.2.6.6.1.1. Market
Estimation, 2013 – 2018
10.2.6.6.1.2. Market
Forecast, 2019 – 2027
10.2.6.6.2. The UK
10.2.6.6.2.1. Market
Estimation, 2013 – 2018
10.2.6.6.2.2. Market
Forecast, 2019 – 2027
10.2.6.6.3. Spain
10.2.6.6.3.1. Market
Estimation, 2013 – 2018
10.2.6.6.3.2. Market
Forecast, 2019 – 2027
10.2.6.6.4. Germany
10.2.6.6.4.1. Market
Estimation, 2013 – 2018
10.2.6.6.4.2. Market
Forecast, 2019 – 2027
10.2.6.6.5. Italy
10.2.6.6.5.1. Market
Estimation, 2013 – 2018
10.2.6.6.5.2. Market
Forecast, 2019 – 2027
10.2.6.6.6. Nordic Countries
10.2.6.6.6.1. Market
Estimation, 2013 – 2018
10.2.6.6.6.2. Market
Forecast, 2019 – 2027
10.2.6.6.7. Benelux Union
10.2.6.6.7.1. Market
Estimation, 2013 – 2018
10.2.6.6.7.2. Market
Forecast, 2019 – 2027
10.2.6.6.8. Rest of Europe
10.2.6.6.8.1. Market
Estimation, 2013 – 2018
10.2.6.6.8.2. Market
Forecast, 2019 – 2027
10.2.7. Pharmaceuticals
10.2.7.1. Definition
10.2.7.2. Market Penetration, 2018
10.2.7.3. Market Estimation, 2013 – 2018
10.2.7.4. Market Forecast, 2019 – 2027
10.2.7.5. Compound Annual Growth Rate (CAGR)
10.2.7.6. Regional Bifurcation
10.2.7.6.1. France
10.2.7.6.1.1. Market
Estimation, 2013 – 2018
10.2.7.6.1.2. Market
Forecast, 2019 – 2027
10.2.7.6.2. The UK
10.2.7.6.2.1. Market
Estimation, 2013 – 2018
10.2.7.6.2.2. Market
Forecast, 2019 – 2027
10.2.7.6.3. Spain
10.2.7.6.3.1. Market
Estimation, 2013 – 2018
10.2.7.6.3.2. Market
Forecast, 2019 – 2027
10.2.7.6.4. Germany
10.2.7.6.4.1. Market
Estimation, 2013 – 2018
10.2.7.6.4.2. Market
Forecast, 2019 – 2027
10.2.7.6.5. Italy
10.2.7.6.5.1. Market
Estimation, 2013 – 2018
10.2.7.6.5.2. Market
Forecast, 2019 – 2027
10.2.7.6.6. Nordic Countries
10.2.7.6.6.1. Market
Estimation, 2013 – 2018
10.2.7.6.6.2. Market
Forecast, 2019 – 2027
10.2.7.6.7. Benelux Union
10.2.7.6.7.1. Market
Estimation, 2013 – 2018
10.2.7.6.7.2. Market
Forecast, 2019 – 2027
10.2.7.6.8. Rest of Europe
10.2.7.6.8.1. Market
Estimation, 2013 – 2018
10.2.7.6.8.2. Market
Forecast, 2019 – 2027
10.2.8. Aerospace
and Defense
10.2.8.1. Definition
10.2.8.2. Market Penetration, 2018
10.2.8.3. Market Estimation, 2013 – 2018
10.2.8.4. Market Forecast, 2019 – 2027
10.2.8.5. Compound Annual Growth Rate (CAGR)
10.2.8.6. Regional Bifurcation
10.2.8.6.1. France
10.2.8.6.1.1. Market
Estimation, 2013 – 2018
10.2.8.6.1.2. Market
Forecast, 2019 – 2027
10.2.8.6.2. The UK
10.2.8.6.2.1. Market
Estimation, 2013 – 2018
10.2.8.6.2.2. Market
Forecast, 2019 – 2027
10.2.8.6.3. Spain
10.2.8.6.3.1. Market
Estimation, 2013 – 2018
10.2.8.6.3.2. Market
Forecast, 2019 – 2027
10.2.8.6.4. Germany
10.2.8.6.4.1. Market
Estimation, 2013 – 2018
10.2.8.6.4.2. Market
Forecast, 2019 – 2027
10.2.8.6.5. Italy
10.2.8.6.5.1. Market
Estimation, 2013 – 2018
10.2.8.6.5.2. Market
Forecast, 2019 – 2027
10.2.8.6.6. Nordic Countries
10.2.8.6.6.1. Market
Estimation, 2013 – 2018
10.2.8.6.6.2. Market
Forecast, 2019 – 2027
10.2.8.6.7. Benelux Union
10.2.8.6.7.1. Market
Estimation, 2013 – 2018
10.2.8.6.7.2. Market
Forecast, 2019 – 2027
10.2.8.6.8. Rest of Europe
10.2.8.6.8.1. Market
Estimation, 2013 – 2018
10.2.8.6.8.2. Market
Forecast, 2019 – 2027
10.2.9. Others
10.2.9.1. Definition
10.2.9.2. Market Penetration, 2018
10.2.9.3. Market Estimation, 2013 – 2018
10.2.9.4. Market Forecast, 2019 – 2027
10.2.9.5. Compound Annual Growth Rate (CAGR)
10.2.9.6. Regional Bifurcation
10.2.9.6.1. France
10.2.9.6.1.1. Market
Estimation, 2013 – 2018
10.2.9.6.1.2. Market
Forecast, 2019 – 2027
10.2.9.6.2. The UK
10.2.9.6.2.1. Market
Estimation, 2013 – 2018
10.2.9.6.2.2. Market
Forecast, 2019 – 2027
10.2.9.6.3. Spain
10.2.9.6.3.1. Market
Estimation, 2013 – 2018
10.2.9.6.3.2. Market
Forecast, 2019 – 2027
10.2.9.6.4. Germany
10.2.9.6.4.1. Market
Estimation, 2013 – 2018
10.2.9.6.4.2. Market
Forecast, 2019 – 2027
10.2.9.6.5. Italy
10.2.9.6.5.1. Market
Estimation, 2013 – 2018
10.2.9.6.5.2. Market
Forecast, 2019 – 2027
10.2.9.6.6. Nordic Countries
10.2.9.6.6.1. Market
Estimation, 2013 – 2018
10.2.9.6.6.2. Market
Forecast, 2019 – 2027
10.2.9.6.7. Benelux Union
10.2.9.6.7.1. Market
Estimation, 2013 – 2018
10.2.9.6.7.2. Market
Forecast, 2019 – 2027
10.2.9.6.8. Rest of Europe
10.2.9.6.8.1. Market
Estimation, 2013 – 2018
10.2.9.6.8.2. Market
Forecast, 2019 – 2027
10.3. Key
Segment for Channeling Investments
10.3.1. By
End-use Industry
11. Europe 3D Machine Vision Market Analysis and Forecasts, 2019
- 2027
11.1. Overview
11.2. Europe 3D
Machine Vision Market Revenue (US$ Mn), By Country
11.2.1. France
11.2.1.1. France 3D Machine Vision Market Revenue (US$ Mn) and
Forecasts, By Market Structure
11.2.1.1.1. 3D Machine Vision Systems
11.2.1.1.2. 3D Machine Vision Components
11.2.1.2. France 3D Machine Vision Market Revenue (US$ Mn) and
Forecasts, By Product Type
11.2.1.2.1. Monochromatic Machine Vision
11.2.1.2.2. Colour Machine Vision System
11.2.1.3. France 3D Machine Vision Market Revenue (US$ Mn) and
Forecasts, By End-use Industry
11.2.1.3.1. Manufacturing
11.2.1.3.2. Automotive and Transportation
11.2.1.3.3. Printing and Packaging
11.2.1.3.4. Semiconductor
11.2.1.3.5. Food and Beverage
11.2.1.3.6. Healthcare
11.2.1.3.7. Pharmaceuticals
11.2.1.3.8. Aerospace and Defense
11.2.1.3.9. Others
11.2.2. The UK
11.2.2.1. The UK 3D Machine Vision Market Revenue (US$ Mn) and
Forecasts, By Market Structure
11.2.2.1.1. 3D Machine Vision Systems
11.2.2.1.2. 3D Machine Vision Components
11.2.2.2. The UK 3D Machine Vision Market Revenue (US$ Mn) and
Forecasts, By Product Type
11.2.2.2.1. Monochromatic Machine Vision
11.2.2.2.2. Colour Machine Vision System
11.2.2.3. The UK 3D Machine Vision Market Revenue (US$ Mn) and
Forecasts, By End-use Industry
11.2.2.3.1. Manufacturing
11.2.2.3.2. Automotive and Transportation
11.2.2.3.3. Printing and Packaging
11.2.2.3.4. Semiconductor
11.2.2.3.5. Food and Beverage
11.2.2.3.6. Healthcare
11.2.2.3.7. Pharmaceuticals
11.2.2.3.8. Aerospace and Defense
11.2.2.3.9. Others
11.2.3. Spain
11.2.3.1. Spain 3D Machine Vision Market Revenue (US$ Mn) and Forecasts,
By Market Structure
11.2.3.1.1. 3D Machine Vision Systems
11.2.3.1.2. 3D Machine Vision Components
11.2.3.2. Spain 3D Machine Vision Market Revenue (US$ Mn) and Forecasts,
By Product Type
11.2.3.2.1. Monochromatic Machine Vision
11.2.3.2.2. Colour Machine Vision System
11.2.3.3. Spain 3D Machine Vision Market Revenue (US$ Mn) and Forecasts,
By End-use Industry
11.2.3.3.1. Manufacturing
11.2.3.3.2. Automotive and Transportation
11.2.3.3.3. Printing and Packaging
11.2.3.3.4. Semiconductor
11.2.3.3.5. Food and Beverage
11.2.3.3.6. Healthcare
11.2.3.3.7. Pharmaceuticals
11.2.3.3.8. Aerospace and Defense
11.2.3.3.9. Others
11.2.4. Germany
11.2.4.1. Germany 3D Machine Vision Market Revenue (US$ Mn) and
Forecasts, By Market Structure
11.2.4.1.1. 3D Machine Vision Systems
11.2.4.1.2. 3D Machine Vision Components
11.2.4.2. Germany 3D Machine Vision Market Revenue (US$ Mn) and
Forecasts, By Product Type
11.2.4.2.1. Monochromatic Machine Vision
11.2.4.2.2. Colour Machine Vision System
11.2.4.3. Germany 3D Machine Vision Market Revenue (US$ Mn) and
Forecasts, By End-use Industry
11.2.4.3.1. Manufacturing
11.2.4.3.2. Automotive and Transportation
11.2.4.3.3. Printing and Packaging
11.2.4.3.4. Semiconductor
11.2.4.3.5. Food and Beverage
11.2.4.3.6. Healthcare
11.2.4.3.7. Pharmaceuticals
11.2.4.3.8. Aerospace and Defense
11.2.4.3.9. Others
11.2.5. Italy
11.2.5.1. Italy 3D Machine Vision Market Revenue (US$ Mn) and Forecasts,
By Market Structure
11.2.5.1.1. 3D Machine Vision Systems
11.2.5.1.2. 3D Machine Vision Components
11.2.5.2. Italy 3D Machine Vision Market Revenue (US$ Mn) and Forecasts,
By Product Type
11.2.5.2.1. Monochromatic Machine Vision
11.2.5.2.2. Colour Machine Vision System
11.2.5.3. Italy 3D Machine Vision Market Revenue (US$ Mn) and Forecasts,
By End-use Industry
11.2.5.3.1. Manufacturing
11.2.5.3.2. Automotive and Transportation
11.2.5.3.3. Printing and Packaging
11.2.5.3.4. Semiconductor
11.2.5.3.5. Food and Beverage
11.2.5.3.6. Healthcare
11.2.5.3.7. Pharmaceuticals
11.2.5.3.8. Aerospace and Defense
11.2.5.3.9. Others
11.2.6. Nordic
Countries
11.2.6.1. Nordic Countries 3D Machine Vision Market Revenue (US$ Mn) and
Forecasts, By Market Structure
11.2.6.1.1. 3D Machine Vision Systems
11.2.6.1.2. 3D Machine Vision Components
11.2.6.2. Nordic Countries 3D Machine Vision Market Revenue (US$ Mn) and
Forecasts, By Product Type
11.2.6.2.1. Monochromatic Machine Vision
11.2.6.2.2. Colour Machine Vision System
11.2.6.3. Nordic Countries 3D Machine Vision Market Revenue (US$ Mn) and
Forecasts, By End-use Industry
11.2.6.3.1. Manufacturing
11.2.6.3.2. Automotive and Transportation
11.2.6.3.3. Printing and Packaging
11.2.6.3.4. Semiconductor
11.2.6.3.5. Food and Beverage
11.2.6.3.6. Healthcare
11.2.6.3.7. Pharmaceuticals
11.2.6.3.8. Aerospace and Defense
11.2.6.3.9. Others
11.2.6.4. Nordic Countries 3D Machine Vision Market Revenue (US$ Mn) and
Forecasts, By Country
11.2.6.4.1. Denmark
11.2.6.4.2. Finland
11.2.6.4.3. Iceland
11.2.6.4.4. Sweden
11.2.6.4.5. Norway
11.2.7. Benelux
Union
11.2.7.1. Benelux Union 3D Machine Vision Market Revenue (US$ Mn) and
Forecasts, By Market Structure
11.2.7.1.1. 3D Machine Vision Systems
11.2.7.1.2. 3D Machine Vision Components
11.2.7.2. Benelux Union 3D Machine Vision Market Revenue (US$ Mn) and
Forecasts, By Product Type
11.2.7.2.1. Monochromatic Machine Vision
11.2.7.2.2. Colour Machine Vision System
11.2.7.3. Benelux Union 3D Machine Vision Market Revenue (US$ Mn) and
Forecasts, By End-use Industry
11.2.7.3.1. Manufacturing
11.2.7.3.2. Automotive and Transportation
11.2.7.3.3. Printing and Packaging
11.2.7.3.4. Semiconductor
11.2.7.3.5. Food and Beverage
11.2.7.3.6. Healthcare
11.2.7.3.7. Pharmaceuticals
11.2.7.3.8. Aerospace and Defense
11.2.7.3.9. Others
11.2.7.4. Benelux Union 3D Machine Vision Market Revenue (US$ Mn) and
Forecasts, By Country
11.2.7.4.1. Belgium
11.2.7.4.2. The Netherlands
11.2.7.4.3. Luxembourg
11.2.8. Rest of
Europe
11.2.8.1. Rest of Europe 3D Machine Vision Market Revenue (US$ Mn) and
Forecasts, By Market Structure
11.2.8.1.1. 3D Machine Vision Systems
11.2.8.1.2. 3D Machine Vision Components
11.2.8.2. Rest of Europe 3D Machine Vision Market Revenue (US$ Mn) and
Forecasts, By Product Type
11.2.8.2.1. Monochromatic Machine Vision
11.2.8.2.2. Colour Machine Vision System
11.2.8.3. Rest of Europe 3D Machine Vision Market Revenue (US$ Mn) and
Forecasts, By End-use Industry
11.2.8.3.1. Manufacturing
11.2.8.3.2. Automotive and Transportation
11.2.8.3.3. Printing and Packaging
11.2.8.3.4. Semiconductor
11.2.8.3.5. Food and Beverage
11.2.8.3.6. Healthcare
11.2.8.3.7. Pharmaceuticals
11.2.8.3.8. Aerospace and Defense
11.2.8.3.9. Others
11.3. Key Segment
for Channeling Investments
11.3.1. By
Country
11.3.2. By
Market Structure
11.3.3. By
Product Type
11.3.4. By
End-use Industry
12. Competitive Benchmarking
12.1. Market
Share Analysis, 2018
12.2. Europe
Presence and Growth Strategies
12.2.1. Mergers
and Acquisitions
12.2.2. Product
Launches
12.2.3. Investments
Trends
12.2.4. R&D
Initiatives
13. Player Profiles
13.1. Allied
Vision Technologies GmbH
13.1.1. Company
Details
13.1.2. Company
Overview
13.1.3. Product
Offerings
13.1.4. Key
Developments
13.1.5. Financial
Analysis
13.1.6. SWOT
Analysis
13.1.7. Business
Strategies
13.2. Basler AG
13.2.1. Company
Details
13.2.2. Company
Overview
13.2.3. Product
Offerings
13.2.4. Key Developments
13.2.5. Financial
Analysis
13.2.6. SWOT
Analysis
13.2.7. Business
Strategies
13.3. Canon
Europe
13.3.1. Company
Details
13.3.2. Company
Overview
13.3.3. Product
Offerings
13.3.4. Key
Developments
13.3.5. Financial
Analysis
13.3.6. SWOT
Analysis
13.3.7. Business
Strategies
13.4. Chromasens
GmbH
13.4.1. Company
Details
13.4.2. Company
Overview
13.4.3. Product
Offerings
13.4.4. Key
Developments
13.4.5. Financial
Analysis
13.4.6. SWOT
Analysis
13.4.7. Business
Strategies
13.5. FRAMOS
GmbH
13.5.1. Company
Details
13.5.2. Company
Overview
13.5.3. Product
Offerings
13.5.4. Key
Developments
13.5.5. Financial
Analysis
13.5.6. SWOT
Analysis
13.5.7. Business
Strategies
13.6. IDS
Imaging Development Systems GmbH
13.6.1. Company
Details
13.6.2. Company
Overview
13.6.3. Product
Offerings
13.6.4. Key
Developments
13.6.5. Financial
Analysis
13.6.6. SWOT
Analysis
13.6.7. Business
Strategies
13.7. i-mation
GmbH
13.7.1. Company
Details
13.7.2. Company
Overview
13.7.3. Product
Offerings
13.7.4. Key
Developments
13.7.5. Financial
Analysis
13.7.6. SWOT
Analysis
13.7.7. Business
Strategies
13.8. ISRA VISION
AG
13.8.1. Company
Details
13.8.2. Company
Overview
13.8.3. Product
Offerings
13.8.4. Key
Developments
13.8.5. Financial
Analysis
13.8.6. SWOT
Analysis
13.8.7. Business
Strategies
13.9. MVTec
Software GmbH
13.9.1. Company
Details
13.9.2. Company
Overview
13.9.3. Product
Offerings
13.9.4. Key
Developments
13.9.5. Financial
Analysis
13.9.6. SWOT
Analysis
13.9.7. Business
Strategies
13.10. STEMMER
IMAGING AG
13.10.1. Company
Details
13.10.2. Company
Overview
13.10.3. Product
Offerings
13.10.4. Key
Developments
13.10.5. Financial
Analysis
13.10.6. SWOT
Analysis
13.10.7. Business
Strategies
13.11. Other
Market Participants
14. Key Findings
Note: This ToC is tentative
and can be changed according to the research study conducted during the course
of report completion.
**Exclusive for Multi-User and
Enterprise User
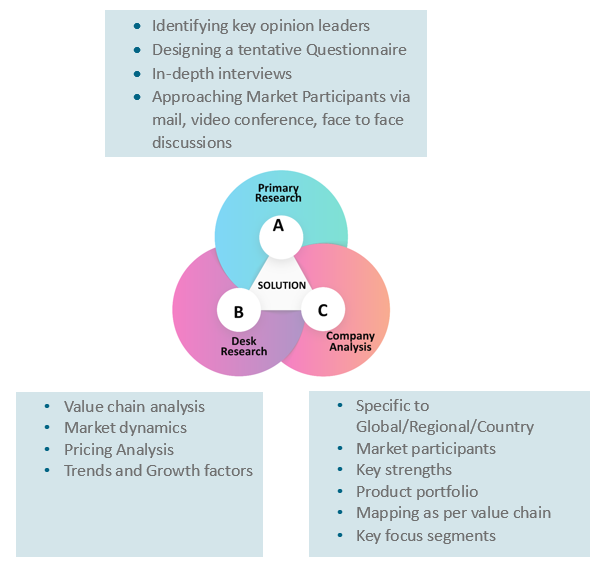
At Absolute Markets Insights, we are engaged in building both global as well as country specific reports. As a result, the approach taken for deriving the estimation and forecast for a specific country is a bit unique and different in comparison to the global research studies. In this case, we not only study the concerned market factors & trends prevailing in a particular country (from secondary research) but we also tend to calculate the actual market size & forecast from the revenue generated from the market participants involved in manufacturing or distributing the any concerned product. These companies can also be service providers. For analyzing any country specifically, we do consider the growth factors prevailing under the states/cities/county for the same. For instance, if we are analyzing an industry specific to United States, we primarily need to study about the states present under the same(where the product/service has the highest growth). Similar analysis will be followed by other countries. Our scope of the report changes with different markets.
Our research study is mainly implement through a mix of both secondary and primary research. Various sources such as industry magazines, trade journals, and government websites and trade associations are reviewed for gathering precise data. Primary interviews are conducted to validate the market size derived from secondary research. Industry experts, major manufacturers and distributors are contacted for further validation purpose on the current market penetration and growth trends.
Prominent participants in our primary research process include:
- Key Opinion Leaders namely the CEOs, CSOs, VPs, purchasing managers, amongst others
- Research and development participants, distributors/suppliers and subject matter experts
Secondary Research includes data extracted from paid data sources:
- Reuters
- Factiva
- Bloomberg
- One Source
- Hoovers
Research Methodology
Key Inclusions
Why Absolute Markets Insights?
An effective strategy is the entity that influences a business to stand out of the crowd. An organization with a phenomenal strategy for success dependably has the edge over the rivals in the market. It offers the organizations a head start in planning their strategy. Absolute Market Insights is the new initiation in the industry that will furnish you with the lead your business needs. Absolute Market Insights is the best destination for your business intelligence and analytical solutions; essentially because our qualitative and quantitative sources of information are competent to give one-stop solutions. We inventively combine qualitative and quantitative research in accurate proportions to have the best report, which not only gives the most recent insights but also assists you to grow.
