
Autonomous Forklifts Market by Type (Indoor, Outdoor); by Fuel Source (Electric, CNG, Petrol and Diesel, Fuel Cells); by Technology (Line Guided, Laser Guided, Vision Guided (3D), Others); by Industry (Pharmaceutical, Chemical, Manufacturing, Automotive, Paper and Print, Food and Beverage, Others); by Truck Type (Side Loader, Counterbalance Forklift, Telehandler, Rough Terrain Forklift, Pallet Jack, Walkie Stacker, Order Picker, Reach Fork Truck, Others); by Channel (OEM, Aftermarket); by Capacity (Less than 1000, 1000-2000 , 2000-5000, Above 5000); By Region (U.S., Canada, Mexico, Rest of North America, France, The UK, Spain, Germany, Italy, Nordic Countries, Benelux Union, Rest of Europe, China, Japan, India, New Zealand, Australia, South Korea, Southeast Asia, Rest of Asia Pacific, Saudi Arabia, UAE, Egypt, Kuwait, South Africa, Rest of Middle East & Africa, Brazil, Argentina, Rest of Latin America) – Global Insights, Growth, Size, Comparative Analysis, Trends and Forecast, 2019 – 2027
Industry Trends
Autonomous forklifts are self-driving forklifts that eliminate the human need in the warehousing process. Forklift are the trucks equipped with additional capabilities than a normal truck and are used to lift and shift heavy loads from one place to another, reducing the physical activity. The growing demand for autonomous forklifts in various commercial and industrial applications including manufacturing, construction and freight & logistics for loading and unloading the items is driving the growth of global autonomous forklifts market. Autonomous forklifts are being majorly deployed in the industries where human operators are restricted. On the basis of type, global autonomous forklift market is classified as indoor and outdoor forklifts. The majority of forklifts are used within premises such as warehouses, which is increasing the demand for indoor forklifts. With the increasing need for optimized facilities for mass storage and tall racking in warehouses, forklifts are used to increase the efficiency of process. For instance, Gen Surv Robotics, an automated solutions provider in Thailand, offers PLY AGV indoor forklift, for heavy load indoor transports in warehouses and factories. These forklifts can be integrated to warehouse management system providing a real time monitoring of stock location and tasks. Forklifts helps optimizing the process flow by utilizing advanced logistics and automating material handling processes to move products quickly and more efficiently. Therefore the growing need among organizations to adopt advanced automation technology to amplify productivity is driving the autonomous forklifts market in the forecast period.
The autonomous forklifts are being used across various industries including pharmaceutical, chemical, manufacturing, automotive, paper and print, food and beverage amongst others. For instance, Seegrid Corporation, a provider of vehicle autonomous kits for all kinds of OEM, 3PLs and distribution centers, offers a self-driving, vision guides vehicles along with software and engineering systems to minimize human involvement and maximize productivity. Similarly, Toyota offers autopilot vision systems for forklifts and also offers automated carts for factories and warehouses. The autonomous forklifts eliminate the manual work and provide efficiency in the industrial and commercial environment by transferring the materials between the point of storage and point of consumption. Thereby driving the autonomous forklifts market in the forecast period. Material handling warehouse activities are being automated, owing to technology advances and competitive nature of business. Picking, packing, shipping automation is seemingly taking over throughout every aspect of the warehouse. Forklifts are effectively used in distribution and manufacturing environments, however, places with limited spaces and high number of product loads, forklifts are often not regarded as the most effective or safest form of material handling. Various technologies are being integrated in autonomous forklifts including line guided, laser-guided, vision-guided (3D) amongst others. Vision Guided (3D) is expected to dominate the segment in the forecast period owing to its easy integration into the existing infrastructure by using 3D modelling technology that builds a map for flexible operation. 3D modeling develops the mathematical representation of the objects in three dimensions through software guiding the forklifts for further motion. For instance, Bastian Solutions, Inc., an automated solutions provider, offers with vision guided technology into the vehicles that can navigate their way through a warehouse without infrastructure modification. The vision technology allows VGVs to build a 3D map through a series of images taken when an operator tours the vehicle through the warehouse. Furthermore, these technologies can be integrated with different types of trucks such as side loader, counterbalance forklift, telehandler, rough terrain forklift, pallet jack, walkie stacker, order picker, reach fork truck and others. Telehandler accounted for the highest share in the autonomous forklifts market in 2018, owing to its easy forward and backward movements of loads without moving their base. Telehandler can be fitted with multiple attachments meanwhile, and can carry out specific tasks acting as a mini-crane. Moreover, the larger wheelbases and bodies on telehandlers are able to maneuver effectively on slippery and uneven surfaces, making them much more suited to construction sites and outdoor areas. Forklifts are ideal for outdoor construction having rough terrain, providing stability and better maneuverability. Furthermore, the growing need for smart factories with multi-robot systems (MRS) that are interconnected, cooperative, and interactive with virtual elements to enhance the productivity of organization is anticipated to propel the autonomous forklifts market in the forecast period.
The autonomous forklifts market is expected to gain momentum in the Asia Pacific region over the forecast period. Technological advancements in the transportation and construction industry with the growing demand for infrastructure development requiring lifting and shifting of materials is anticipated to propel the growth of the autonomous forklifts market in the region.
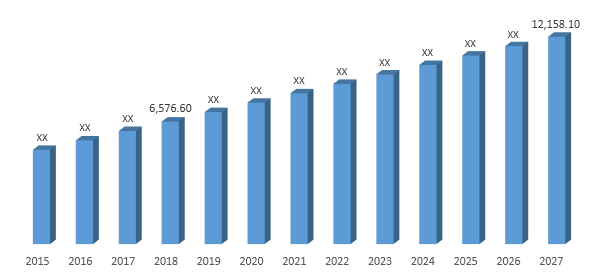
In terms of revenue, the global autonomous forklifts market was estimated to be US$ 6,576.60 Mn in 2018 and is expected to reach US$ 12,158.10 Mn by 2027 growing at a CAGR of 7.14% over the forecast period. The study analyzes the market in terms of revenue across all the major regions, which is further bifurcated into countries.
Global Autonomous Forklifts Market Revenue & Forecast, (US$ Million), 2015 – 2027
Competitive Landscape
The report provides both, qualitative and quantitative research of autonomous forklifts market, as well as provides comprehensive insights and development methods adopted by the key contenders. The report also offers extensive research on the key players in this market and details on the competitiveness of these players. Key business strategies such as mergers and acquisitions (M&A), affiliations, collaborations, and contracts adopted by these major market participants are also recognized and analyzed in the report. For each company, the report studies their global presence, competitors, service offerings and specification amongst others.
Some of the players operating in the autonomous forklifts market are AB Volvo, Anhui Heli Co., Ltd. , BALYO, Crown Equipment Corporation, Dematic, Doosan Industrial Vehicle America Corp, Gen Surv Robotics, Godrej Material Handling , Hyundai Construction Equipment Co., Ltd., Jungheinrich AG, Kollmorgen, Linde Material Handling, Mitsubishi Caterpillar Forklift America Inc., Nichiyu Forklift, Northland Industrial Truck Company, Inc. , Scott, Seegrid Corporation, Swisslog Holding AG, TOYOTA INDUSTRIES CORPORATION, UniCarriers Americas Corporation, among others.

Global Autonomous Forklifts Market:
- By Type
- Indoor
- Outdoor
- By Fuel Source
- Electric
- CNG
- Petrol and Diesel
- Fuel Cells
- By Technology
- Line Guided
- Laser Guided
- Vision Guided (3D)
- Others
- By Industry
- Pharmaceutical
- Chemical
- Manufacturing
- Automotive
- Paper and Print
- Food and Beverage
- Others
- By Truck Type
- Side Loader
- Counterbalance Forklift
- Telehandler
- Rough Terrain Forklift
- Pallet Jack
- Walkie Stacker
- Order Picker
- Reach Fork Truck
- Others
- By Channel
- OEM
- Aftermarket
- By Capacity
- Less than 1000
- 1000-2000
- 2000-5000
- Above 5000
- By Region
- North America
- U.S
- Canada
- Mexico
- Rest of North America
- Europe
- France
- The UK
- Spain
- Germany
- Italy
- Nordic Countries
- Denmark
- Finland
- Iceland
- Sweden
- Norway
- Benelux Union
- Belgium
- The Netherlands
- Luxembourg
- Rest of Europe
- Asia Pacific
- China
- Japan
- India
- New Zealand
- Australia
- South Korea
- Southeast Asia
- Indonesia
- Thailand
- Malaysia
- Singapore
- Rest of Southeast Asia
- Rest of Asia Pacific
- Middle East and Africa
- Saudi Arabia
- UAE
- Egypt
- Kuwait
- South Africa
- Rest of Middle East & Africa
- Latin America
- Brazil
- Argentina
- Rest of Latin America
- North America
Table of Contents
![]()
1. Market
Scope
1.1. Market Segmentation
1.2. Years Considered
1.2.1. Historic Years: 2013 - 2017
1.2.2. Base Year: 2018
1.2.3. Forecast Years: 2019 – 2027
2. Key
Target Audiences
3. Research
Methodology
3.1. Primary Research
3.1.1. Research Questionnaire
3.1.2. Global Percentage Breakdown
3.1.3. Primary Interviews: Key Opinion Leaders (KOLs)
3.2. Secondary Research
3.2.1. Paid Databases
3.2.2. Secondary Sources
3.3. Market Size Estimates
3.3.1. Top-Down Approach
3.3.2. Bottom-Up Approach
3.4. Data Triangulation Methodology
3.5. Research Assumptions
4. Recommendations
and Insights from AMI’s Perspective**
5. Holistic
Overview of Autonomous Forklifts Market
6. Market
Synopsis: Autonomous Forklifts Market
7. Autonomous
Forklifts Market Analysis: Qualitative Perspective
7.1. Introduction
7.1.1. Product Definition
7.1.2. Industry Development
7.2. Market Dynamics
7.2.1. Drivers
7.2.2. Restraints
7.2.3. Opportunities
7.3. Trends in Autonomous Forklifts Market
7.4. Market Determinants Radar Chart
7.5. Macro-Economic and Micro-Economic Indicators: Autonomous
Forklifts Market
7.6. Porter’s Five Force Analysis
8. Global
Autonomous Forklifts Market Analysis and Forecasts, 2019 – 2027
8.1. Overview
8.1.1. Global Autonomous Forklifts Market Revenue (US$ Mn)
8.2. Global Autonomous Forklifts Market Revenue (US$ Mn) and
Forecasts, By Type
8.2.1. Indoor
8.2.1.1. Definition
8.2.1.2. Market Estimation and Penetration, 2013 – 2018
8.2.1.3. Market Forecast, 2019 – 2027
8.2.1.4. Compound Annual Growth Rate (CAGR)
8.2.1.5. Regional Bifurcation
8.2.1.5.1. North America
8.2.1.5.1.1. Market Estimation, 2013 – 2018
8.2.1.5.1.2. Market Forecast, 2019 – 2027
8.2.1.5.2. Europe
8.2.1.5.2.1. Market Estimation, 2013 – 2018
8.2.1.5.2.2. Market Forecast, 2019 – 2027
8.2.1.5.3. Asia Pacific
8.2.1.5.3.1. Market Estimation, 2013 – 2018
8.2.1.5.3.2. Market Forecast, 2019 – 2027
8.2.1.5.4. Middle East and Africa
8.2.1.5.4.1. Market Estimation, 2013 – 2018
8.2.1.5.4.2. Market Forecast, 2019 – 2027
8.2.1.5.5. Latin America
8.2.1.5.5.1. Market Estimation, 2013 – 2018
8.2.1.5.5.2. Market Forecast, 2019 – 2027
8.2.2. Outdoor
8.2.2.1. Definition
8.2.2.2. Market Estimation and Penetration, 2013 – 2018
8.2.2.3. Market Forecast, 2019 – 2027
8.2.2.4. Compound Annual Growth Rate (CAGR)
8.2.2.5. Regional Bifurcation
8.2.2.5.1. North America
8.2.2.5.1.1. Market Estimation, 2013 – 2018
8.2.2.5.1.2. Market Forecast, 2019 – 2027
8.2.2.5.2. Europe
8.2.2.5.2.1. Market Estimation, 2013 – 2018
8.2.2.5.2.2. Market Forecast, 2019 – 2027
8.2.2.5.3. Asia Pacific
8.2.2.5.3.1. Market Estimation, 2013 – 2018
8.2.2.5.3.2. Market Forecast, 2019 – 2027
8.2.2.5.4. Middle East and Africa
8.2.2.5.4.1. Market Estimation, 2013 – 2018
8.2.2.5.4.2. Market Forecast, 2019 – 2027
8.2.2.5.5. Latin America
8.2.2.5.5.1. Market Estimation, 2013 – 2018
8.2.2.5.5.2. Market Forecast, 2019 – 2027
8.3. Key Segment for Channeling Investments
8.3.1. By Type
9. Global
Autonomous Forklifts Market Analysis and Forecasts, 2019 – 2027
9.1. Overview
9.2. Global Autonomous Forklifts Market Revenue (US$ Mn) and
Forecasts, By Fuel Source
9.2.1. Electric
9.2.1.1. Definition
9.2.1.2. Market Estimation and Penetration, 2013 – 2018
9.2.1.3. Market Forecast, 2019 – 2027
9.2.1.4. Compound Annual Growth Rate (CAGR)
9.2.1.5. Regional Bifurcation
9.2.1.5.1. North America
9.2.1.5.1.1. Market Estimation, 2013 – 2018
9.2.1.5.1.2. Market Forecast, 2019 – 2027
9.2.1.5.2. Europe
9.2.1.5.2.1. Market Estimation, 2013 – 2018
9.2.1.5.2.2. Market Forecast, 2019 – 2027
9.2.1.5.3. Asia Pacific
9.2.1.5.3.1. Market Estimation, 2013 – 2018
9.2.1.5.3.2. Market Forecast, 2019 – 2027
9.2.1.5.4. Middle East and Africa
9.2.1.5.4.1. Market Estimation, 2013 – 2018
9.2.1.5.4.2. Market Forecast, 2019 – 2027
9.2.1.5.5. Latin America
9.2.1.5.5.1. Market Estimation, 2013 – 2018
9.2.1.5.5.2. Market Forecast, 2019 – 2027
9.2.2. CNG
9.2.2.1. Definition
9.2.2.2. Market Estimation and Penetration, 2013 – 2018
9.2.2.3. Market Forecast, 2019 – 2027
9.2.2.4. Compound Annual Growth Rate (CAGR)
9.2.2.5. Regional Bifurcation
9.2.2.5.1. North America
9.2.2.5.1.1. Market Estimation, 2013 – 2018
9.2.2.5.1.2. Market Forecast, 2019 – 2027
9.2.2.5.2. Europe
9.2.2.5.2.1. Market Estimation, 2013 – 2018
9.2.2.5.2.2. Market Forecast, 2019 – 2027
9.2.2.5.3. Asia Pacific
9.2.2.5.3.1. Market Estimation, 2013 – 2018
9.2.2.5.3.2. Market Forecast, 2019 – 2027
9.2.2.5.4. Middle East and Africa
9.2.2.5.4.1. Market Estimation, 2013 – 2018
9.2.2.5.4.2. Market Forecast, 2019 – 2027
9.2.2.5.5. Latin America
9.2.2.5.5.1. Market Estimation, 2013 – 2018
9.2.2.5.5.2. Market Forecast, 2019 – 2027
9.2.3. Petrol and Diesel
9.2.3.1. Definition
9.2.3.2. Market Estimation and Penetration, 2013 – 2018
9.2.3.3. Market Forecast, 2019 – 2027
9.2.3.4. Compound Annual Growth Rate (CAGR)
9.2.3.5. Regional Bifurcation
9.2.3.5.1. North America
9.2.3.5.1.1. Market Estimation, 2013 – 2018
9.2.3.5.1.2. Market Forecast, 2019 – 2027
9.2.3.5.2. Europe
9.2.3.5.2.1. Market Estimation, 2013 – 2018
9.2.3.5.2.2. Market Forecast, 2019 – 2027
9.2.3.5.3. Asia Pacific
9.2.3.5.3.1. Market Estimation, 2013 – 2018
9.2.3.5.3.2. Market Forecast, 2019 – 2027
9.2.3.5.4. Middle East and Africa
9.2.3.5.4.1. Market Estimation, 2013 – 2018
9.2.3.5.4.2. Market Forecast, 2019 – 2027
9.2.3.5.5. Latin America
9.2.3.5.5.1. Market Estimation, 2013 – 2018
9.2.3.5.5.2. Market Forecast, 2019 – 2027
9.2.4. Fuel Cells
9.2.4.1. Definition
9.2.4.2. Market Estimation and Penetration, 2013 – 2018
9.2.4.3. Market Forecast, 2019 – 2027
9.2.4.4. Compound Annual Growth Rate (CAGR)
9.2.4.5. Regional Bifurcation
9.2.4.5.1. North America
9.2.4.5.1.1. Market Estimation, 2013 – 2018
9.2.4.5.1.2. Market Forecast, 2019 – 2027
9.2.4.5.2. Europe
9.2.4.5.2.1. Market Estimation, 2013 – 2018
9.2.4.5.2.2. Market Forecast, 2019 – 2027
9.2.4.5.3. Asia Pacific
9.2.4.5.3.1. Market Estimation, 2013 – 2018
9.2.4.5.3.2. Market Forecast, 2019 – 2027
9.2.4.5.4. Middle East and Africa
9.2.4.5.4.1. Market Estimation, 2013 – 2018
9.2.4.5.4.2. Market Forecast, 2019 – 2027
9.2.4.5.5. Latin America
9.2.4.5.5.1. Market Estimation, 2013 – 2018
9.2.4.5.5.2. Market Forecast, 2019 – 2027
9.3. Key Segment for Channeling Investments
9.3.1. By Fuel Source
10. Global
Autonomous Forklifts Market Analysis and Forecasts, 2019 – 2027
10.1. Overview
10.2. Global Autonomous Forklifts Market Revenue (US$ Mn) and
Forecasts, By Technology
10.2.1. Line Guided
10.2.1.1. Definition
10.2.1.2. Market Estimation and Penetration, 2013 – 2018
10.2.1.3. Market Forecast, 2019 – 2027
10.2.1.4. Compound Annual Growth Rate (CAGR)
10.2.1.5. Regional Bifurcation
10.2.1.5.1. North America
10.2.1.5.1.1. Market Estimation, 2013 – 2018
10.2.1.5.1.2. Market Forecast, 2019 – 2027
10.2.1.5.2. Europe
10.2.1.5.2.1. Market Estimation, 2013 – 2018
10.2.1.5.2.2. Market Forecast, 2019 – 2027
10.2.1.5.3. Asia Pacific
10.2.1.5.3.1. Market Estimation, 2013 – 2018
10.2.1.5.3.2. Market Forecast, 2019 – 2027
10.2.1.5.4. Middle East and Africa
10.2.1.5.4.1. Market Estimation, 2013 – 2018
10.2.1.5.4.2. Market Forecast, 2019 – 2027
10.2.1.5.5. Latin America
10.2.1.5.5.1. Market Estimation, 2013 – 2018
10.2.1.5.5.2. Market Forecast, 2019 – 2027
10.2.2. Laser Guided
10.2.2.1. Definition
10.2.2.2. Market Estimation and Penetration, 2013 – 2018
10.2.2.3. Market Forecast, 2019 – 2027
10.2.2.4. Compound Annual Growth Rate (CAGR)
10.2.2.5. Regional Bifurcation
10.2.2.5.1. North America
10.2.2.5.1.1. Market Estimation, 2013 – 2018
10.2.2.5.1.2. Market Forecast, 2019 – 2027
10.2.2.5.2. Europe
10.2.2.5.2.1. Market Estimation, 2013 – 2018
10.2.2.5.2.2. Market Forecast, 2019 – 2027
10.2.2.5.3. Asia Pacific
10.2.2.5.3.1. Market Estimation, 2013 – 2018
10.2.2.5.3.2. Market Forecast, 2019 – 2027
10.2.2.5.4. Middle East and Africa
10.2.2.5.4.1. Market Estimation, 2013 – 2018
10.2.2.5.4.2. Market Forecast, 2019 – 2027
10.2.2.5.5. Latin America
10.2.2.5.5.1. Market Estimation, 2013 – 2018
10.2.2.5.5.2. Market Forecast, 2019 – 2027
10.2.3. Vision Guided (3D)
10.2.3.1. Definition
10.2.3.2. Market Estimation and Penetration, 2013 – 2018
10.2.3.3. Market Forecast, 2019 – 2027
10.2.3.4. Compound Annual Growth Rate (CAGR)
10.2.3.5. Regional Bifurcation
10.2.3.5.1. North America
10.2.3.5.1.1. Market Estimation, 2013 – 2018
10.2.3.5.1.2. Market Forecast, 2019 – 2027
10.2.3.5.2. Europe
10.2.3.5.2.1. Market Estimation, 2013 – 2018
10.2.3.5.2.2. Market Forecast, 2019 – 2027
10.2.3.5.3. Asia Pacific
10.2.3.5.3.1. Market Estimation, 2013 – 2018
10.2.3.5.3.2. Market Forecast, 2019 – 2027
10.2.3.5.4. Middle East and Africa
10.2.3.5.4.1. Market Estimation, 2013 – 2018
10.2.3.5.4.2. Market Forecast, 2019 – 2027
10.2.3.5.5. Latin America
10.2.3.5.5.1. Market Estimation, 2013 – 2018
10.2.3.5.5.2. Market Forecast, 2019 – 2027
10.2.4. Others
10.2.4.1. Definition
10.2.4.2. Market Estimation and Penetration, 2013 – 2018
10.2.4.3. Market Forecast, 2019 – 2027
10.2.4.4. Compound Annual Growth Rate (CAGR)
10.2.4.5. Regional Bifurcation
10.2.4.5.1. North America
10.2.4.5.1.1. Market Estimation, 2013 – 2018
10.2.4.5.1.2. Market Forecast, 2019 – 2027
10.2.4.5.2. Europe
10.2.4.5.2.1. Market Estimation, 2013 – 2018
10.2.4.5.2.2. Market Forecast, 2019 – 2027
10.2.4.5.3. Asia Pacific
10.2.4.5.3.1. Market Estimation, 2013 – 2018
10.2.4.5.3.2. Market Forecast, 2019 – 2027
10.2.4.5.4. Middle East and Africa
10.2.4.5.4.1. Market Estimation, 2013 – 2018
10.2.4.5.4.2. Market Forecast, 2019 – 2027
10.2.4.5.5. Latin America
10.2.4.5.5.1. Market Estimation, 2013 – 2018
10.2.4.5.5.2. Market Forecast, 2019 – 2027
10.3. Key Segment for Channeling Investments
10.3.1. By Technology
11. Global
Autonomous Forklifts Market Analysis and Forecasts, 2019 – 2027
11.1. Overview
11.2. Global Autonomous Forklifts Market Revenue (US$ Mn) and
Forecasts, By Industry
11.2.1. Pharmaceutical
11.2.1.1. Definition
11.2.1.2. Market Estimation and Penetration, 2013 – 2018
11.2.1.3. Market Forecast, 2019 – 2027
11.2.1.4. Compound Annual Growth Rate (CAGR)
11.2.1.5. Regional Bifurcation
11.2.1.5.1. North America
11.2.1.5.1.1. Market Estimation, 2013 – 2018
11.2.1.5.1.2. Market Forecast, 2019 – 2027
11.2.1.5.2. Europe
11.2.1.5.2.1. Market Estimation, 2013 – 2018
11.2.1.5.2.2. Market Forecast, 2019 – 2027
11.2.1.5.3. Asia Pacific
11.2.1.5.3.1. Market Estimation, 2013 – 2018
11.2.1.5.3.2. Market Forecast, 2019 – 2027
11.2.1.5.4. Middle East and Africa
11.2.1.5.4.1. Market Estimation, 2013 – 2018
11.2.1.5.4.2. Market Forecast, 2019 – 2027
11.2.1.5.5. Latin America
11.2.1.5.5.1. Market Estimation, 2013 – 2018
11.2.1.5.5.2. Market Forecast, 2019 – 2027
11.2.2. Chemical
11.2.2.1. Definition
11.2.2.2. Market Estimation and Penetration, 2013 – 2018
11.2.2.3. Market Forecast, 2019 – 2027
11.2.2.4. Compound Annual Growth Rate (CAGR)
11.2.2.5. Regional Bifurcation
11.2.2.5.1. North America
11.2.2.5.1.1. Market Estimation, 2013 – 2018
11.2.2.5.1.2. Market Forecast, 2019 – 2027
11.2.2.5.2. Europe
11.2.2.5.2.1. Market Estimation, 2013 – 2018
11.2.2.5.2.2. Market Forecast, 2019 – 2027
11.2.2.5.3. Asia Pacific
11.2.2.5.3.1. Market Estimation, 2013 – 2018
11.2.2.5.3.2. Market Forecast, 2019 – 2027
11.2.2.5.4. Middle East and Africa
11.2.2.5.4.1. Market Estimation, 2013 – 2018
11.2.2.5.4.2. Market Forecast, 2019 – 2027
11.2.2.5.5. Latin America
11.2.2.5.5.1. Market Estimation, 2013 – 2018
11.2.2.5.5.2. Market Forecast, 2019 – 2027
11.2.3. Manufacturing
11.2.3.1. Definition
11.2.3.2. Market Estimation and Penetration, 2013 – 2018
11.2.3.3. Market Forecast, 2019 – 2027
11.2.3.4. Compound Annual Growth Rate (CAGR)
11.2.3.5. Regional Bifurcation
11.2.3.5.1. North America
11.2.3.5.1.1. Market Estimation, 2013 – 2018
11.2.3.5.1.2. Market Forecast, 2019 – 2027
11.2.3.5.2. Europe
11.2.3.5.2.1. Market Estimation, 2013 – 2018
11.2.3.5.2.2. Market Forecast, 2019 – 2027
11.2.3.5.3. Asia Pacific
11.2.3.5.3.1. Market Estimation, 2013 – 2018
11.2.3.5.3.2. Market Forecast, 2019 – 2027
11.2.3.5.4. Middle East and Africa
11.2.3.5.4.1. Market Estimation, 2013 – 2018
11.2.3.5.4.2. Market Forecast, 2019 – 2027
11.2.3.5.5. Latin America
11.2.3.5.5.1. Market Estimation, 2013 – 2018
11.2.3.5.5.2. Market Forecast, 2019 – 2027
11.2.4. Automotive
11.2.4.1. Definition
11.2.4.2. Market Estimation and Penetration, 2013 – 2018
11.2.4.3. Market Forecast, 2019 – 2027
11.2.4.4. Compound Annual Growth Rate (CAGR)
11.2.4.5. Regional Bifurcation
11.2.4.5.1. North America
11.2.4.5.1.1. Market Estimation, 2013 – 2018
11.2.4.5.1.2. Market Forecast, 2019 – 2027
11.2.4.5.2. Europe
11.2.4.5.2.1. Market Estimation, 2013 – 2018
11.2.4.5.2.2. Market Forecast, 2019 – 2027
11.2.4.5.3. Asia Pacific
11.2.4.5.3.1. Market Estimation, 2013 – 2018
11.2.4.5.3.2. Market Forecast, 2019 – 2027
11.2.4.5.4. Middle East and Africa
11.2.4.5.4.1. Market Estimation, 2013 – 2018
11.2.4.5.4.2. Market Forecast, 2019 – 2027
11.2.4.5.5. Latin America
11.2.4.5.5.1. Market Estimation, 2013 – 2018
11.2.4.5.5.2. Market Forecast, 2019 – 2027
11.2.5. Paper and Print
11.2.5.1. Definition
11.2.5.2. Market Estimation and Penetration, 2013 – 2018
11.2.5.3. Market Forecast, 2019 – 2027
11.2.5.4. Compound Annual Growth Rate (CAGR)
11.2.5.5. Regional Bifurcation
11.2.5.5.1. North America
11.2.5.5.1.1. Market Estimation, 2013 – 2018
11.2.5.5.1.2. Market Forecast, 2019 – 2027
11.2.5.5.2. Europe
11.2.5.5.2.1. Market Estimation, 2013 – 2018
11.2.5.5.2.2. Market Forecast, 2019 – 2027
11.2.5.5.3. Asia Pacific
11.2.5.5.3.1. Market Estimation, 2013 – 2018
11.2.5.5.3.2. Market Forecast, 2019 – 2027
11.2.5.5.4. Middle East and Africa
11.2.5.5.4.1. Market Estimation, 2013 – 2018
11.2.5.5.4.2. Market Forecast, 2019 – 2027
11.2.5.5.5. Latin America
11.2.5.5.5.1. Market Estimation, 2013 – 2018
11.2.5.5.5.2. Market Forecast, 2019 – 2027
11.2.6. Food and Beverage
11.2.6.1. Definition
11.2.6.2. Market Estimation and Penetration, 2013 – 2018
11.2.6.3. Market Forecast, 2019 – 2027
11.2.6.4. Compound Annual Growth Rate (CAGR)
11.2.6.5. Regional Bifurcation
11.2.6.5.1. North America
11.2.6.5.1.1. Market Estimation, 2013 – 2018
11.2.6.5.1.2. Market Forecast, 2019 – 2027
11.2.6.5.2. Europe
11.2.6.5.2.1. Market Estimation, 2013 – 2018
11.2.6.5.2.2. Market Forecast, 2019 – 2027
11.2.6.5.3. Asia Pacific
11.2.6.5.3.1. Market Estimation, 2013 – 2018
11.2.6.5.3.2. Market Forecast, 2019 – 2027
11.2.6.5.4. Middle East and Africa
11.2.6.5.4.1. Market Estimation, 2013 – 2018
11.2.6.5.4.2. Market Forecast, 2019 – 2027
11.2.6.5.5. Latin America
11.2.6.5.5.1. Market Estimation, 2013 – 2018
11.2.6.5.5.2. Market Forecast, 2019 – 2027
11.2.7. Others
11.2.7.1. Definition
11.2.7.2. Market Estimation and Penetration, 2013 – 2018
11.2.7.3. Market Forecast, 2019 – 2027
11.2.7.4. Compound Annual Growth Rate (CAGR)
11.2.7.5. Regional Bifurcation
11.2.7.5.1. North America
11.2.7.5.1.1. Market Estimation, 2013 – 2018
11.2.7.5.1.2. Market Forecast, 2019 – 2027
11.2.7.5.2. Europe
11.2.7.5.2.1. Market Estimation, 2013 – 2018
11.2.7.5.2.2. Market Forecast, 2019 – 2027
11.2.7.5.3. Asia Pacific
11.2.7.5.3.1. Market Estimation, 2013 – 2018
11.2.7.5.3.2. Market Forecast, 2019 – 2027
11.2.7.5.4. Middle East and Africa
11.2.7.5.4.1. Market Estimation, 2013 – 2018
11.2.7.5.4.2. Market Forecast, 2019 – 2027
11.2.7.5.5. Latin America
11.2.7.5.5.1. Market Estimation, 2013 – 2018
11.2.7.5.5.2. Market Forecast, 2019 – 2027
11.3. Key Segment for Channeling Investments
11.3.1. By Industry
12. Global
Autonomous Forklifts Market Analysis and Forecasts, 2019 – 2027
12.1. Overview
12.2. Global Autonomous Forklifts Market Revenue (US$ Mn) and
Forecasts, By Truck Type
12.2.1. Side Loader
12.2.1.1. Definition
12.2.1.2. Market Estimation and Penetration, 2013 – 2018
12.2.1.3. Market Forecast, 2019 – 2027
12.2.1.4. Compound Annual Growth Rate (CAGR)
12.2.1.5. Regional Bifurcation
12.2.1.5.1. North America
12.2.1.5.1.1. Market Estimation, 2013 – 2018
12.2.1.5.1.2. Market Forecast, 2019 – 2027
12.2.1.5.2. Europe
12.2.1.5.2.1. Market Estimation, 2013 – 2018
12.2.1.5.2.2. Market Forecast, 2019 – 2027
12.2.1.5.3. Asia Pacific
12.2.1.5.3.1. Market Estimation, 2013 – 2018
12.2.1.5.3.2. Market Forecast, 2019 – 2027
12.2.1.5.4. Middle East and Africa
12.2.1.5.4.1. Market Estimation, 2013 – 2018
12.2.1.5.4.2. Market Forecast, 2019 – 2027
12.2.1.5.5. Latin America
12.2.1.5.5.1. Market Estimation, 2013 – 2018
12.2.1.5.5.2. Market Forecast, 2019 – 2027
12.2.2. Counterbalance Forklift
12.2.2.1. Definition
12.2.2.2. Market Estimation and Penetration, 2013 – 2018
12.2.2.3. Market Forecast, 2019 – 2027
12.2.2.4. Compound Annual Growth Rate (CAGR)
12.2.2.5. Regional Bifurcation
12.2.2.5.1. North America
12.2.2.5.1.1. Market Estimation, 2013 – 2018
12.2.2.5.1.2. Market Forecast, 2019 – 2027
12.2.2.5.2. Europe
12.2.2.5.2.1. Market Estimation, 2013 – 2018
12.2.2.5.2.2. Market Forecast, 2019 – 2027
12.2.2.5.3. Asia Pacific
12.2.2.5.3.1. Market Estimation, 2013 – 2018
12.2.2.5.3.2. Market Forecast, 2019 – 2027
12.2.2.5.4. Middle East and Africa
12.2.2.5.4.1. Market Estimation, 2013 – 2018
12.2.2.5.4.2. Market Forecast, 2019 – 2027
12.2.2.5.5. Latin America
12.2.2.5.5.1. Market Estimation, 2013 – 2018
12.2.2.5.5.2. Market Forecast, 2019 – 2027
12.2.3. Telehandler
12.2.3.1. Definition
12.2.3.2. Market Estimation and Penetration, 2013 – 2018
12.2.3.3. Market Forecast, 2019 – 2027
12.2.3.4. Compound Annual Growth Rate (CAGR)
12.2.3.5. Regional Bifurcation
12.2.3.5.1. North America
12.2.3.5.1.1. Market Estimation, 2013 – 2018
12.2.3.5.1.2. Market Forecast, 2019 – 2027
12.2.3.5.2. Europe
12.2.3.5.2.1. Market Estimation, 2013 – 2018
12.2.3.5.2.2. Market Forecast, 2019 – 2027
12.2.3.5.3. Asia Pacific
12.2.3.5.3.1. Market Estimation, 2013 – 2018
12.2.3.5.3.2. Market Forecast, 2019 – 2027
12.2.3.5.4. Middle East and Africa
12.2.3.5.4.1. Market Estimation, 2013 – 2018
12.2.3.5.4.2. Market Forecast, 2019 – 2027
12.2.3.5.5. Latin America
12.2.3.5.5.1. Market Estimation, 2013 – 2018
12.2.3.5.5.2. Market Forecast, 2019 – 2027
12.2.4. Rough Terrain Forklift
12.2.4.1. Definition
12.2.4.2. Market Estimation and Penetration, 2013 – 2018
12.2.4.3. Market Forecast, 2019 – 2027
12.2.4.4. Compound Annual Growth Rate (CAGR)
12.2.4.5. Regional Bifurcation
12.2.4.5.1. North America
12.2.4.5.1.1. Market Estimation, 2013 – 2018
12.2.4.5.1.2. Market Forecast, 2019 – 2027
12.2.4.5.2. Europe
12.2.4.5.2.1. Market Estimation, 2013 – 2018
12.2.4.5.2.2. Market Forecast, 2019 – 2027
12.2.4.5.3. Asia Pacific
12.2.4.5.3.1. Market Estimation, 2013 – 2018
12.2.4.5.3.2. Market Forecast, 2019 – 2027
12.2.4.5.4. Middle East and Africa
12.2.4.5.4.1. Market Estimation, 2013 – 2018
12.2.4.5.4.2. Market Forecast, 2019 – 2027
12.2.4.5.5. Latin America
12.2.4.5.5.1. Market Estimation, 2013 – 2018
12.2.4.5.5.2. Market Forecast, 2019 – 2027
12.2.5. Pallet Jack
12.2.5.1. Definition
12.2.5.2. Market Estimation and Penetration, 2013 – 2018
12.2.5.3. Market Forecast, 2019 – 2027
12.2.5.4. Compound Annual Growth Rate (CAGR)
12.2.5.5. Regional Bifurcation
12.2.5.5.1. North America
12.2.5.5.1.1. Market Estimation, 2013 – 2018
12.2.5.5.1.2. Market Forecast, 2019 – 2027
12.2.5.5.2. Europe
12.2.5.5.2.1. Market Estimation, 2013 – 2018
12.2.5.5.2.2. Market Forecast, 2019 – 2027
12.2.5.5.3. Asia Pacific
12.2.5.5.3.1. Market Estimation, 2013 – 2018
12.2.5.5.3.2. Market Forecast, 2019 – 2027
12.2.5.5.4. Middle East and Africa
12.2.5.5.4.1. Market Estimation, 2013 – 2018
12.2.5.5.4.2. Market Forecast, 2019 – 2027
12.2.5.5.5. Latin America
12.2.5.5.5.1. Market Estimation, 2013 – 2018
12.2.5.5.5.2. Market Forecast, 2019 – 2027
12.2.6. Walkie Stacker
12.2.6.1. Definition
12.2.6.2. Market Estimation and Penetration, 2013 – 2018
12.2.6.3. Market Forecast, 2019 – 2027
12.2.6.4. Compound Annual Growth Rate (CAGR)
12.2.6.5. Regional Bifurcation
12.2.6.5.1. North America
12.2.6.5.1.1. Market Estimation, 2013 – 2018
12.2.6.5.1.2. Market Forecast, 2019 – 2027
12.2.6.5.2. Europe
12.2.6.5.2.1. Market Estimation, 2013 – 2018
12.2.6.5.2.2. Market Forecast, 2019 – 2027
12.2.6.5.3. Asia Pacific
12.2.6.5.3.1. Market Estimation, 2013 – 2018
12.2.6.5.3.2. Market Forecast, 2019 – 2027
12.2.6.5.4. Middle East and Africa
12.2.6.5.4.1. Market Estimation, 2013 – 2018
12.2.6.5.4.2. Market Forecast, 2019 – 2027
12.2.6.5.5. Latin America
12.2.6.5.5.1. Market Estimation, 2013 – 2018
12.2.6.5.5.2. Market Forecast, 2019 – 2027
12.2.7. Order Picker
12.2.7.1. Definition
12.2.7.2. Market Estimation and Penetration, 2013 – 2018
12.2.7.3. Market Forecast, 2019 – 2027
12.2.7.4. Compound Annual Growth Rate (CAGR)
12.2.7.5. Regional Bifurcation
12.2.7.5.1. North America
12.2.7.5.1.1. Market Estimation, 2013 – 2018
12.2.7.5.1.2. Market Forecast, 2019 – 2027
12.2.7.5.2. Europe
12.2.7.5.2.1. Market Estimation, 2013 – 2018
12.2.7.5.2.2. Market Forecast, 2019 – 2027
12.2.7.5.3. Asia Pacific
12.2.7.5.3.1. Market Estimation, 2013 – 2018
12.2.7.5.3.2. Market Forecast, 2019 – 2027
12.2.7.5.4. Middle East and Africa
12.2.7.5.4.1. Market Estimation, 2013 – 2018
12.2.7.5.4.2. Market Forecast, 2019 – 2027
12.2.7.5.5. Latin America
12.2.7.5.5.1. Market Estimation, 2013 – 2018
12.2.7.5.5.2. Market Forecast, 2019 – 2027
12.2.8. Reach Fork Truck
12.2.8.1. Definition
12.2.8.2. Market Estimation and Penetration, 2013 – 2018
12.2.8.3. Market Forecast, 2019 – 2027
12.2.8.4. Compound Annual Growth Rate (CAGR)
12.2.8.5. Regional Bifurcation
12.2.8.5.1. North America
12.2.8.5.1.1. Market Estimation, 2013 – 2018
12.2.8.5.1.2. Market Forecast, 2019 – 2027
12.2.8.5.2. Europe
12.2.8.5.2.1. Market Estimation, 2013 – 2018
12.2.8.5.2.2. Market Forecast, 2019 – 2027
12.2.8.5.3. Asia Pacific
12.2.8.5.3.1. Market Estimation, 2013 – 2018
12.2.8.5.3.2. Market Forecast, 2019 – 2027
12.2.8.5.4. Middle East and Africa
12.2.8.5.4.1. Market Estimation, 2013 – 2018
12.2.8.5.4.2. Market Forecast, 2019 – 2027
12.2.8.5.5. Latin America
12.2.8.5.5.1. Market Estimation, 2013 – 2018
12.2.8.5.5.2. Market Forecast, 2019 – 2027
12.2.9. Others
12.2.9.1. Definition
12.2.9.2. Market Estimation and Penetration, 2013 – 2018
12.2.9.3. Market Forecast, 2019 – 2027
12.2.9.4. Compound Annual Growth Rate (CAGR)
12.2.9.5. Regional Bifurcation
12.2.9.5.1. North America
12.2.9.5.1.1. Market Estimation, 2013 – 2018
12.2.9.5.1.2. Market Forecast, 2019 – 2027
12.2.9.5.2. Europe
12.2.9.5.2.1. Market Estimation, 2013 – 2018
12.2.9.5.2.2. Market Forecast, 2019 – 2027
12.2.9.5.3. Asia Pacific
12.2.9.5.3.1. Market Estimation, 2013 – 2018
12.2.9.5.3.2. Market Forecast, 2019 – 2027
12.2.9.5.4. Middle East and Africa
12.2.9.5.4.1. Market Estimation, 2013 – 2018
12.2.9.5.4.2. Market Forecast, 2019 – 2027
12.2.9.5.5. Latin America
12.2.9.5.5.1. Market Estimation, 2013 – 2018
12.2.9.5.5.2. Market Forecast, 2019 – 2027
12.3. Key Segment for Channeling Investments
12.3.1. By Truck Type
13. Global
Autonomous Forklifts Market Analysis and Forecasts, 2019 – 2027
13.1. Overview
13.2. Global Autonomous Forklifts Market Revenue (US$ Mn) and
Forecasts, By Channel
13.2.1. OEM
13.2.1.1. Definition
13.2.1.2. Market Estimation and Penetration, 2013 – 2018
13.2.1.3. Market Forecast, 2019 – 2027
13.2.1.4. Compound Annual Growth Rate (CAGR)
13.2.1.5. Regional Bifurcation
13.2.1.5.1. North America
13.2.1.5.1.1. Market Estimation, 2013 – 2018
13.2.1.5.1.2. Market Forecast, 2019 – 2027
13.2.1.5.2. Europe
13.2.1.5.2.1. Market Estimation, 2013 – 2018
13.2.1.5.2.2. Market Forecast, 2019 – 2027
13.2.1.5.3. Asia Pacific
13.2.1.5.3.1. Market Estimation, 2013 – 2018
13.2.1.5.3.2. Market Forecast, 2019 – 2027
13.2.1.5.4. Middle East and Africa
13.2.1.5.4.1. Market Estimation, 2013 – 2018
13.2.1.5.4.2. Market Forecast, 2019 – 2027
13.2.1.5.5. Latin America
13.2.1.5.5.1. Market Estimation, 2013 – 2018
13.2.1.5.5.2. Market Forecast, 2019 – 2027
13.2.2. Aftermarket
13.2.2.1. Definition
13.2.2.2. Market Estimation and Penetration, 2013 – 2018
13.2.2.3. Market Forecast, 2019 – 2027
13.2.2.4. Compound Annual Growth Rate (CAGR)
13.2.2.5. Regional Bifurcation
13.2.2.5.1. North America
13.2.2.5.1.1. Market Estimation, 2013 – 2018
13.2.2.5.1.2. Market Forecast, 2019 – 2027
13.2.2.5.2. Europe
13.2.2.5.2.1. Market Estimation, 2013 – 2018
13.2.2.5.2.2. Market Forecast, 2019 – 2027
13.2.2.5.3. Asia Pacific
13.2.2.5.3.1. Market Estimation, 2013 – 2018
13.2.2.5.3.2. Market Forecast, 2019 – 2027
13.2.2.5.4. Middle East and Africa
13.2.2.5.4.1. Market Estimation, 2013 – 2018
13.2.2.5.4.2. Market Forecast, 2019 – 2027
13.2.2.5.5. Latin America
13.2.2.5.5.1. Market Estimation, 2013 – 2018
13.2.2.5.5.2. Market Forecast, 2019 – 2027
13.3. Key Segment for Channeling Investments
13.3.1. By Channel
14. Global
Autonomous Forklifts Market Analysis and Forecasts, 2019 – 2027
14.1. Overview
14.2. Global Autonomous Forklifts Market Revenue (US$ Mn) and
Forecasts, By Capacity
14.2.1. Less than 1000
14.2.1.1. Definition
14.2.1.2. Market Estimation and Penetration, 2013 – 2018
14.2.1.3. Market Forecast, 2019 – 2027
14.2.1.4. Compound Annual Growth Rate (CAGR)
14.2.1.5. Regional Bifurcation
14.2.1.5.1. North America
14.2.1.5.1.1. Market Estimation, 2013 – 2018
14.2.1.5.1.2. Market Forecast, 2019 – 2027
14.2.1.5.2. Europe
14.2.1.5.2.1. Market Estimation, 2013 – 2018
14.2.1.5.2.2. Market Forecast, 2019 – 2027
14.2.1.5.3. Asia Pacific
14.2.1.5.3.1. Market Estimation, 2013 – 2018
14.2.1.5.3.2. Market Forecast, 2019 – 2027
14.2.1.5.4. Middle East and Africa
14.2.1.5.4.1. Market Estimation, 2013 – 2018
14.2.1.5.4.2. Market Forecast, 2019 – 2027
14.2.1.5.5. Latin America
14.2.1.5.5.1. Market Estimation, 2013 – 2018
14.2.1.5.5.2. Market Forecast, 2019 – 2027
14.2.2. 1000-2000
14.2.2.1. Definition
14.2.2.2. Market Estimation and Penetration, 2013 – 2018
14.2.2.3. Market Forecast, 2019 – 2027
14.2.2.4. Compound Annual Growth Rate (CAGR)
14.2.2.5. Regional Bifurcation
14.2.2.5.1. North America
14.2.2.5.1.1. Market Estimation, 2013 – 2018
14.2.2.5.1.2. Market Forecast, 2019 – 2027
14.2.2.5.2. Europe
14.2.2.5.2.1. Market Estimation, 2013 – 2018
14.2.2.5.2.2. Market Forecast, 2019 – 2027
14.2.2.5.3. Asia Pacific
14.2.2.5.3.1. Market Estimation, 2013 – 2018
14.2.2.5.3.2. Market Forecast, 2019 – 2027
14.2.2.5.4. Middle East and Africa
14.2.2.5.4.1. Market Estimation, 2013 – 2018
14.2.2.5.4.2. Market Forecast, 2019 – 2027
14.2.2.5.5. Latin America
14.2.2.5.5.1. Market Estimation, 2013 – 2018
14.2.2.5.5.2. Market Forecast, 2019 – 2027
14.2.3. 2000-5000
14.2.3.1. Definition
14.2.3.2. Market Estimation and Penetration, 2013 – 2018
14.2.3.3. Market Forecast, 2019 – 2027
14.2.3.4. Compound Annual Growth Rate (CAGR)
14.2.3.5. Regional Bifurcation
14.2.3.5.1. North America
14.2.3.5.1.1. Market Estimation, 2013 – 2018
14.2.3.5.1.2. Market Forecast, 2019 – 2027
14.2.3.5.2. Europe
14.2.3.5.2.1. Market Estimation, 2013 – 2018
14.2.3.5.2.2. Market Forecast, 2019 – 2027
14.2.3.5.3. Asia Pacific
14.2.3.5.3.1. Market Estimation, 2013 – 2018
14.2.3.5.3.2. Market Forecast, 2019 – 2027
14.2.3.5.4. Middle East and Africa
14.2.3.5.4.1. Market Estimation, 2013 – 2018
14.2.3.5.4.2. Market Forecast, 2019 – 2027
14.2.3.5.5. Latin America
14.2.3.5.5.1. Market Estimation, 2013 – 2018
14.2.3.5.5.2. Market Forecast, 2019 – 2027
14.2.4. Above 5000
14.2.4.1. Definition
14.2.4.2. Market Estimation and Penetration, 2013 – 2018
14.2.4.3. Market Forecast, 2019 – 2027
14.2.4.4. Compound Annual Growth Rate (CAGR)
14.2.4.5. Regional Bifurcation
14.2.4.5.1. North America
14.2.4.5.1.1. Market Estimation, 2013 – 2018
14.2.4.5.1.2. Market Forecast, 2019 – 2027
14.2.4.5.2. Europe
14.2.4.5.2.1. Market Estimation, 2013 – 2018
14.2.4.5.2.2. Market Forecast, 2019 – 2027
14.2.4.5.3. Asia Pacific
14.2.4.5.3.1. Market Estimation, 2013 – 2018
14.2.4.5.3.2. Market Forecast, 2019 – 2027
14.2.4.5.4. Middle East and Africa
14.2.4.5.4.1. Market Estimation, 2013 – 2018
14.2.4.5.4.2. Market Forecast, 2019 – 2027
14.2.4.5.5. Latin America
14.2.4.5.5.1. Market Estimation, 2013 – 2018
14.2.4.5.5.2. Market Forecast, 2019 – 2027
14.3. Key Segment for Channeling Investments
14.3.1. By Capacity
15. North
America Autonomous Forklifts Market Analysis and Forecasts, 2019 - 2027
15.1. Overview
15.1.1. North America Autonomous Forklifts Market Revenue (US$ Mn)
15.2. North America Autonomous Forklifts Market Revenue (US$ Mn) and
Forecasts, By Type
15.2.1. Indoor
15.2.2. Outdoor
15.3. North America Autonomous Forklifts Market Revenue (US$ Mn) and
Forecasts, By Fuel Source
15.3.1. Electric
15.3.2. CNG
15.3.3. Petrol and Diesel
15.3.4. Fuel Cells
15.4. North America Autonomous Forklifts Market Revenue (US$ Mn) and
Forecasts, By Technology
15.4.1. Line Guided
15.4.2. Laser Guided
15.4.3. Vision Guided (3D)
15.4.4. Others
15.5. North America Autonomous Forklifts Market Revenue (US$ Mn) and
Forecasts, By Industry
15.5.1. Pharmaceutical
15.5.2. Chemical
15.5.3. Manufacturing
15.5.4. Automotive
15.5.5. Paper and Print
15.5.6. Food and Beverage
15.5.7. Others
15.6. North America Autonomous Forklifts Market Revenue (US$ Mn) and
Forecasts, By Truck Type
15.6.1. Side Loader
15.6.2. Counterbalance Forklift
15.6.3. Telehandler
15.6.4. Rough Terrain Forklift
15.6.5. Pallet Jack
15.6.6. Walkie Stacker
15.6.7. Order Picker
15.6.8. Reach Fork Truck
15.6.9. Others
15.7. North America Autonomous Forklifts Market Revenue (US$ Mn) and
Forecasts, By Channel
15.7.1. OEM
15.7.2. Aftermarket
15.8. North America Autonomous Forklifts Market Revenue (US$ Mn) and
Forecasts, By Capacity
15.8.1. Less than 1000
15.8.2. 1000-2000
15.8.3. 2000-5000
15.8.4. Above 5000
15.9. North America Autonomous Forklifts Market Revenue (US$ Mn) and
Forecasts, By Country
15.9.1. U.S
15.9.1.1. U.S Autonomous Forklifts Market Revenue (US$ Mn) and
Forecasts, By Type
15.9.1.1.1. Indoor
15.9.1.1.2. Outdoor
15.9.1.2. U.S Autonomous Forklifts Market Revenue (US$ Mn) and
Forecasts, By Fuel Source
15.9.1.2.1. Electric
15.9.1.2.2. CNG
15.9.1.2.3. Petrol and Diesel
15.9.1.2.4. Fuel Cells
15.9.1.3. U.S Autonomous Forklifts Market Revenue (US$ Mn) and
Forecasts, By Technology
15.9.1.3.1. Line Guided
15.9.1.3.2. Laser Guided
15.9.1.3.3. Vision Guided (3D)
15.9.1.3.4. Others
15.9.1.4. U.S Autonomous Forklifts Market Revenue (US$ Mn) and
Forecasts, By Industry
15.9.1.4.1. Pharmaceutical
15.9.1.4.2. Chemical
15.9.1.4.3. Manufacturing
15.9.1.4.4. Automotive
15.9.1.4.5. Paper and Print
15.9.1.4.6. Food and Beverage
15.9.1.4.7. Others
15.9.1.5. U.S Autonomous Forklifts Market Revenue (US$ Mn) and
Forecasts, By Truck Type
15.9.1.5.1. Side Loader
15.9.1.5.2. Counterbalance Forklift
15.9.1.5.3. Telehandler
15.9.1.5.4. Rough Terrain Forklift
15.9.1.5.5. Pallet Jack
15.9.1.5.6. Walkie Stacker
15.9.1.5.7. Order Picker
15.9.1.5.8. Reach Fork Truck
15.9.1.5.9. Others
15.9.1.6. U.S Autonomous Forklifts Market Revenue (US$ Mn) and
Forecasts, By Channel
15.9.1.6.1. OEM
15.9.1.6.2. Aftermarket
15.9.1.7. U.S Autonomous Forklifts Market Revenue (US$ Mn) and
Forecasts, By Capacity
15.9.1.7.1. Less than 1000
15.9.1.7.2. 1000-2000
15.9.1.7.3. 2000-5000
15.9.1.7.4. Above 5000
15.9.2. Canada
15.9.2.1. Canada Autonomous Forklifts Market Revenue (US$ Mn) and
Forecasts, By Type
15.9.2.1.1. Indoor
15.9.2.1.2. Outdoor
15.9.2.2. Canada Autonomous Forklifts Market Revenue (US$ Mn) and
Forecasts, By Fuel Source
15.9.2.2.1. Electric
15.9.2.2.2. CNG
15.9.2.2.3. Petrol and Diesel
15.9.2.2.4. Fuel Cells
15.9.2.3. Canada Autonomous Forklifts Market Revenue (US$ Mn) and
Forecasts, By Technology
15.9.2.3.1. Line Guided
15.9.2.3.2. Laser Guided
15.9.2.3.3. Vision Guided (3D)
15.9.2.3.4. Others
15.9.2.4. Canada Autonomous Forklifts Market Revenue (US$ Mn) and
Forecasts, By Industry
15.9.2.4.1. Pharmaceutical
15.9.2.4.2. Chemical
15.9.2.4.3. Manufacturing
15.9.2.4.4. Automotive
15.9.2.4.5. Paper and Print
15.9.2.4.6. Food and Beverage
15.9.2.4.7. Others
15.9.2.5. Canada Autonomous Forklifts Market Revenue (US$ Mn) and
Forecasts, By Truck Type
15.9.2.5.1. Side Loader
15.9.2.5.2. Counterbalance Forklift
15.9.2.5.3. Telehandler
15.9.2.5.4. Rough Terrain Forklift
15.9.2.5.5. Pallet Jack
15.9.2.5.6. Walkie Stacker
15.9.2.5.7. Order Picker
15.9.2.5.8. Reach Fork Truck
15.9.2.5.9. Others
15.9.2.6. Canada Autonomous Forklifts Market Revenue (US$ Mn) and
Forecasts, By Channel
15.9.2.6.1. OEM
15.9.2.6.2. Aftermarket
15.9.2.7. Canada Autonomous Forklifts Market Revenue (US$ Mn) and
Forecasts, By Capacity
15.9.2.7.1. Less than 1000
15.9.2.7.2. 1000-2000
15.9.2.7.3. 2000-5000
15.9.2.7.4. Above 5000
15.9.3. Mexico
15.9.3.1. Mexico Autonomous Forklifts Market Revenue (US$ Mn) and
Forecasts, By Type
15.9.3.1.1. Indoor
15.9.3.1.2. Outdoor
15.9.3.2. Mexico Autonomous Forklifts Market Revenue (US$ Mn) and
Forecasts, By Fuel Source
15.9.3.2.1. Electric
15.9.3.2.2. CNG
15.9.3.2.3. Petrol and Diesel
15.9.3.2.4. Fuel Cells
15.9.3.3. Mexico Autonomous Forklifts Market Revenue (US$ Mn) and
Forecasts, By Technology
15.9.3.3.1. Line Guided
15.9.3.3.2. Laser Guided
15.9.3.3.3. Vision Guided (3D)
15.9.3.3.4. Others
15.9.3.4. Mexico Autonomous Forklifts Market Revenue (US$ Mn) and
Forecasts, By Industry
15.9.3.4.1. Pharmaceutical
15.9.3.4.2. Chemical
15.9.3.4.3. Manufacturing
15.9.3.4.4. Automotive
15.9.3.4.5. Paper and Print
15.9.3.4.6. Food and Beverage
15.9.3.4.7. Others
15.9.3.5. Mexico Autonomous Forklifts Market Revenue (US$ Mn) and
Forecasts, By Truck Type
15.9.3.5.1. Side Loader
15.9.3.5.2. Counterbalance Forklift
15.9.3.5.3. Telehandler
15.9.3.5.4. Rough Terrain Forklift
15.9.3.5.5. Pallet Jack
15.9.3.5.6. Walkie Stacker
15.9.3.5.7. Order Picker
15.9.3.5.8. Reach Fork Truck
15.9.3.5.9. Others
15.9.3.6. Mexico Autonomous Forklifts Market Revenue (US$ Mn) and
Forecasts, By Channel
15.9.3.6.1. OEM
15.9.3.6.2. Aftermarket
15.9.3.7. Mexico Autonomous Forklifts Market Revenue (US$ Mn) and
Forecasts, By Capacity
15.9.3.7.1. Less than 1000
15.9.3.7.2. 1000-2000
15.9.3.7.3. 2000-5000
15.9.3.7.4. Above 5000
15.9.4. Rest of North America
15.9.4.1. Rest of North America Autonomous Forklifts Market Revenue (US$
Mn) and Forecasts, By Type
15.9.4.1.1. Indoor
15.9.4.1.2. Outdoor
15.9.4.2. Rest of North America Autonomous Forklifts Market Revenue (US$
Mn) and Forecasts, By Fuel Source
15.9.4.2.1. Electric
15.9.4.2.2. CNG
15.9.4.2.3. Petrol and Diesel
15.9.4.2.4. Fuel Cells
15.9.4.3. Rest of North America Autonomous Forklifts Market Revenue (US$
Mn) and Forecasts, By Technology
15.9.4.3.1. Line Guided
15.9.4.3.2. Laser Guided
15.9.4.3.3. Vision Guided (3D)
15.9.4.3.4. Others
15.9.4.4. Rest of North America Autonomous Forklifts Market Revenue (US$
Mn) and Forecasts, By Industry
15.9.4.4.1. Pharmaceutical
15.9.4.4.2. Chemical
15.9.4.4.3. Manufacturing
15.9.4.4.4. Automotive
15.9.4.4.5. Paper and Print
15.9.4.4.6. Food and Beverage
15.9.4.4.7. Others
15.9.4.5. Rest of North America Autonomous Forklifts Market Revenue (US$
Mn) and Forecasts, By Truck Type
15.9.4.5.1. Side Loader
15.9.4.5.2. Counterbalance Forklift
15.9.4.5.3. Telehandler
15.9.4.5.4. Rough Terrain Forklift
15.9.4.5.5. Pallet Jack
15.9.4.5.6. Walkie Stacker
15.9.4.5.7. Order Picker
15.9.4.5.8. Reach Fork Truck
15.9.4.5.9. Others
15.9.4.6. Rest of North America Autonomous Forklifts Market Revenue (US$
Mn) and Forecasts, By Channel
15.9.4.6.1. OEM
15.9.4.6.2. Aftermarket
15.9.4.7. Rest of North America Autonomous Forklifts Market Revenue (US$
Mn) and Forecasts, By Capacity
15.9.4.7.1. Less than 1000
15.9.4.7.2. 1000-2000
15.9.4.7.3. 2000-5000
15.9.4.7.4. Above 5000
15.10. Key Segment for Channeling Investments
15.10.1. By Country
15.10.2. By Type
15.10.3. By Fuel Source
15.10.4. By Technology
15.10.5. By Industry
15.10.6. By Truck Type
15.10.7. By Channel
15.10.8. By Capacity
16. Europe
Autonomous Forklifts Market Analysis and Forecasts, 2019 - 2027
16.1. Overview
16.1.1. Europe Autonomous Forklifts Market Revenue (US$ Mn)
16.2. Europe Autonomous Forklifts Market Revenue (US$ Mn) and Forecasts,
By Type
16.2.1. Indoor
16.2.2. Outdoor
16.3. Europe Autonomous Forklifts Market Revenue (US$ Mn) and
Forecasts, By Fuel Source
16.3.1. Electric
16.3.2. CNG
16.3.3. Petrol and Diesel
16.3.4. Fuel Cells
16.4. Europe Autonomous Forklifts Market Revenue (US$ Mn) and
Forecasts, By Technology
16.4.1. Line Guided
16.4.2. Laser Guided
16.4.3. Vision Guided (3D)
16.4.4. Others
16.5. Europe Autonomous Forklifts Market Revenue (US$ Mn) and
Forecasts, By Industry
16.5.1. Pharmaceutical
16.5.2. Chemical
16.5.3. Manufacturing
16.5.4. Automotive
16.5.5. Paper and Print
16.5.6. Food and Beverage
16.5.7. Others
16.6. Europe Autonomous Forklifts Market Revenue (US$ Mn) and
Forecasts, By Truck Type
16.6.1. Side Loader
16.6.2. Counterbalance Forklift
16.6.3. Telehandler
16.6.4. Rough Terrain Forklift
16.6.5. Pallet Jack
16.6.6. Walkie Stacker
16.6.7. Order Picker
16.6.8. Reach Fork Truck
16.6.9. Others
16.7. Europe Autonomous Forklifts Market Revenue (US$ Mn) and
Forecasts, By Channel
16.7.1. OEM
16.7.2. Aftermarket
16.8. Europe Autonomous Forklifts Market Revenue (US$ Mn) and
Forecasts, By Capacity
16.8.1. Less than 1000
16.8.2. 1000-2000
16.8.3. 2000-5000
16.8.4. Above 5000
16.9. Europe Autonomous Forklifts Market Revenue (US$ Mn) and
Forecasts, By Country
16.9.1. France
16.9.1.1. France Autonomous Forklifts Market Revenue (US$ Mn) and
Forecasts, By Type
16.9.1.1.1. Indoor
16.9.1.1.2. Outdoor
16.9.1.2. France Autonomous Forklifts Market Revenue (US$ Mn) and
Forecasts, By Fuel Source
16.9.1.2.1. Electric
16.9.1.2.2. CNG
16.9.1.2.3. Petrol and Diesel
16.9.1.2.4. Fuel Cells
16.9.1.3. France Autonomous Forklifts Market Revenue (US$ Mn) and
Forecasts, By Technology
16.9.1.3.1. Line Guided
16.9.1.3.2. Laser Guided
16.9.1.3.3. Vision Guided (3D)
16.9.1.3.4. Others
16.9.1.4. France Autonomous Forklifts Market Revenue (US$ Mn) and
Forecasts, By Industry
16.9.1.4.1. Pharmaceutical
16.9.1.4.2. Chemical
16.9.1.4.3. Manufacturing
16.9.1.4.4. Automotive
16.9.1.4.5. Paper and Print
16.9.1.4.6. Food and Beverage
16.9.1.4.7. Others
16.9.1.5. France Autonomous Forklifts Market Revenue (US$ Mn) and
Forecasts, By Truck Type
16.9.1.5.1. Side Loader
16.9.1.5.2. Counterbalance Forklift
16.9.1.5.3. Telehandler
16.9.1.5.4. Rough Terrain Forklift
16.9.1.5.5. Pallet Jack
16.9.1.5.6. Walkie Stacker
16.9.1.5.7. Order Picker
16.9.1.5.8. Reach Fork Truck
16.9.1.5.9. Others
16.9.1.6. France Autonomous Forklifts Market Revenue (US$ Mn) and
Forecasts, By Channel
16.9.1.6.1. OEM
16.9.1.6.2. Aftermarket
16.9.1.7. France Autonomous Forklifts Market Revenue (US$ Mn) and
Forecasts, By Capacity
16.9.1.7.1. Less than 1000
16.9.1.7.2. 1000-2000
16.9.1.7.3. 2000-5000
16.9.1.7.4. Above 5000
16.9.2. The UK
16.9.2.1. The UK Autonomous Forklifts Market Revenue (US$ Mn) and
Forecasts, By Type
16.9.2.1.1. Indoor
16.9.2.1.2. Outdoor
16.9.2.2. The UK Autonomous Forklifts Market Revenue (US$ Mn) and
Forecasts, By Fuel Source
16.9.2.2.1. Electric
16.9.2.2.2. CNG
16.9.2.2.3. Petrol and Diesel
16.9.2.2.4. Fuel Cells
16.9.2.3. The UK Autonomous Forklifts Market Revenue (US$ Mn) and
Forecasts, By Technology
16.9.2.3.1. Line Guided
16.9.2.3.2. Laser Guided
16.9.2.3.3. Vision Guided (3D)
16.9.2.3.4. Others
16.9.2.4. The UK Autonomous Forklifts Market Revenue (US$ Mn) and
Forecasts, By Industry
16.9.2.4.1. Pharmaceutical
16.9.2.4.2. Chemical
16.9.2.4.3. Manufacturing
16.9.2.4.4. Automotive
16.9.2.4.5. Paper and Print
16.9.2.4.6. Food and Beverage
16.9.2.4.7. Others
16.9.2.5. The UK Autonomous Forklifts Market Revenue (US$ Mn) and
Forecasts, By Truck Type
16.9.2.5.1. Side Loader
16.9.2.5.2. Counterbalance Forklift
16.9.2.5.3. Telehandler
16.9.2.5.4. Rough Terrain Forklift
16.9.2.5.5. Pallet Jack
16.9.2.5.6. Walkie Stacker
16.9.2.5.7. Order Picker
16.9.2.5.8. Reach Fork Truck
16.9.2.5.9. Others
16.9.2.6. The UK Autonomous Forklifts Market Revenue (US$ Mn) and
Forecasts, By Channel
16.9.2.6.1. OEM
16.9.2.6.2. Aftermarket
16.9.2.7. The UK Autonomous Forklifts Market Revenue (US$ Mn) and
Forecasts, By Capacity
16.9.2.7.1. Less than 1000
16.9.2.7.2. 1000-2000
16.9.2.7.3. 2000-5000
16.9.2.7.4. Above 5000
16.9.3. Spain
16.9.3.1. Spain Autonomous Forklifts Market Revenue (US$ Mn) and
Forecasts, By Type
16.9.3.1.1. Indoor
16.9.3.1.2. Outdoor
16.9.3.2. Spain Autonomous Forklifts Market Revenue (US$ Mn) and
Forecasts, By Fuel Source
16.9.3.2.1. Electric
16.9.3.2.2. CNG
16.9.3.2.3. Petrol and Diesel
16.9.3.2.4. Fuel Cells
16.9.3.3. Spain Autonomous Forklifts Market Revenue (US$ Mn) and
Forecasts, By Technology
16.9.3.3.1. Line Guided
16.9.3.3.2. Laser Guided
16.9.3.3.3. Vision Guided (3D)
16.9.3.3.4. Others
16.9.3.4. Spain Autonomous Forklifts Market Revenue (US$ Mn) and
Forecasts, By Industry
16.9.3.4.1. Pharmaceutical
16.9.3.4.2. Chemical
16.9.3.4.3. Manufacturing
16.9.3.4.4. Automotive
16.9.3.4.5. Paper and Print
16.9.3.4.6. Food and Beverage
16.9.3.4.7. Others
16.9.3.5. Spain Autonomous Forklifts Market Revenue (US$ Mn) and
Forecasts, By Truck Type
16.9.3.5.1. Side Loader
16.9.3.5.2. Counterbalance Forklift
16.9.3.5.3. Telehandler
16.9.3.5.4. Rough Terrain Forklift
16.9.3.5.5. Pallet Jack
16.9.3.5.6. Walkie Stacker
16.9.3.5.7. Order Picker
16.9.3.5.8. Reach Fork Truck
16.9.3.5.9. Others
16.9.3.6. Spain Autonomous Forklifts Market Revenue (US$ Mn) and
Forecasts, By Channel
16.9.3.6.1. OEM
16.9.3.6.2. Aftermarket
16.9.3.7. Spain Autonomous Forklifts Market Revenue (US$ Mn) and
Forecasts, By Capacity
16.9.3.7.1. Less than 1000
16.9.3.7.2. 1000-2000
16.9.3.7.3. 2000-5000
16.9.3.7.4. Above 5000
16.9.4. Germany
16.9.4.1. Germany Autonomous Forklifts Market Revenue (US$ Mn) and
Forecasts, By Type
16.9.4.1.1. Indoor
16.9.4.1.2. Outdoor
16.9.4.2. Germany Autonomous Forklifts Market Revenue (US$ Mn) and
Forecasts, By Fuel Source
16.9.4.2.1. Electric
16.9.4.2.2. CNG
16.9.4.2.3. Petrol and Diesel
16.9.4.2.4. Fuel Cells
16.9.4.3. Germany Autonomous Forklifts Market Revenue (US$ Mn) and
Forecasts, By Technology
16.9.4.3.1. Line Guided
16.9.4.3.2. Laser Guided
16.9.4.3.3. Vision Guided (3D)
16.9.4.3.4. Others
16.9.4.4. Germany Autonomous Forklifts Market Revenue (US$ Mn) and
Forecasts, By Industry
16.9.4.4.1. Pharmaceutical
16.9.4.4.2. Chemical
16.9.4.4.3. Manufacturing
16.9.4.4.4. Automotive
16.9.4.4.5. Paper and Print
16.9.4.4.6. Food and Beverage
16.9.4.4.7. Others
16.9.4.5. Germany Autonomous Forklifts Market Revenue (US$ Mn) and
Forecasts, By Truck Type
16.9.4.5.1. Side Loader
16.9.4.5.2. Counterbalance Forklift
16.9.4.5.3. Telehandler
16.9.4.5.4. Rough Terrain Forklift
16.9.4.5.5. Pallet Jack
16.9.4.5.6. Walkie Stacker
16.9.4.5.7. Order Picker
16.9.4.5.8. Reach Fork Truck
16.9.4.5.9. Others
16.9.4.6. Germany Autonomous Forklifts Market Revenue (US$ Mn) and
Forecasts, By Channel
16.9.4.6.1. OEM
16.9.4.6.2. Aftermarket
16.9.4.7. Germany Autonomous Forklifts Market Revenue (US$ Mn) and
Forecasts, By Capacity
16.9.4.7.1. Less than 1000
16.9.4.7.2. 1000-2000
16.9.4.7.3. 2000-5000
16.9.4.7.4. Above 5000
16.9.5. Italy
16.9.5.1. Italy Autonomous Forklifts Market Revenue (US$ Mn) and
Forecasts, By Type
16.9.5.1.1. Indoor
16.9.5.1.2. Outdoor
16.9.5.2. Italy Autonomous Forklifts Market Revenue (US$ Mn) and
Forecasts, By Fuel Source
16.9.5.2.1. Electric
16.9.5.2.2. CNG
16.9.5.2.3. Petrol and Diesel
16.9.5.2.4. Fuel Cells
16.9.5.3. Italy Autonomous Forklifts Market Revenue (US$ Mn) and
Forecasts, By Technology
16.9.5.3.1. Line Guided
16.9.5.3.2. Laser Guided
16.9.5.3.3. Vision Guided (3D)
16.9.5.3.4. Others
16.9.5.4. Italy Autonomous Forklifts Market Revenue (US$ Mn) and
Forecasts, By Industry
16.9.5.4.1. Pharmaceutical
16.9.5.4.2. Chemical
16.9.5.4.3. Manufacturing
16.9.5.4.4. Automotive
16.9.5.4.5. Paper and Print
16.9.5.4.6. Food and Beverage
16.9.5.4.7. Others
16.9.5.5. Italy Autonomous Forklifts Market Revenue (US$ Mn) and
Forecasts, By Truck Type
16.9.5.5.1. Side Loader
16.9.5.5.2. Counterbalance Forklift
16.9.5.5.3. Telehandler
16.9.5.5.4. Rough Terrain Forklift
16.9.5.5.5. Pallet Jack
16.9.5.5.6. Walkie Stacker
16.9.5.5.7. Order Picker
16.9.5.5.8. Reach Fork Truck
16.9.5.5.9. Others
16.9.5.6. Italy Autonomous Forklifts Market Revenue (US$ Mn) and
Forecasts, By Channel
16.9.5.6.1. OEM
16.9.5.6.2. Aftermarket
16.9.5.7. Italy Autonomous Forklifts Market Revenue (US$ Mn) and
Forecasts, By Capacity
16.9.5.7.1. Less than 1000
16.9.5.7.2. 1000-2000
16.9.5.7.3. 2000-5000
16.9.5.7.4. Above 5000
16.9.6. Nordic Countries
16.9.6.1. Nordic Countries Autonomous Forklifts Market Revenue (US$ Mn)
and Forecasts, By Type
16.9.6.1.1. Indoor
16.9.6.1.2. Outdoor
16.9.6.2. Nordic Countries Autonomous Forklifts Market Revenue (US$ Mn)
and Forecasts, By Fuel Source
16.9.6.2.1. Electric
16.9.6.2.2. CNG
16.9.6.2.3. Petrol and Diesel
16.9.6.2.4. Fuel Cells
16.9.6.3. Nordic Countries Autonomous Forklifts Market Revenue (US$ Mn)
and Forecasts, By Technology
16.9.6.3.1. Line Guided
16.9.6.3.2. Laser Guided
16.9.6.3.3. Vision Guided (3D)
16.9.6.3.4. Others
16.9.6.4. Nordic Countries Autonomous Forklifts Market Revenue (US$ Mn)
and Forecasts, By Industry
16.9.6.4.1. Pharmaceutical
16.9.6.4.2. Chemical
16.9.6.4.3. Manufacturing
16.9.6.4.4. Automotive
16.9.6.4.5. Paper and Print
16.9.6.4.6. Food and Beverage
16.9.6.4.7. Others
16.9.6.5. Nordic Countries Autonomous Forklifts Market Revenue (US$ Mn)
and Forecasts, By Truck Type
16.9.6.5.1. Side Loader
16.9.6.5.2. Counterbalance Forklift
16.9.6.5.3. Telehandler
16.9.6.5.4. Rough Terrain Forklift
16.9.6.5.5. Pallet Jack
16.9.6.5.6. Walkie Stacker
16.9.6.5.7. Order Picker
16.9.6.5.8. Reach Fork Truck
16.9.6.5.9. Others
16.9.6.6. Nordic Countries Autonomous Forklifts Market Revenue (US$ Mn)
and Forecasts, By Channel
16.9.6.6.1. OEM
16.9.6.6.2. Aftermarket
16.9.6.7. Nordic Countries Autonomous Forklifts Market Revenue (US$ Mn)
and Forecasts, By Capacity
16.9.6.7.1. Less than 1000
16.9.6.7.2. 1000-2000
16.9.6.7.3. 2000-5000
16.9.6.7.4. Above 5000
16.9.6.8. Nordic Countries Autonomous Forklifts Market Revenue (US$ Mn)
and Forecasts, By Country
16.9.6.8.1. Denmark
16.9.6.8.2. Finland
16.9.6.8.3. Iceland
16.9.6.8.4. Sweden
16.9.6.8.5. Norway
16.9.7. Benelux Union
16.9.7.1. Benelux Union Autonomous Forklifts Market Revenue (US$ Mn) and
Forecasts, By Type
16.9.7.1.1. Indoor
16.9.7.1.2. Outdoor
16.9.7.2. Benelux Union Autonomous Forklifts Market Revenue (US$ Mn) and
Forecasts, By Fuel Source
16.9.7.2.1. Electric
16.9.7.2.2. CNG
16.9.7.2.3. Petrol and Diesel
16.9.7.2.4. Fuel Cells
16.9.7.3. Benelux Union Autonomous Forklifts Market Revenue (US$ Mn) and
Forecasts, By Technology
16.9.7.3.1. Line Guided
16.9.7.3.2. Laser Guided
16.9.7.3.3. Vision Guided (3D)
16.9.7.3.4. Others
16.9.7.4. Benelux Union Autonomous Forklifts Market Revenue (US$ Mn) and
Forecasts, By Industry
16.9.7.4.1. Pharmaceutical
16.9.7.4.2. Chemical
16.9.7.4.3. Manufacturing
16.9.7.4.4. Automotive
16.9.7.4.5. Paper and Print
16.9.7.4.6. Food and Beverage
16.9.7.4.7. Others
16.9.7.5. Benelux Union Autonomous Forklifts Market Revenue (US$ Mn) and
Forecasts, By Truck Type
16.9.7.5.1. Side Loader
16.9.7.5.2. Counterbalance Forklift
16.9.7.5.3. Telehandler
16.9.7.5.4. Rough Terrain Forklift
16.9.7.5.5. Pallet Jack
16.9.7.5.6. Walkie Stacker
16.9.7.5.7. Order Picker
16.9.7.5.8. Reach Fork Truck
16.9.7.5.9. Others
16.9.7.6. Benelux Union Autonomous Forklifts Market Revenue (US$ Mn) and
Forecasts, By Channel
16.9.7.6.1. OEM
16.9.7.6.2. Aftermarket
16.9.7.7. Benelux Union Autonomous Forklifts Market Revenue (US$ Mn) and
Forecasts, By Capacity
16.9.7.7.1. Less than 1000
16.9.7.7.2. 1000-2000
16.9.7.7.3. 2000-5000
16.9.7.7.4. Above 5000
16.9.7.8. Benelux Union Autonomous Forklifts Market Revenue (US$ Mn) and
Forecasts, By Country
16.9.7.8.1. Belgium
16.9.7.8.2. The Netherlands
16.9.7.8.3. Luxembourg
16.9.8. Rest of Europe
16.9.8.1. Rest of Europe Autonomous Forklifts Market Revenue (US$ Mn)
and Forecasts, By Type
16.9.8.1.1. Indoor
16.9.8.1.2. Outdoor
16.9.8.2. Rest of Europe Autonomous Forklifts Market Revenue (US$ Mn)
and Forecasts, By Fuel Source
16.9.8.2.1. Electric
16.9.8.2.2. CNG
16.9.8.2.3. Petrol and Diesel
16.9.8.2.4. Fuel Cells
16.9.8.3. Rest of Europe Autonomous Forklifts Market Revenue (US$ Mn)
and Forecasts, By Technology
16.9.8.3.1. Line Guided
16.9.8.3.2. Laser Guided
16.9.8.3.3. Vision Guided (3D)
16.9.8.3.4. Others
16.9.8.4. Rest of Europe Autonomous Forklifts Market Revenue (US$ Mn)
and Forecasts, By Industry
16.9.8.4.1. Pharmaceutical
16.9.8.4.2. Chemical
16.9.8.4.3. Manufacturing
16.9.8.4.4. Automotive
16.9.8.4.5. Paper and Print
16.9.8.4.6. Food and Beverage
16.9.8.4.7. Others
16.9.8.5. Rest of Europe Autonomous Forklifts Market Revenue (US$ Mn)
and Forecasts, By Truck Type
16.9.8.5.1. Side Loader
16.9.8.5.2. Counterbalance Forklift
16.9.8.5.3. Telehandler
16.9.8.5.4. Rough Terrain Forklift
16.9.8.5.5. Pallet Jack
16.9.8.5.6. Walkie Stacker
16.9.8.5.7. Order Picker
16.9.8.5.8. Reach Fork Truck
16.9.8.5.9. Others
16.9.8.6. Rest of Europe Autonomous Forklifts Market Revenue (US$ Mn)
and Forecasts, By Channel
16.9.8.6.1. OEM
16.9.8.6.2. Aftermarket
16.9.8.7. Rest of Europe Autonomous Forklifts Market Revenue (US$ Mn)
and Forecasts, By Capacity
16.9.8.7.1. Less than 1000
16.9.8.7.2. 1000-2000
16.9.8.7.3. 2000-5000
16.9.8.7.4. Above 5000
16.10. Key Segment for Channeling Investments
16.10.1. By Country
16.10.2. By Type
16.10.3. By Fuel Source
16.10.4. By Technology
16.10.5. By Industry
16.10.6. By Truck Type
16.10.7. By Channel
16.10.8. By Capacity
17. Asia
Pacific Autonomous Forklifts Market Analysis and Forecasts, 2019 - 2027
17.1. Overview
17.1.1. Asia Pacific Autonomous Forklifts Market Revenue (US$ Mn)
17.2. Asia Pacific Autonomous Forklifts Market Revenue (US$ Mn) and
Forecasts, By Type
17.2.1. Indoor
17.2.2. Outdoor
17.3. Asia Pacific Autonomous Forklifts Market Revenue (US$ Mn) and
Forecasts, By Fuel Source
17.3.1. Electric
17.3.2. CNG
17.3.3. Petrol and Diesel
17.3.4. Fuel Cells
17.4. Asia Pacific Autonomous Forklifts Market Revenue (US$ Mn) and
Forecasts, By Technology
17.4.1. Line Guided
17.4.2. Laser Guided
17.4.3. Vision Guided (3D)
17.4.4. Others
17.5. Asia Pacific Autonomous Forklifts Market Revenue (US$ Mn) and
Forecasts, By Industry
17.5.1. Pharmaceutical
17.5.2. Chemical
17.5.3. Manufacturing
17.5.4. Automotive
17.5.5. Paper and Print
17.5.6. Food and Beverage
17.5.7. Others
17.6. Asia Pacific Autonomous Forklifts Market Revenue (US$ Mn) and
Forecasts, By Truck Type
17.6.1. Side Loader
17.6.2. Counterbalance Forklift
17.6.3. Telehandler
17.6.4. Rough Terrain Forklift
17.6.5. Pallet Jack
17.6.6. Walkie Stacker
17.6.7. Order Picker
17.6.8. Reach Fork Truck
17.6.9. Others
17.7. Asia Pacific Autonomous Forklifts Market Revenue (US$ Mn) and
Forecasts, By Channel
17.7.1. OEM
17.7.2. Aftermarket
17.8. Asia Pacific Autonomous Forklifts Market Revenue (US$ Mn) and
Forecasts, By Capacity
17.8.1. Less than 1000
17.8.2. 1000-2000
17.8.3. 2000-5000
17.8.4. Above 5000
17.9. Asia Pacific Autonomous Forklifts Market Revenue (US$ Mn) and
Forecasts, By Country
17.9.1. China
17.9.1.1. China Autonomous Forklifts Market Revenue (US$ Mn) and
Forecasts, By Type
17.9.1.1.1. Indoor
17.9.1.1.2. Outdoor
17.9.1.2. China Autonomous Forklifts Market Revenue (US$ Mn) and
Forecasts, By Fuel Source
17.9.1.2.1. Electric
17.9.1.2.2. CNG
17.9.1.2.3. Petrol and Diesel
17.9.1.2.4. Fuel Cells
17.9.1.3. China Autonomous Forklifts Market Revenue (US$ Mn) and
Forecasts, By Technology
17.9.1.3.1. Line Guided
17.9.1.3.2. Laser Guided
17.9.1.3.3. Vision Guided (3D)
17.9.1.3.4. Others
17.9.1.4. China Autonomous Forklifts Market Revenue (US$ Mn) and
Forecasts, By Industry
17.9.1.4.1. Pharmaceutical
17.9.1.4.2. Chemical
17.9.1.4.3. Manufacturing
17.9.1.4.4. Automotive
17.9.1.4.5. Paper and Print
17.9.1.4.6. Food and Beverage
17.9.1.4.7. Others
17.9.1.5. China Autonomous Forklifts Market Revenue (US$ Mn) and
Forecasts, By Truck Type
17.9.1.5.1. Side Loader
17.9.1.5.2. Counterbalance Forklift
17.9.1.5.3. Telehandler
17.9.1.5.4. Rough Terrain Forklift
17.9.1.5.5. Pallet Jack
17.9.1.5.6. Walkie Stacker
17.9.1.5.7. Order Picker
17.9.1.5.8. Reach Fork Truck
17.9.1.5.9. Others
17.9.1.6. China Autonomous Forklifts Market Revenue (US$ Mn) and
Forecasts, By Channel
17.9.1.6.1. OEM
17.9.1.6.2. Aftermarket
17.9.1.7. China Autonomous Forklifts Market Revenue (US$ Mn) and
Forecasts, By Capacity
17.9.1.7.1. Less than 1000
17.9.1.7.2. 1000-2000
17.9.1.7.3. 2000-5000
17.9.1.7.4. Above 5000
17.9.2. Japan
17.9.2.1. Japan Autonomous Forklifts Market Revenue (US$ Mn) and
Forecasts, By Type
17.9.2.1.1. Indoor
17.9.2.1.2. Outdoor
17.9.2.2. Japan Autonomous Forklifts Market Revenue (US$ Mn) and
Forecasts, By Fuel Source
17.9.2.2.1. Electric
17.9.2.2.2. CNG
17.9.2.2.3. Petrol and Diesel
17.9.2.2.4. Fuel Cells
17.9.2.3. Japan Autonomous Forklifts Market Revenue (US$ Mn) and
Forecasts, By Technology
17.9.2.3.1. Line Guided
17.9.2.3.2. Laser Guided
17.9.2.3.3. Vision Guided (3D)
17.9.2.3.4. Others
17.9.2.4. Japan Autonomous Forklifts Market Revenue (US$ Mn) and
Forecasts, By Industry
17.9.2.4.1. Pharmaceutical
17.9.2.4.2. Chemical
17.9.2.4.3. Manufacturing
17.9.2.4.4. Automotive
17.9.2.4.5. Paper and Print
17.9.2.4.6. Food and Beverage
17.9.2.4.7. Others
17.9.2.5. Japan Autonomous Forklifts Market Revenue (US$ Mn) and
Forecasts, By Truck Type
17.9.2.5.1. Side Loader
17.9.2.5.2. Counterbalance Forklift
17.9.2.5.3. Telehandler
17.9.2.5.4. Rough Terrain Forklift
17.9.2.5.5. Pallet Jack
17.9.2.5.6. Walkie Stacker
17.9.2.5.7. Order Picker
17.9.2.5.8. Reach Fork Truck
17.9.2.5.9. Others
17.9.2.6. Japan Autonomous Forklifts Market Revenue (US$ Mn) and
Forecasts, By Channel
17.9.2.6.1. OEM
17.9.2.6.2. Aftermarket
17.9.2.7. Japan Autonomous Forklifts Market Revenue (US$ Mn) and
Forecasts, By Capacity
17.9.2.7.1. Less than 1000
17.9.2.7.2. 1000-2000
17.9.2.7.3. 2000-5000
17.9.2.7.4. Above 5000
17.9.3. India
17.9.3.1. India Autonomous Forklifts Market Revenue (US$ Mn) and
Forecasts, By Type
17.9.3.1.1. Indoor
17.9.3.1.2. Outdoor
17.9.3.2. India Autonomous Forklifts Market Revenue (US$ Mn) and
Forecasts, By Fuel Source
17.9.3.2.1. Electric
17.9.3.2.2. CNG
17.9.3.2.3. Petrol and Diesel
17.9.3.2.4. Fuel Cells
17.9.3.3. India Autonomous Forklifts Market Revenue (US$ Mn) and
Forecasts, By Technology
17.9.3.3.1. Line Guided
17.9.3.3.2. Laser Guided
17.9.3.3.3. Vision Guided (3D)
17.9.3.3.4. Others
17.9.3.4. India Autonomous Forklifts Market Revenue (US$ Mn) and
Forecasts, By Industry
17.9.3.4.1. Pharmaceutical
17.9.3.4.2. Chemical
17.9.3.4.3. Manufacturing
17.9.3.4.4. Automotive
17.9.3.4.5. Paper and Print
17.9.3.4.6. Food and Beverage
17.9.3.4.7. Others
17.9.3.5. India Autonomous Forklifts Market Revenue (US$ Mn) and
Forecasts, By Truck Type
17.9.3.5.1. Side Loader
17.9.3.5.2. Counterbalance Forklift
17.9.3.5.3. Telehandler
17.9.3.5.4. Rough Terrain Forklift
17.9.3.5.5. Pallet Jack
17.9.3.5.6. Walkie Stacker
17.9.3.5.7. Order Picker
17.9.3.5.8. Reach Fork Truck
17.9.3.5.9. Others
17.9.3.6. India Autonomous Forklifts Market Revenue (US$ Mn) and
Forecasts, By Channel
17.9.3.6.1. OEM
17.9.3.6.2. Aftermarket
17.9.3.7. India Autonomous Forklifts Market Revenue (US$ Mn) and
Forecasts, By Capacity
17.9.3.7.1. Less than 1000
17.9.3.7.2. 1000-2000
17.9.3.7.3. 2000-5000
17.9.3.7.4. Above 5000
17.9.4. New Zealand
17.9.4.1. New Zealand Autonomous Forklifts Market Revenue (US$ Mn) and
Forecasts, By Type
17.9.4.1.1. Indoor
17.9.4.1.2. Outdoor
17.9.4.2. New Zealand Autonomous Forklifts Market Revenue (US$ Mn) and
Forecasts, By Fuel Source
17.9.4.2.1. Electric
17.9.4.2.2. CNG
17.9.4.2.3. Petrol and Diesel
17.9.4.2.4. Fuel Cells
17.9.4.3. New Zealand Autonomous Forklifts Market Revenue (US$ Mn) and
Forecasts, By Technology
17.9.4.3.1. Line Guided
17.9.4.3.2. Laser Guided
17.9.4.3.3. Vision Guided (3D)
17.9.4.3.4. Others
17.9.4.4. New Zealand Autonomous Forklifts Market Revenue (US$ Mn) and
Forecasts, By Industry
17.9.4.4.1. Pharmaceutical
17.9.4.4.2. Chemical
17.9.4.4.3. Manufacturing
17.9.4.4.4. Automotive
17.9.4.4.5. Paper and Print
17.9.4.4.6. Food and Beverage
17.9.4.4.7. Others
17.9.4.5. New Zealand Autonomous Forklifts Market Revenue (US$ Mn) and
Forecasts, By Truck Type
17.9.4.5.1. Side Loader
17.9.4.5.2. Counterbalance Forklift
17.9.4.5.3. Telehandler
17.9.4.5.4. Rough Terrain Forklift
17.9.4.5.5. Pallet Jack
17.9.4.5.6. Walkie Stacker
17.9.4.5.7. Order Picker
17.9.4.5.8. Reach Fork Truck
17.9.4.5.9. Others
17.9.4.6. New Zealand Autonomous Forklifts Market Revenue (US$ Mn) and
Forecasts, By Channel
17.9.4.6.1. OEM
17.9.4.6.2. Aftermarket
17.9.4.7. New Zealand Autonomous Forklifts Market Revenue (US$ Mn) and
Forecasts, By Capacity
17.9.4.7.1. Less than 1000
17.9.4.7.2. 1000-2000
17.9.4.7.3. 2000-5000
17.9.4.7.4. Above 5000
17.9.5. Australia
17.9.5.1. Australia Autonomous Forklifts Market Revenue (US$ Mn) and
Forecasts, By Type
17.9.5.1.1. Indoor
17.9.5.1.2. Outdoor
17.9.5.2. Australia Autonomous Forklifts Market Revenue (US$ Mn) and
Forecasts, By Fuel Source
17.9.5.2.1. Electric
17.9.5.2.2. CNG
17.9.5.2.3. Petrol and Diesel
17.9.5.2.4. Fuel Cells
17.9.5.3. Australia Autonomous Forklifts Market Revenue (US$ Mn) and
Forecasts, By Technology
17.9.5.3.1. Line Guided
17.9.5.3.2. Laser Guided
17.9.5.3.3. Vision Guided (3D)
17.9.5.3.4. Others
17.9.5.4. Australia Autonomous Forklifts Market Revenue (US$ Mn) and
Forecasts, By Industry
17.9.5.4.1. Pharmaceutical
17.9.5.4.2. Chemical
17.9.5.4.3. Manufacturing
17.9.5.4.4. Automotive
17.9.5.4.5. Paper and Print
17.9.5.4.6. Food and Beverage
17.9.5.4.7. Others
17.9.5.5. Australia Autonomous Forklifts Market Revenue (US$ Mn) and
Forecasts, By Truck Type
17.9.5.5.1. Side Loader
17.9.5.5.2. Counterbalance Forklift
17.9.5.5.3. Telehandler
17.9.5.5.4. Rough Terrain Forklift
17.9.5.5.5. Pallet Jack
17.9.5.5.6. Walkie Stacker
17.9.5.5.7. Order Picker
17.9.5.5.8. Reach Fork Truck
17.9.5.5.9. Others
17.9.5.6. Australia Autonomous Forklifts Market Revenue (US$ Mn) and
Forecasts, By Channel
17.9.5.6.1. OEM
17.9.5.6.2. Aftermarket
17.9.5.7. Australia Autonomous Forklifts Market Revenue (US$ Mn) and
Forecasts, By Capacity
17.9.5.7.1. Less than 1000
17.9.5.7.2. 1000-2000
17.9.5.7.3. 2000-5000
17.9.5.7.4. Above 5000
17.9.6. South Korea
17.9.6.1. South Korea Autonomous Forklifts Market Revenue (US$ Mn) and
Forecasts, By Type
17.9.6.1.1. Indoor
17.9.6.1.2. Outdoor
17.9.6.2. South Korea Autonomous Forklifts Market Revenue (US$ Mn) and
Forecasts, By Fuel Source
17.9.6.2.1. Electric
17.9.6.2.2. CNG
17.9.6.2.3. Petrol and Diesel
17.9.6.2.4. Fuel Cells
17.9.6.3. South Korea Autonomous Forklifts Market Revenue (US$ Mn) and
Forecasts, By Technology
17.9.6.3.1. Line Guided
17.9.6.3.2. Laser Guided
17.9.6.3.3. Vision Guided (3D)
17.9.6.3.4. Others
17.9.6.4. South Korea Autonomous Forklifts Market Revenue (US$ Mn) and
Forecasts, By Industry
17.9.6.4.1. Pharmaceutical
17.9.6.4.2. Chemical
17.9.6.4.3. Manufacturing
17.9.6.4.4. Automotive
17.9.6.4.5. Paper and Print
17.9.6.4.6. Food and Beverage
17.9.6.4.7. Others
17.9.6.5. South Korea Autonomous Forklifts Market Revenue (US$ Mn) and
Forecasts, By Truck Type
17.9.6.5.1. Side Loader
17.9.6.5.2. Counterbalance Forklift
17.9.6.5.3. Telehandler
17.9.6.5.4. Rough Terrain Forklift
17.9.6.5.5. Pallet Jack
17.9.6.5.6. Walkie Stacker
17.9.6.5.7. Order Picker
17.9.6.5.8. Reach Fork Truck
17.9.6.5.9. Others
17.9.6.6. South Korea Autonomous Forklifts Market Revenue (US$ Mn) and
Forecasts, By Channel
17.9.6.6.1. OEM
17.9.6.6.2. Aftermarket
17.9.6.7. South Korea Autonomous Forklifts Market Revenue (US$ Mn) and
Forecasts, By Capacity
17.9.6.7.1. Less than 1000
17.9.6.7.2. 1000-2000
17.9.6.7.3. 2000-5000
17.9.6.7.4. Above 5000
17.9.7. Southeast Asia
17.9.7.1. Southeast Asia Autonomous Forklifts Market Revenue (US$ Mn)
and Forecasts, By Type
17.9.7.1.1. Indoor
17.9.7.1.2. Outdoor
17.9.7.2. Southeast Asia Autonomous Forklifts Market Revenue (US$ Mn)
and Forecasts, By Fuel Source
17.9.7.2.1. Electric
17.9.7.2.2. CNG
17.9.7.2.3. Petrol and Diesel
17.9.7.2.4. Fuel Cells
17.9.7.3. Southeast Asia Autonomous Forklifts Market Revenue (US$ Mn)
and Forecasts, By Technology
17.9.7.3.1. Line Guided
17.9.7.3.2. Laser Guided
17.9.7.3.3. Vision Guided (3D)
17.9.7.3.4. Others
17.9.7.4. Southeast Asia Autonomous Forklifts Market Revenue (US$ Mn)
and Forecasts, By Industry
17.9.7.4.1. Pharmaceutical
17.9.7.4.2. Chemical
17.9.7.4.3. Manufacturing
17.9.7.4.4. Automotive
17.9.7.4.5. Paper and Print
17.9.7.4.6. Food and Beverage
17.9.7.4.7. Others
17.9.7.5. Southeast Asia Autonomous Forklifts Market Revenue (US$ Mn)
and Forecasts, By Truck Type
17.9.7.5.1. Side Loader
17.9.7.5.2. Counterbalance Forklift
17.9.7.5.3. Telehandler
17.9.7.5.4. Rough Terrain Forklift
17.9.7.5.5. Pallet Jack
17.9.7.5.6. Walkie Stacker
17.9.7.5.7. Order Picker
17.9.7.5.8. Reach Fork Truck
17.9.7.5.9. Others
17.9.7.6. Southeast Asia Autonomous Forklifts Market Revenue (US$ Mn)
and Forecasts, By Channel
17.9.7.6.1. OEM
17.9.7.6.2. Aftermarket
17.9.7.7. Southeast Asia Autonomous Forklifts Market Revenue (US$ Mn) and
Forecasts, By Capacity
17.9.7.7.1. Less than 1000
17.9.7.7.2. 1000-2000
17.9.7.7.3. 2000-5000
17.9.7.7.4. Above 5000
17.9.7.8. Southeast Asia Autonomous Forklifts Market Revenue (US$ Mn)
and Forecasts, By Country
17.9.7.8.1. Indonesia
17.9.7.8.2. Thailand
17.9.7.8.3. Malaysia
17.9.7.8.4. Singapore
17.9.7.8.5. Rest of Southeast Asia
17.9.8. Rest of Asia Pacific
17.9.8.1. Rest of Asia Pacific Autonomous Forklifts Market Revenue (US$
Mn) and Forecasts, By Type
17.9.8.1.1. Indoor
17.9.8.1.2. Outdoor
17.9.8.2. Rest of Asia Pacific Autonomous Forklifts Market Revenue (US$
Mn) and Forecasts, By Fuel Source
17.9.8.2.1. Electric
17.9.8.2.2. CNG
17.9.8.2.3. Petrol and Diesel
17.9.8.2.4. Fuel Cells
17.9.8.3. Rest of Asia Pacific Autonomous Forklifts Market Revenue (US$
Mn) and Forecasts, By Technology
17.9.8.3.1. Line Guided
17.9.8.3.2. Laser Guided
17.9.8.3.3. Vision Guided (3D)
17.9.8.3.4. Others
17.9.8.4. Rest of Asia Pacific Autonomous Forklifts Market Revenue (US$
Mn) and Forecasts, By Industry
17.9.8.4.1. Pharmaceutical
17.9.8.4.2. Chemical
17.9.8.4.3. Manufacturing
17.9.8.4.4. Automotive
17.9.8.4.5. Paper and Print
17.9.8.4.6. Food and Beverage
17.9.8.4.7. Others
17.9.8.5. Rest of Asia Pacific Autonomous Forklifts Market Revenue (US$
Mn) and Forecasts, By Truck Type
17.9.8.5.1. Side Loader
17.9.8.5.2. Counterbalance Forklift
17.9.8.5.3. Telehandler
17.9.8.5.4. Rough Terrain Forklift
17.9.8.5.5. Pallet Jack
17.9.8.5.6. Walkie Stacker
17.9.8.5.7. Order Picker
17.9.8.5.8. Reach Fork Truck
17.9.8.5.9. Others
17.9.8.6. Rest of Asia Pacific Autonomous Forklifts Market Revenue (US$
Mn) and Forecasts, By Channel
17.9.8.6.1. OEM
17.9.8.6.2. Aftermarket
17.9.8.7. Rest of Asia Pacific Autonomous Forklifts Market Revenue (US$
Mn) and Forecasts, By Capacity
17.9.8.7.1. Less than 1000
17.9.8.7.2. 1000-2000
17.9.8.7.3. 2000-5000
17.9.8.7.4. Above 5000
17.10. Key Segment for Channeling Investments
17.10.1. By Country
17.10.2. By Type
17.10.3. By Fuel Source
17.10.4. By Technology
17.10.5. By Industry
17.10.6. By Truck Type
17.10.7. By Channel
17.10.8. By Capacity
18. Middle
East and Africa Autonomous Forklifts Market Analysis and Forecasts, 2019 - 2027
18.1. Overview
18.1.1. Middle East and Africa Autonomous Forklifts Market Revenue
(US$ Mn)
18.2. Middle East and Africa Autonomous Forklifts Market Revenue
(US$ Mn) and Forecasts, By Type
18.2.1. Indoor
18.2.2. Outdoor
18.3. Middle East and Africa Autonomous Forklifts Market Revenue
(US$ Mn) and Forecasts, By Fuel Source
18.3.1. Electric
18.3.2. CNG
18.3.3. Petrol and Diesel
18.3.4. Fuel Cells
18.4. Middle East and Africa Autonomous Forklifts Market Revenue
(US$ Mn) and Forecasts, By Technology
18.4.1. Line Guided
18.4.2. Laser Guided
18.4.3. Vision Guided (3D)
18.4.4. Others
18.5. Middle East and Africa Autonomous Forklifts Market Revenue
(US$ Mn) and Forecasts, By Industry
18.5.1. Pharmaceutical
18.5.2. Chemical
18.5.3. Manufacturing
18.5.4. Automotive
18.5.5. Paper and Print
18.5.6. Food and Beverage
18.5.7. Others
18.6. Middle East and Africa Autonomous Forklifts Market Revenue
(US$ Mn) and Forecasts, By Truck Type
18.6.1. Side Loader
18.6.2. Counterbalance Forklift
18.6.3. Telehandler
18.6.4. Rough Terrain Forklift
18.6.5. Pallet Jack
18.6.6. Walkie Stacker
18.6.7. Order Picker
18.6.8. Reach Fork Truck
18.6.9. Others
18.7. Middle East and Africa Autonomous Forklifts Market Revenue
(US$ Mn) and Forecasts, By Channel
18.7.1. OEM
18.7.2. Aftermarket
18.8. Middle East and Africa Autonomous Forklifts Market Revenue
(US$ Mn) and Forecasts, By Capacity
18.8.1. Less than 1000
18.8.2. 1000-2000
18.8.3. 2000-5000
18.8.4. Above 5000
18.9. Middle East and Africa Autonomous Forklifts Market Revenue
(US$ Mn) and Forecasts, By Country
18.9.1. Saudi Arabia
18.9.1.1. Saudi Arabia Autonomous Forklifts Market Revenue (US$ Mn) and
Forecasts, By Type
18.9.1.1.1. Indoor
18.9.1.1.2. Outdoor
18.9.1.2. Saudi Arabia Autonomous Forklifts Market Revenue (US$ Mn) and
Forecasts, By Fuel Source
18.9.1.2.1. Electric
18.9.1.2.2. CNG
18.9.1.2.3. Petrol and Diesel
18.9.1.2.4. Fuel Cells
18.9.1.3. Saudi Arabia Autonomous Forklifts Market Revenue (US$ Mn) and
Forecasts, By Technology
18.9.1.3.1. Line Guided
18.9.1.3.2. Laser Guided
18.9.1.3.3. Vision Guided (3D)
18.9.1.3.4. Others
18.9.1.4. Saudi Arabia Autonomous Forklifts Market Revenue (US$ Mn) and
Forecasts, By Industry
18.9.1.4.1. Pharmaceutical
18.9.1.4.2. Chemical
18.9.1.4.3. Manufacturing
18.9.1.4.4. Automotive
18.9.1.4.5. Paper and Print
18.9.1.4.6. Food and Beverage
18.9.1.4.7. Others
18.9.1.5. Saudi Arabia Autonomous Forklifts Market Revenue (US$ Mn) and
Forecasts, By Truck Type
18.9.1.5.1. Side Loader
18.9.1.5.2. Counterbalance Forklift
18.9.1.5.3. Telehandler
18.9.1.5.4. Rough Terrain Forklift
18.9.1.5.5. Pallet Jack
18.9.1.5.6. Walkie Stacker
18.9.1.5.7. Order Picker
18.9.1.5.8. Reach Fork Truck
18.9.1.5.9. Others
18.9.1.6. Saudi Arabia Autonomous Forklifts Market Revenue (US$ Mn) and
Forecasts, By Channel
18.9.1.6.1. OEM
18.9.1.6.2. Aftermarket
18.9.1.7. Saudi Arabia Autonomous Forklifts Market Revenue (US$ Mn) and
Forecasts, By Capacity
18.9.1.7.1. Less than 1000
18.9.1.7.2. 1000-2000
18.9.1.7.3. 2000-5000
18.9.1.7.4. Above 5000
18.9.2. UAE
18.9.2.1. UAE Autonomous Forklifts Market Revenue (US$ Mn) and Forecasts,
By Type
18.9.2.1.1. Indoor
18.9.2.1.2. Outdoor
18.9.2.2. UAE Autonomous Forklifts Market Revenue (US$ Mn) and
Forecasts, By Fuel Source
18.9.2.2.1. Electric
18.9.2.2.2. CNG
18.9.2.2.3. Petrol and Diesel
18.9.2.2.4. Fuel Cells
18.9.2.3. UAE Autonomous Forklifts Market Revenue (US$ Mn) and
Forecasts, By Technology
18.9.2.3.1. Line Guided
18.9.2.3.2. Laser Guided
18.9.2.3.3. Vision Guided (3D)
18.9.2.3.4. Others
18.9.2.4. UAE Autonomous Forklifts Market Revenue (US$ Mn) and
Forecasts, By Industry
18.9.2.4.1. Pharmaceutical
18.9.2.4.2. Chemical
18.9.2.4.3. Manufacturing
18.9.2.4.4. Automotive
18.9.2.4.5. Paper and Print
18.9.2.4.6. Food and Beverage
18.9.2.4.7. Others
18.9.2.5. UAE Autonomous Forklifts Market Revenue (US$ Mn) and
Forecasts, By Truck Type
18.9.2.5.1. Side Loader
18.9.2.5.2. Counterbalance Forklift
18.9.2.5.3. Telehandler
18.9.2.5.4. Rough Terrain Forklift
18.9.2.5.5. Pallet Jack
18.9.2.5.6. Walkie Stacker
18.9.2.5.7. Order Picker
18.9.2.5.8. Reach Fork Truck
18.9.2.5.9. Others
18.9.2.6. UAE Autonomous Forklifts Market Revenue (US$ Mn) and
Forecasts, By Channel
18.9.2.6.1. OEM
18.9.2.6.2. Aftermarket
18.9.2.7. UAE Autonomous Forklifts Market Revenue (US$ Mn) and
Forecasts, By Capacity
18.9.2.7.1. Less than 1000
18.9.2.7.2. 1000-2000
18.9.2.7.3. 2000-5000
18.9.2.7.4. Above 5000
18.9.3. Egypt
18.9.3.1. Egypt Autonomous Forklifts Market Revenue (US$ Mn) and
Forecasts, By Type
18.9.3.1.1. Indoor
18.9.3.1.2. Outdoor
18.9.3.2. Egypt Autonomous Forklifts Market Revenue (US$ Mn) and
Forecasts, By Fuel Source
18.9.3.2.1. Electric
18.9.3.2.2. CNG
18.9.3.2.3. Petrol and Diesel
18.9.3.2.4. Fuel Cells
18.9.3.3. Egypt Autonomous Forklifts Market Revenue (US$ Mn) and
Forecasts, By Technology
18.9.3.3.1. Line Guided
18.9.3.3.2. Laser Guided
18.9.3.3.3. Vision Guided (3D)
18.9.3.3.4. Others
18.9.3.4. Egypt Autonomous Forklifts Market Revenue (US$ Mn) and
Forecasts, By Industry
18.9.3.4.1. Pharmaceutical
18.9.3.4.2. Chemical
18.9.3.4.3. Manufacturing
18.9.3.4.4. Automotive
18.9.3.4.5. Paper and Print
18.9.3.4.6. Food and Beverage
18.9.3.4.7. Others
18.9.3.5. Egypt Autonomous Forklifts Market Revenue (US$ Mn) and
Forecasts, By Truck Type
18.9.3.5.1. Side Loader
18.9.3.5.2. Counterbalance Forklift
18.9.3.5.3. Telehandler
18.9.3.5.4. Rough Terrain Forklift
18.9.3.5.5. Pallet Jack
18.9.3.5.6. Walkie Stacker
18.9.3.5.7. Order Picker
18.9.3.5.8. Reach Fork Truck
18.9.3.5.9. Others
18.9.3.6. Egypt Autonomous Forklifts Market Revenue (US$ Mn) and
Forecasts, By Channel
18.9.3.6.1. OEM
18.9.3.6.2. Aftermarket
18.9.3.7. Egypt Autonomous Forklifts Market Revenue (US$ Mn) and
Forecasts, By Capacity
18.9.3.7.1. Less than 1000
18.9.3.7.2. 1000-2000
18.9.3.7.3. 2000-5000
18.9.3.7.4. Above 5000
18.9.4. Kuwait
18.9.4.1. Kuwait Autonomous Forklifts Market Revenue (US$ Mn) and
Forecasts, By Type
18.9.4.1.1. Indoor
18.9.4.1.2. Outdoor
18.9.4.2. Kuwait Autonomous Forklifts Market Revenue (US$ Mn) and
Forecasts, By Fuel Source
18.9.4.2.1. Electric
18.9.4.2.2. CNG
18.9.4.2.3. Petrol and Diesel
18.9.4.2.4. Fuel Cells
18.9.4.3. Kuwait Autonomous Forklifts Market Revenue (US$ Mn) and
Forecasts, By Technology
18.9.4.3.1. Line Guided
18.9.4.3.2. Laser Guided
18.9.4.3.3. Vision Guided (3D)
18.9.4.3.4. Others
18.9.4.4. Kuwait Autonomous Forklifts Market Revenue (US$ Mn) and
Forecasts, By Industry
18.9.4.4.1. Pharmaceutical
18.9.4.4.2. Chemical
18.9.4.4.3. Manufacturing
18.9.4.4.4. Automotive
18.9.4.4.5. Paper and Print
18.9.4.4.6. Food and Beverage
18.9.4.4.7. Others
18.9.4.5. Kuwait Autonomous Forklifts Market Revenue (US$ Mn) and
Forecasts, By Truck Type
18.9.4.5.1. Side Loader
18.9.4.5.2. Counterbalance Forklift
18.9.4.5.3. Telehandler
18.9.4.5.4. Rough Terrain Forklift
18.9.4.5.5. Pallet Jack
18.9.4.5.6. Walkie Stacker
18.9.4.5.7. Order Picker
18.9.4.5.8. Reach Fork Truck
18.9.4.5.9. Others
18.9.4.6. Kuwait Autonomous Forklifts Market Revenue (US$ Mn) and
Forecasts, By Channel
18.9.4.6.1. OEM
18.9.4.6.2. Aftermarket
18.9.4.7. Kuwait Autonomous Forklifts Market Revenue (US$ Mn) and
Forecasts, By Capacity
18.9.4.7.1. Less than 1000
18.9.4.7.2. 1000-2000
18.9.4.7.3. 2000-5000
18.9.4.7.4. Above 5000
18.9.5. South Africa
18.9.5.1. South Africa Autonomous Forklifts Market Revenue (US$ Mn) and
Forecasts, By Type
18.9.5.1.1. Indoor
18.9.5.1.2. Outdoor
18.9.5.2. South Africa Autonomous Forklifts Market Revenue (US$ Mn) and
Forecasts, By Fuel Source
18.9.5.2.1. Electric
18.9.5.2.2. CNG
18.9.5.2.3. Petrol and Diesel
18.9.5.2.4. Fuel Cells
18.9.5.3. South Africa Autonomous Forklifts Market Revenue (US$ Mn) and
Forecasts, By Technology
18.9.5.3.1. Line Guided
18.9.5.3.2. Laser Guided
18.9.5.3.3. Vision Guided (3D)
18.9.5.3.4. Others
18.9.5.4. South Africa Autonomous Forklifts Market Revenue (US$ Mn) and
Forecasts, By Industry
18.9.5.4.1. Pharmaceutical
18.9.5.4.2. Chemical
18.9.5.4.3. Manufacturing
18.9.5.4.4. Automotive
18.9.5.4.5. Paper and Print
18.9.5.4.6. Food and Beverage
18.9.5.4.7. Others
18.9.5.5. South Africa Autonomous Forklifts Market Revenue (US$ Mn) and
Forecasts, By Truck Type
18.9.5.5.1. Side Loader
18.9.5.5.2. Counterbalance Forklift
18.9.5.5.3. Telehandler
18.9.5.5.4. Rough Terrain Forklift
18.9.5.5.5. Pallet Jack
18.9.5.5.6. Walkie Stacker
18.9.5.5.7. Order Picker
18.9.5.5.8. Reach Fork Truck
18.9.5.5.9. Others
18.9.5.6. South Africa Autonomous Forklifts Market Revenue (US$ Mn) and
Forecasts, By Channel
18.9.5.6.1. OEM
18.9.5.6.2. Aftermarket
18.9.5.7. South Africa Autonomous Forklifts Market Revenue (US$ Mn) and
Forecasts, By Capacity
18.9.5.7.1. Less than 1000
18.9.5.7.2. 1000-2000
18.9.5.7.3. 2000-5000
18.9.5.7.4. Above 5000
18.9.6. Rest of Middle East & Africa
18.9.6.1. Rest of Middle East & Africa Autonomous Forklifts Market
Revenue (US$ Mn) and Forecasts, By Type
18.9.6.1.1. Indoor
18.9.6.1.2. Outdoor
18.9.6.2. Rest of Middle East & Africa Autonomous Forklifts Market
Revenue (US$ Mn) and Forecasts, By Fuel Source
18.9.6.2.1. Electric
18.9.6.2.2. CNG
18.9.6.2.3. Petrol and Diesel
18.9.6.2.4. Fuel Cells
18.9.6.3. Rest of Middle East & Africa Autonomous Forklifts Market
Revenue (US$ Mn) and Forecasts, By Technology
18.9.6.3.1. Line Guided
18.9.6.3.2. Laser Guided
18.9.6.3.3. Vision Guided (3D)
18.9.6.3.4. Others
18.9.6.4. Rest of Middle East & Africa Autonomous Forklifts Market
Revenue (US$ Mn) and Forecasts, By Industry
18.9.6.4.1. Pharmaceutical
18.9.6.4.2. Chemical
18.9.6.4.3. Manufacturing
18.9.6.4.4. Automotive
18.9.6.4.5. Paper and Print
18.9.6.4.6. Food and Beverage
18.9.6.4.7. Others
18.9.6.5. Rest of Middle East & Africa Autonomous Forklifts Market
Revenue (US$ Mn) and Forecasts, By Truck Type
18.9.6.5.1. Side Loader
18.9.6.5.2. Counterbalance Forklift
18.9.6.5.3. Telehandler
18.9.6.5.4. Rough Terrain Forklift
18.9.6.5.5. Pallet Jack
18.9.6.5.6. Walkie Stacker
18.9.6.5.7. Order Picker
18.9.6.5.8. Reach Fork Truck
18.9.6.5.9. Others
18.9.6.6. Rest of Middle East & Africa Autonomous Forklifts Market
Revenue (US$ Mn) and Forecasts, By Channel
18.9.6.6.1. OEM
18.9.6.6.2. Aftermarket
18.9.6.7. Rest of Middle East & Africa Autonomous Forklifts Market
Revenue (US$ Mn) and Forecasts, By Capacity
18.9.6.7.1. Less than 1000
18.9.6.7.2. 1000-2000
18.9.6.7.3. 2000-5000
18.9.6.7.4. Above 5000
18.10. Key Segment for Channeling Investments
18.10.1. By Country
18.10.2. By Type
18.10.3. By Fuel Source
18.10.4. By Technology
18.10.5. By Industry
18.10.6. By Truck Type
18.10.7. By Channel
18.10.8. By Capacity
19. Latin
America Autonomous Forklifts Market Analysis and Forecasts, 2019 - 2027
19.1. Overview
19.1.1. Latin America Autonomous Forklifts Market Revenue (US$ Mn)
19.2. Latin America Autonomous Forklifts Market Revenue (US$ Mn) and
Forecasts, By Type
19.2.1. Indoor
19.2.2. Outdoor
19.3. Latin America Autonomous Forklifts Market Revenue (US$ Mn) and
Forecasts, By Fuel Source
19.3.1. Electric
19.3.2. CNG
19.3.3. Petrol and Diesel
19.3.4. Fuel Cells
19.4. Latin America Autonomous Forklifts Market Revenue (US$ Mn) and
Forecasts, By Technology
19.4.1. Line Guided
19.4.2. Laser Guided
19.4.3. Vision Guided (3D)
19.4.4. Others
19.5. Latin America Autonomous Forklifts Market Revenue (US$ Mn) and
Forecasts, By Industry
19.5.1. Pharmaceutical
19.5.2. Chemical
19.5.3. Manufacturing
19.5.4. Automotive
19.5.5. Paper and Print
19.5.6. Food and Beverage
19.5.7. Others
19.6. Latin America Autonomous Forklifts Market Revenue (US$ Mn) and
Forecasts, By Truck Type
19.6.1. Side Loader
19.6.2. Counterbalance Forklift
19.6.3. Telehandler
19.6.4. Rough Terrain Forklift
19.6.5. Pallet Jack
19.6.6. Walkie Stacker
19.6.7. Order Picker
19.6.8. Reach Fork Truck
19.6.9. Others
19.7. Latin America Autonomous Forklifts Market Revenue (US$ Mn) and
Forecasts, By Channel
19.7.1. OEM
19.7.2. Aftermarket
19.8. Latin America Autonomous Forklifts Market Revenue (US$ Mn) and
Forecasts, By Capacity
19.8.1. Less than 1000
19.8.2. 1000-2000
19.8.3. 2000-5000
19.8.4. Above 5000
19.9. Latin America Autonomous Forklifts Market Revenue (US$ Mn) and
Forecasts, By Country
19.9.1. Brazil
19.9.1.1. Brazil Autonomous Forklifts Market Revenue (US$ Mn) and
Forecasts, By Type
19.9.1.1.1. Indoor
19.9.1.1.2. Outdoor
19.9.1.2. Brazil Autonomous Forklifts Market Revenue (US$ Mn) and
Forecasts, By Fuel Source
19.9.1.2.1. Electric
19.9.1.2.2. CNG
19.9.1.2.3. Petrol and Diesel
19.9.1.2.4. Fuel Cells
19.9.1.3. Brazil Autonomous Forklifts Market Revenue (US$ Mn) and
Forecasts, By Technology
19.9.1.3.1. Line Guided
19.9.1.3.2. Laser Guided
19.9.1.3.3. Vision Guided (3D)
19.9.1.3.4. Others
19.9.1.4. Brazil Autonomous Forklifts Market Revenue (US$ Mn) and
Forecasts, By Industry
19.9.1.4.1. Pharmaceutical
19.9.1.4.2. Chemical
19.9.1.4.3. Manufacturing
19.9.1.4.4. Automotive
19.9.1.4.5. Paper and Print
19.9.1.4.6. Food and Beverage
19.9.1.4.7. Others
19.9.1.5. Brazil Autonomous Forklifts Market Revenue (US$ Mn) and
Forecasts, By Truck Type
19.9.1.5.1. Side Loader
19.9.1.5.2. Counterbalance Forklift
19.9.1.5.3. Telehandler
19.9.1.5.4. Rough Terrain Forklift
19.9.1.5.5. Pallet Jack
19.9.1.5.6. Walkie Stacker
19.9.1.5.7. Order Picker
19.9.1.5.8. Reach Fork Truck
19.9.1.5.9. Others
19.9.1.6. Brazil Autonomous Forklifts Market Revenue (US$ Mn) and
Forecasts, By Channel
19.9.1.6.1. OEM
19.9.1.6.2. Aftermarket
19.9.1.7. Brazil Autonomous Forklifts Market Revenue (US$ Mn) and
Forecasts, By Capacity
19.9.1.7.1. Less than 1000
19.9.1.7.2. 1000-2000
19.9.1.7.3. 2000-5000
19.9.1.7.4. Above 5000
19.9.2. Argentina
19.9.2.1. Argentina Autonomous Forklifts Market Revenue (US$ Mn) and
Forecasts, By Type
19.9.2.1.1. Indoor
19.9.2.1.2. Outdoor
19.9.2.2. Argentina Autonomous Forklifts Market Revenue (US$ Mn) and
Forecasts, By Fuel Source
19.9.2.2.1. Electric
19.9.2.2.2. CNG
19.9.2.2.3. Petrol and Diesel
19.9.2.2.4. Fuel Cells
19.9.2.3. Argentina Autonomous Forklifts Market Revenue (US$ Mn) and
Forecasts, By Technology
19.9.2.3.1. Line Guided
19.9.2.3.2. Laser Guided
19.9.2.3.3. Vision Guided (3D)
19.9.2.3.4. Others
19.9.2.4. Argentina Autonomous Forklifts Market Revenue (US$ Mn) and
Forecasts, By Industry
19.9.2.4.1. Pharmaceutical
19.9.2.4.2. Chemical
19.9.2.4.3. Manufacturing
19.9.2.4.4. Automotive
19.9.2.4.5. Paper and Print
19.9.2.4.6. Food and Beverage
19.9.2.4.7. Others
19.9.2.5. Argentina Autonomous Forklifts Market Revenue (US$ Mn) and
Forecasts, By Truck Type
19.9.2.5.1. Side Loader
19.9.2.5.2. Counterbalance Forklift
19.9.2.5.3. Telehandler
19.9.2.5.4. Rough Terrain Forklift
19.9.2.5.5. Pallet Jack
19.9.2.5.6. Walkie Stacker
19.9.2.5.7. Order Picker
19.9.2.5.8. Reach Fork Truck
19.9.2.5.9. Others
19.9.2.6. Argentina Autonomous Forklifts Market Revenue (US$ Mn) and
Forecasts, By Channel
19.9.2.6.1. OEM
19.9.2.6.2. Aftermarket
19.9.2.7. Argentina Autonomous Forklifts Market Revenue (US$ Mn) and
Forecasts, By Capacity
19.9.2.7.1. Less than 1000
19.9.2.7.2. 1000-2000
19.9.2.7.3. 2000-5000
19.9.2.7.4. Above 5000
19.9.3. Rest of Latin America
19.9.3.1. Rest of Latin America Autonomous Forklifts Market Revenue (US$
Mn) and Forecasts, By Type
19.9.3.1.1. Indoor
19.9.3.1.2. Outdoor
19.9.3.2. Rest of Latin America Autonomous Forklifts Market Revenue (US$
Mn) and Forecasts, By Fuel Source
19.9.3.2.1. Electric
19.9.3.2.2. CNG
19.9.3.2.3. Petrol and Diesel
19.9.3.2.4. Fuel Cells
19.9.3.3. Rest of Latin America Autonomous Forklifts Market Revenue (US$
Mn) and Forecasts, By Technology
19.9.3.3.1. Line Guided
19.9.3.3.2. Laser Guided
19.9.3.3.3. Vision Guided (3D)
19.9.3.3.4. Others
19.9.3.4. Rest of Latin America Autonomous Forklifts Market Revenue (US$
Mn) and Forecasts, By Industry
19.9.3.4.1. Pharmaceutical
19.9.3.4.2. Chemical
19.9.3.4.3. Manufacturing
19.9.3.4.4. Automotive
19.9.3.4.5. Paper and Print
19.9.3.4.6. Food and Beverage
19.9.3.4.7. Others
19.9.3.5. Rest of Latin America Autonomous Forklifts Market Revenue (US$
Mn) and Forecasts, By Truck Type
19.9.3.5.1. Side Loader
19.9.3.5.2. Counterbalance Forklift
19.9.3.5.3. Telehandler
19.9.3.5.4. Rough Terrain Forklift
19.9.3.5.5. Pallet Jack
19.9.3.5.6. Walkie Stacker
19.9.3.5.7. Order Picker
19.9.3.5.8. Reach Fork Truck
19.9.3.5.9. Others
19.9.3.6. Rest of Latin America Autonomous Forklifts Market Revenue (US$
Mn) and Forecasts, By Channel
19.9.3.6.1. OEM
19.9.3.6.2. Aftermarket
19.9.3.7. Rest of Latin America Autonomous Forklifts Market Revenue (US$
Mn) and Forecasts, By Capacity
19.9.3.7.1. Less than 1000
19.9.3.7.2. 1000-2000
19.9.3.7.3. 2000-5000
19.9.3.7.4. Above 5000
19.10. Key Segment for Channeling Investments
19.10.1. By Country
19.10.2. By Type
19.10.3. By Fuel Source
19.10.4. By Technology
19.10.5. By Industry
19.10.6. By Truck Type
19.10.7. By Channel
19.10.8. By Capacity
20. Competitive
Benchmarking
20.1. Market Share Analysis, 2018
20.2. Global Presence and Growth Strategies
20.2.1. Mergers and Acquisitions
20.2.2. Product Launches
20.2.3. Investments Trends
20.2.4. R&D Initiatives
21. Player
Profiles
21.1. AB Volvo
21.1.1. Company Details
21.1.2. Company Overview
21.1.3. Product Offerings
21.1.4. Key Developments
21.1.5. Financial Analysis
21.1.6. SWOT Analysis
21.1.7. Business Strategies
21.2. Anhui Heli Co., Ltd.
21.2.1. Company Details
21.2.2. Company Overview
21.2.3. Product Offerings
21.2.4. Key Developments
21.2.5. Financial Analysis
21.2.6. SWOT Analysis
21.2.7. Business Strategies
21.3. BALYO
21.3.1. Company Details
21.3.2. Company Overview
21.3.3. Product Offerings
21.3.4. Key Developments
21.3.5. Financial Analysis
21.3.6. SWOT Analysis
21.3.7. Business Strategies
21.4. Crown Equipment Corporation
21.4.1. Company Details
21.4.2. Company Overview
21.4.3. Product Offerings
21.4.4. Key Developments
21.4.5. Financial Analysis
21.4.6. SWOT Analysis
21.4.7. Business Strategies
21.5. Dematic
21.5.1. Company Details
21.5.2. Company Overview
21.5.3. Product Offerings
21.5.4. Key Developments
21.5.5. Financial Analysis
21.5.6. SWOT Analysis
21.5.7. Business Strategies
21.6. Doosan Industrial Vehicle America Corp
21.6.1. Company Details
21.6.2. Company Overview
21.6.3. Product Offerings
21.6.4. Key Developments
21.6.5. Financial Analysis
21.6.6. SWOT Analysis
21.6.7. Business Strategies
21.7. Gen Surv Robotics
21.7.1. Company Details
21.7.2. Company Overview
21.7.3. Product Offerings
21.7.4. Key Developments
21.7.5. Financial Analysis
21.7.6. SWOT Analysis
21.7.7. Business Strategies
21.8. Godrej Material Handling
21.8.1. Company Details
21.8.2. Company Overview
21.8.3. Product Offerings
21.8.4. Key Developments
21.8.5. Financial Analysis
21.8.6. SWOT Analysis
21.8.7. Business Strategies
21.9. Hyundai Construction Equipment Co., Ltd.
21.9.1. Company Details
21.9.2. Company Overview
21.9.3. Product Offerings
21.9.4. Key Developments
21.9.5. Financial Analysis
21.9.6. SWOT Analysis
21.9.7. Business Strategies
21.10. Jungheinrich AG
21.10.1. Company Details
21.10.2. Company Overview
21.10.3. Product Offerings
21.10.4. Key Developments
21.10.5. Financial Analysis
21.10.6. SWOT Analysis
21.10.7. Business Strategies
21.11. Kollmorgen
21.11.1. Company Details
21.11.2. Company Overview
21.11.3. Product Offerings
21.11.4. Key Developments
21.11.5. Financial Analysis
21.11.6. SWOT Analysis
21.11.7. Business Strategies
21.12. Linde Material Handling
21.12.1. Company Details
21.12.2. Company Overview
21.12.3. Product Offerings
21.12.4. Key Developments
21.12.5. Financial Analysis
21.12.6. SWOT Analysis
21.12.7. Business Strategies
21.13. Mitsubishi Caterpillar Forklift America Inc.
21.13.1. Company Details
21.13.2. Company Overview
21.13.3. Product Offerings
21.13.4. Key Developments
21.13.5. Financial Analysis
21.13.6. SWOT Analysis
21.13.7. Business Strategies
21.14. Nichiyu Forklift
21.14.1. Company Details
21.14.2. Company Overview
21.14.3. Product Offerings
21.14.4. Key Developments
21.14.5. Financial Analysis
21.14.6. SWOT Analysis
21.14.7. Business Strategies
21.15. Northland Industrial Truck Company, Inc.
21.15.1. Company Details
21.15.2. Company Overview
21.15.3. Product Offerings
21.15.4. Key Developments
21.15.5. Financial Analysis
21.15.6. SWOT Analysis
21.15.7. Business Strategies
21.16. Scott
21.16.1. Company Details
21.16.2. Company Overview
21.16.3. Product Offerings
21.16.4. Key Developments
21.16.5. Financial Analysis
21.16.6. SWOT Analysis
21.16.7. Business Strategies
21.17. Seegrid Corporation
21.17.1. Company Details
21.17.2. Company Overview
21.17.3. Product Offerings
21.17.4. Key Developments
21.17.5. Financial Analysis
21.17.6. SWOT Analysis
21.17.7. Business Strategies
21.18. Swisslog Holding AG
21.18.1. Company Details
21.18.2. Company Overview
21.18.3. Product Offerings
21.18.4. Key Developments
21.18.5. Financial Analysis
21.18.6. SWOT Analysis
21.18.7. Business Strategies
21.19. TOYOTA INDUSTRIES CORPORATION
21.19.1. Company Details
21.19.2. Company Overview
21.19.3. Product Offerings
21.19.4. Key Developments
21.19.5. Financial Analysis
21.19.6. SWOT Analysis
21.19.7. Business Strategies
21.20. UniCarriers Americas Corporation
21.20.1. Company Details
21.20.2. Company Overview
21.20.3. Product Offerings
21.20.4. Key Developments
21.20.5. Financial Analysis
21.20.6. SWOT Analysis
21.20.7. Business Strategies
21.21. Other Market Participants
22. Key
Findings
Note: This ToC is tentative and can
be changed according to the research study conducted during the course of
report completion.
**Exclusive for Multi-User and
Enterprise User.
At Absolute Markets Insights, we are engaged in building both global as well as country specific reports. As a result, the approach taken for deriving the estimation and forecast for a specific country is a bit unique and different in comparison to the global research studies. In this case, we not only study the concerned market factors & trends prevailing in a particular country (from secondary research) but we also tend to calculate the actual market size & forecast from the revenue generated from the market participants involved in manufacturing or distributing the any concerned product. These companies can also be service providers. For analyzing any country specifically, we do consider the growth factors prevailing under the states/cities/county for the same. For instance, if we are analyzing an industry specific to United States, we primarily need to study about the states present under the same(where the product/service has the highest growth). Similar analysis will be followed by other countries. Our scope of the report changes with different markets.
Our research study is mainly implement through a mix of both secondary and primary research. Various sources such as industry magazines, trade journals, and government websites and trade associations are reviewed for gathering precise data. Primary interviews are conducted to validate the market size derived from secondary research. Industry experts, major manufacturers and distributors are contacted for further validation purpose on the current market penetration and growth trends.
Prominent participants in our primary research process include:
- Key Opinion Leaders namely the CEOs, CSOs, VPs, purchasing managers, amongst others
- Research and development participants, distributors/suppliers and subject matter experts
Secondary Research includes data extracted from paid data sources:
- Reuters
- Factiva
- Bloomberg
- One Source
- Hoovers
Research Methodology

Key Inclusions


