
Business Intelligence Market by Deployment (On-premises, Cloud and Hybrid); By Application (Fraud in Online Transactions, Distribution Grid, Supply Chain and Human Resource); By End Use (Banking, Financial Services and Insurance (BFSI), Power and Energy, IT and Telecom, Retail, Healthcare, Transport and Others (Education, Media and Entertainment, etc.)); By Region (U.S., Canada, Mexico, Rest of North America, UK, France, Germany, Italy, Spain, Benelux Union, Nordic Countries , Rest of Europe, China, Japan, India, South Korea, Singapore, Philippines, Indonesia, Thailand, Malaysia, Vietnam, Rest of Southeast Asia, Brazil, Argentina Rest of Latin America, GCC countries, Southern Africa, Rest of Middle East & Africa) – Global Insights, Growth, Size, Comparative Analysis, Trends and Forecast, 2019 - 2027
Industry Trends
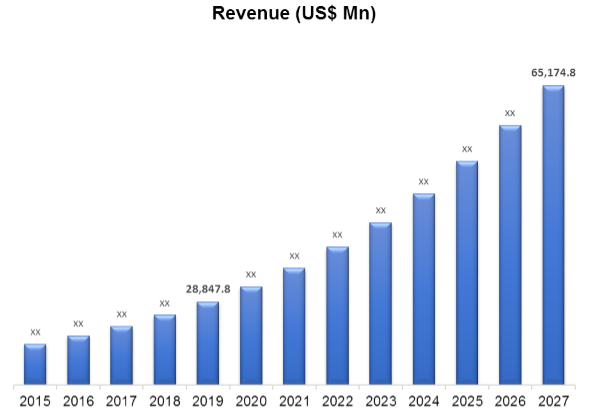
In terms of revenue, the business intelligence market was estimated to be US$ 28,847.8 Mn in 2019 and is expected to reach US$ 65,174.8 Mn by 2027 with a CAGR of 10.7% over the forecast period.
Across the globe information is generated both by humans and machines leading to increase in volume of transactions. These large volume of data are analysed and converted into market insights for decision making. To make information analysis simple, organizations are taking the help of business intelligence tools/ software which is driving the global business intelligence market. Business Intelligence is a set of well-defined processes, technologies and architecture that converts raw data into meaningful information. Business intelligence domain also includes data analytics that helps in deriving meaningful information for efficient and reliable decision-making and strategic planning from unstructured data. Business intelligence tools provide qualitative and quantitative information to an organisation. Business Intelligence not only provides solutions for businesses but it also offers services useful for identifying the flaws in the current system and suggest a possible business solution that can help decision-making for those businesses.
North America is a prominent business intelligence market among regional markets. In the region, emergence of significant industry players, intensive technology-related R&D initiatives, increased competition, data proliferation are increasing the adoption of business intelligence across companies based in North America.
Inadequate training of business intelligence modules and insufficient knowledge of the technology is posing a challenge in implementing business intelligence modules in the IT industry. A key restraint to the business intelligence market is the time taken for conversion of unstructured data to structured data which further delays the decision-making plan. Due to this factor, companies become hesitant to implement business intelligence into their existing planning and implementation systems. The study analyses the market in terms of revenue across all the major regions, which has been further bifurcated into countries.
Business Intelligence Market Revenue & Forecast, (US$ Million), 2015 – 2027
On Premise Solution Outlook:
Although there are cloud business intelligence solutions, organizations sometimes still prefer on premise deployment of business intelligence solutions due to speed of data transfer and security are the prominent reasons for preferring on premise deployment of business intelligence solutions. In general, it takes longer time to implement on-premise business intelligence solutions compared to cloud based business intelligence solutions. Enterprises producing huge amount of data and already having a private-cloud infrastructure generally tend to opt for an on premise deployment of business solutions. Secondly, security plays a vital role for choosing an on premise business intelligence solution. In cloud based business intelligence system, companies need to provide access to their IT systems to business intelligence vendors to complete the process. This creates a risk for the companies related to their sensitive data. While physical installation of a business intelligence solution might not be fool-proof but still it is easier to restrict access on a hardware then through a cloud solution. For e.g. Yellowfin, an Australian based company provides on premise BI solutions through its Enterprise Business Intelligence Platforms which not only takes care of the speed of transfer of data and its conversion into insights but it also takes care of the security factor which is important from enterprise industry perspective which is driving the global business intelligence market.
By Cloud Solution Outlook:
Business intelligence cloud applications are hosted and accessed through virtual network such as the internet. They provide BI-related features such as dashboards, business analytics and KPIs. Enterprises are turning towards implementing cloud based tools such as Customer Relationship Management (CRM), online file collaboration and storage among others. For example, Salesforce provides CRM applications, Dropbox and Box provides storage solutions and Zendesk, UserVoice provide help desk software along with business intelligence which makes the file transfer quicker, improves the quality of data and enhances report viewing business intelligence which is driving the global business intelligence market.
By Hybrid Outlook:
In large organizations, it becomes difficult to transfer volumes of data on cloud so if they want to implement business intelligence solutions, they have to select the on-premise solutions. But along-side for even faster transfer of data and limitless storage options which is provided by the cloud BI solutions, they have to consider that option as well. In such cases, the BI service providers offer a combination of on premise and cloud solutions which is known as hybrid solutions. BI solution providers such as Microsoft through Power BI data management gateway manages to combine on premise assets such as the domain controllers and data servers with cloud features such as SQL database and SQL virtual network etc. so that the business can easily shuffle through these two functions to come with faster and quicker business solutions and actionable insights which is driving the global business intelligence market.
By Fraud Detection in Online Transactions outlook:
Rise in frauds, scams and embezzlements in the banking and finance sector has become a global threat for the financial institutions. Advancement in information technology and electronic banking platform has opened gateways for cheating and money swindling. Fraudulent apps which easily get access to bank accounts through mobile is also becoming rampant. TOSAN, a company based in Iran, offers online / offline fraud detection and anti-money laundering business intelligence services which offers a variety of features such as online and real-time monitoring of processes and transactions such as credit card transactions, online banking transactions; monitoring, modification or confirmation of transactions; reducing time for data processing and improving the decision-making. This will help in reducing fraudulent transactions to an extent and the finance sector could gather actionable insights through the business intelligence modules. Thus, the increase in demand of fraud detection modules combined with business intelligence will significantly drive the BI market towards a rise in the finance and banking sector which is driving the global business intelligence market.
By Distribution Grid Outlook:
Increase in the amount of transactions across industry verticals and high volume of data getting generated and stored related to end-user entities makes the analytics task more complicated. The reporting of the data into useful information is even more challenging. There is a demand for features that could collate and analyse distribution grid data and provide insights through it. This is due to the voluminous data structures which are complex in nature. Oracle utilities network management provides this unique feature which has pre-built dashboard products. It increases the grid efficiency by generating charts, maps, graphics and trend lines with useful insights in a faster way. This utility of business intelligence combined with analytics is powerful and more efficient in helping the organization’s planning and decision-making. The product also helps managers to understand and gather the distribution grid insights during normal operations as well as unplanned outages which is driving the global business intelligence market.
By Supply Chain Outlook:
Online shopping and ecommerce growing at a swift pace poses challenges in operations and supply chain management mainly in the retail sector. It becomes extremely difficult to know the reasons for delay in shipping and transport of goods and provide solutions in such cases in the supply chain process. To handle such critical situations and to better understand costs and financial aspects mainly in transportation and logistics, business intelligence provides useful solutions and helps identify pitfalls and reasons of delay in an efficiency way and to take appropriate action based on accurate information. For e.g. Targit, a Danish company provides its services through TARGIT Decision Suite having business intelligence which integrates data from the company’s ERP, CRM modules and other relevant data sources to produce comprehensive reports and analysis to make better supply chain investments and decisions. Thus, business intelligence is playing a vital role in the field of transport and logistics which is driving the global business intelligence market.
By Human Resource Outlook:
Human resource is no more just a department which maintains the employee records, fills vacancies in the company and deals with the employee queries. It has become a vast pool of data which contains employee background details, educational history, training records, along with details related to the tasks performed by the employees. Human resource is now seen as a driver to improve company’s revenue by identifying the lacuna in the employee productivity and accordingly provide the required training to improve the same. For e.g. data pine has a modern HR (Human Resource) analytics tool which provides better data-driven decisions regarding the workforce with its business intelligence solutions. Along with the traditional features of recruiting, training and retaining the employees, this tool helps in analysing the data present in the department and provide useful data in the form of dashboards, reports and charts and suggest whether the company needs more workforce, investment in HR or it should go with a cost-cutting by reducing the employee strength, along with suggestions on productivity by analysing the day-to-day activities of the employee in the company premises and monitored over a period of time which is driving the global business intelligence market.
By Banking, Financial Services and Insurance (BFSI) Outlook:
In any financial, banking or insurance sector, information provided in a hurry or incomplete information creates chaos and confusion while taking decisions. Instead, more complete and accurate information leads to profitable incomes and better decisions. Qlik’s business intelligence data engine makes this task much easier. It breaks down complex data into smaller fragments and then analyses and provides insights for the management to take fact-based decisions. It helps to optimize the risks, understand the cost flow and accordingly maximize the profits. Another important aspect related to the finance sector is the customer experience which is now forefront on the company’s agenda in this sector. Business intelligence through analytics analyses customer behaviour patterns and understand his / her needs. It then helps to identify profitable and probable customers which is driving the global business intelligence market.
By Power and Energy Outlook:
Consumption of energy is increasing day-by-day in every industry. It has become an important task for the energy and power providers to monitor this consumption and ensure consumer satisfaction. Yellowfin business intelligence services helps to access data in real-time and provide data-based insights. It also helps to monitor energy consumption, meter the data and ensures that the compliances are properly regulated. It also helps to pinpoint new potential clients in this market. Reduced downtime, improved competence and increase in production are additional and important features included in the business intelligence solutions for this sector which is driving the global business intelligence market.
By IT and Telecom:
Huge amount of data in both structured and unstructured format is available maintained on the servers in both IT and Telecom industry. Data is captured, transmitted, stored and retrieved on a day-to-day basis. With such amount of data it becomes difficult to process and report useful information from a business planning view. Business intelligence tools quickly processes the data in both above formats and provides informative charts and dashboards which helps the managers to plan their strategies and take better decisions. For e.g. IBM provides BI solutions for the IT industry with its unique features such as connectivity with wide variety of data and data networks for retrieving databases and useful data. It also provides in-depth analysis to uncover hidden trends in the data and provide compelling data visualizations in the form of charts, graphs, maps and reports which is driving the global business intelligence market.
By Retail:
Retail industry is flourishing at a faster rate due to the rise in standard of living and an increase in consumption of the consumer goods. The other factor that is leading the retail industry is the easy of availability of goods across the channels such as online retail stores like amazon, flipkart, bigbasket, grofers, etc. Profitability of this industry depends upon targeting the correct consumer market. For identifying such a market, the consumer data, shopping behaviour, buying trends need to be correctly analysed. Business planning cannot be based on assumptions and insights based on incorrect and insufficient data. To avoid such blunders and arrive at correct decisions, the retail industry is now looking towards business intelligence. With business intelligence solution such as Necto by Panorama, the entire customer journey becomes extremely easy. Necto helps to uncover hidden insights in the data and presents them in the form of dashboards and charts. It also helps retailers to get automated insights on sudden anomalies in data such as decrease in sales and the reasons for the same. This helps the retailers to take appropriate decisions and prevents huge amount of losses. Thus, increase in demand of accurate and fact-based data is boosting the implementation of business intelligence in this sector which is driving the global business intelligence market.
By Healthcare outlook:
Business intelligence is in a great demand in the healthcare industry. This is due to the rise in need of detailed insights for better treatment of the patients. A business intelligence tool will analyse past and current data stored in databases related to the patients as well as the day-to-day diagnosis by the healthcare practitioners and provide quick insights as well the future conditions about the patient’s health through its predictive analytics module and help the practitioner to come-up with quick treatment in case of an emergency and save lives. Embee is one such business intelligence service provider who recognizes the criticality of a patient’s health and provides insights by analysing the patient’s data records, treatments provided, present health condition of the patient and likewise provides data-driven reports. It gives a hybrid solution wherein large volume of data is created and available on cloud and more sensitive data is available on-premise. The analysis tools analyse the data from both these sources and provides helpful insights. Health care is hence becoming a large market for the business intelligent service and solution providers which is driving the global business intelligence market.
By Transport outlook:
Apart from usage of road freight transport and driverless-conveyor system, the logistics and transport sector have many more facets. Although there are benefits due to internet of things, there is a challenge of rise in costs of fuel and freight. In order to identify new opportunities of business, increase profit margins and optimize the processes, logistic and transport business need to find solutions combining the above two factors of benefits and challenges. As the nature of the data available is extremely complex and distributed across various sources such as excel sheets, word documents, emails, social media and internal databases, it becomes a tedious and time-consuming task to compile such scattered data and arrive at concrete results. Business intelligence comes to rescue in such cases with its ability to compile and condense both structured and unstructured data and come up with useful insights. Cubeware is one such company in business intelligence which provides services to logistic and transport companies to achieve above business goals and become successful with data-driven decisions. Apart from above industries, business intelligence is also making its mark in the field of education, media and entertainment, etc. which is driving the global business intelligence market.
Competitive Landscape
The report provides both, qualitative and quantitative research of business intelligence market, as well as provides comprehensive insights and development methods adopted by the key contenders. The report also offers extensive research on the key players in this market and details on the competitiveness of these players. Key business strategies such as mergers and acquisitions (M&A), affiliations, collaborations, and contracts adopted by these major market participants are also recognized and analysed in the report. For each company, the report studies their global presence, competitors, service offerings and specification amongst others.
The major market players include Microsoft Azure, Oracle, IBM, SAS, SAP, Tableau Software Inc., MicroStrategy Incorporated, Salesforce.com, Inc., Qlik Tech, Dundas BI, Birst, TARGIT, Yellowfin, TIBCO Software Inc, SISENSE, CSG PRO, Accenture, Datapine, Rwebsys, TechnoScore, Hidden Brains, Coherent Solutions, TOSAN, Panorama, Embee, Bitam, GoodData, Information Builders, Looker, Logi Analytics, Domo, OmniSci, Pyramid Analytics, Klipfolio, Exago, Informatatec, Cubeware, Domo, informa, Wipro, informatec. This market will experience a series of consolidation by companies through acquisitions, collaborations, mergers and partnerships to gain a competitive edge over other market players.

Business Intelligence Market:
- By Deployment
- On Premise
- Cloud
- Hybrid
- By Application
- Fraud Detection in Online Transactions
- Distribution Grid
- Supply Chain
- Human Resource
- By End-Use
- Banking, Financial Services and Insurance (BFSI)
- Power & Energy
- IT & Telecom
- Retail
- Healthcare
- Transport
- Others (Education, Media & Entertainment, etc.)
- By Geography
- North America
- US
- Canada
- Mexico
- Rest of North America
- Europe
- France
- The UK
- Spain
- Germany
- Italy
- Nordic Countries
- Denmark
- Finland
- Iceland
- Sweden
- Norway
- Benelux Union
- Belgium
- The Netherlands
- Luxembourg
- Rest of Europe
- Asia Pacific
- China
- Japan
- India
- New Zealand
- Australia
- South Korea
- Southeast Asia
- Indonesia
- Thailand
- Malaysia
- Singapore
- Rest of Southeast Asia
- Rest of Asia Pacific
- Middle East and Africa
- Saudi Arabia
- UAE
- Egypt
- Kuwait
- South Africa
- Rest of Middle East & Africa
- Latin America
- Brazil
- Argentina
- Rest of Latin America
- North America
1.
Market
Scope
1.1.
Market
Segmentation
1.2.
Years
Considered
1.2.1. Historic Years: 2013 - 2017
1.2.2. Base Year: 2018
1.2.3. Forecast Years: 2019 – 2027
2.
Key
Target Audiences
3.
Research
Methodology
3.1.
Primary
Research
3.1.1. Research Questionnaire
3.1.2. Global Percentage Breakdown
3.1.3. Primary Interviews: Key Opinion Leaders
(KOLs)
3.2.
Secondary
Research
3.2.1. Paid Databases
3.2.2. Secondary Sources
3.3.
Market
Size Estimates
3.3.1. Top-Down Approach
3.3.2. Bottom-Up Approach
3.4.
Data
Triangulation Methodology
3.5.
Research
Assumptions
4.
Recommendations
and Insights from RNR’s Perspective**
5.
Holistic
Overview of Business Intelligence Market
6.
Market
Synopsis: Business Intelligence Market
7.
Business
Intelligence Market Analysis: Qualitative Perspective
7.1.
Introduction
7.1.1. Product Definition
7.1.2. Industry Development
7.2.
Market
Dynamics
7.2.1. Drivers
7.2.2. Restraints
7.2.3. Opportunities
7.2.4. Challenges
7.3.
Trends
in Business Intelligence Market
7.4.
Market
Determinants Radar Chart
7.5.
Macro-Economic
and Micro-Economic Indicators: Business Intelligence Market
7.6.
Industry
Gross Margin Overview
7.7.
Porter’s
Five Force Analysis
7.8.
PESTEL
Analysis
7.9.
Value
Chain Analysis
7.10. Pricing Analysis, By Region (2017 and 2018)
7.10.1. North America
7.10.1.1.
U.S
7.10.1.2.
Canada
7.10.1.3.
Mexico
7.10.1.4.
Rest of
North America
7.10.2. Europe
7.10.2.1.
France
7.10.2.2.
The UK
7.10.2.3.
Spain
7.10.2.4.
Germany
7.10.2.5.
Italy
7.10.2.6.
Nordic
Countries
7.10.2.6.1. Denmark
7.10.2.6.2. Finland
7.10.2.6.3. Iceland
7.10.2.6.4. Sweden
7.10.2.6.5. Norway
7.10.2.7.
Benelux
Union
7.10.2.7.1. Belgium
7.10.2.7.2. The Netherlands
7.10.2.7.3. Luxembourg
7.10.2.8.
Rest of
Europe
7.10.3. Asia Pacific
7.10.3.1.
China
7.10.3.2.
Japan
7.10.3.3.
India
7.10.3.4.
New
Zealand
7.10.3.5.
Australia
7.10.3.6.
South
Korea
7.10.3.7.
Southeast
Asia
7.10.3.7.1. Indonesia
7.10.3.7.2. Thailand
7.10.3.7.3. Malaysia
7.10.3.7.4. Singapore
7.10.3.7.5. Rest of Southeast Asia
7.10.3.8.
Rest of
Asia Pacific
7.10.4. Middle East and Africa
7.10.4.1.
Saudi
Arabia
7.10.4.2.
UAE
7.10.4.3.
Egypt
7.10.4.4.
Kuwait
7.10.4.5.
South
Africa
7.10.4.6.
Rest of
Middle East & Africa
7.10.5. Latin America
7.10.5.1.
Brazil
7.10.5.2.
Argentina
7.10.5.3.
Rest of
Latin America
8.
Global
Business Intelligence Market Analysis and Forecasts, 2019 – 2027
8.1.
Overview
8.1.1. Global Business Intelligence Market Revenue
(US$ Mn)
8.2.
Global
Business Intelligence Market Revenue (US$ Mn) and Forecasts, By Application
8.2.1. Fraud Detection in Online Transactions
8.2.1.1.
Definition
8.2.1.2.
Market
Estimation and Penetration, 2013 – 2018
8.2.1.3.
Market
Forecast, 2019 – 2027
8.2.1.4.
Compound
Annual Growth Rate (CAGR)
8.2.1.5.
Regional
Bifurcation
8.2.1.5.1. North America
8.2.1.5.1.1. Market Estimation, 2013 – 2018
8.2.1.5.1.2. Market Forecast, 2019 – 2027
8.2.1.5.2. Europe
8.2.1.5.2.1. Market Estimation, 2013 – 2018
8.2.1.5.2.2. Market Forecast, 2019 – 2027
8.2.1.5.3. Asia Pacific
8.2.1.5.3.1. Market Estimation, 2013 – 2018
8.2.1.5.3.2. Market Forecast, 2019 – 2027
8.2.1.5.4. Middle East and Africa
8.2.1.5.4.1. Market Estimation, 2013 – 2018
8.2.1.5.4.2. Market Forecast, 2019 – 2027
8.2.1.5.5. Latin America
8.2.1.5.5.1. Market Estimation, 2013 – 2018
8.2.1.5.5.2. Market Forecast, 2019 – 2027
8.2.2. Distribution Grid
8.2.2.1.
Definition
8.2.2.2.
Market
Estimation and Penetration, 2013 – 2018
8.2.2.3.
Market
Forecast, 2019 – 2027
8.2.2.4.
Compound
Annual Growth Rate (CAGR)
8.2.2.5.
Regional
Bifurcation
8.2.2.5.1. North America
8.2.2.5.1.1. Market Estimation, 2013 – 2018
8.2.2.5.1.2. Market Forecast, 2019 – 2027
8.2.2.5.2. Europe
8.2.2.5.2.1. Market Estimation, 2013 – 2018
8.2.2.5.2.2. Market Forecast, 2019 – 2027
8.2.2.5.3. Asia Pacific
8.2.2.5.3.1. Market Estimation, 2013 – 2018
8.2.2.5.3.2. Market Forecast, 2019 – 2027
8.2.2.5.4. Middle East and Africa
8.2.2.5.4.1. Market Estimation, 2013 – 2018
8.2.2.5.4.2. Market Forecast, 2019 – 2027
8.2.2.5.5. Latin America
8.2.2.5.5.1. Market Estimation, 2013 – 2018
8.2.2.5.5.2. Market Forecast, 2019 – 2027
8.2.3. Supply Chain
8.2.3.1.
Definition
8.2.3.2.
Market
Estimation and Penetration, 2013 – 2018
8.2.3.3.
Market
Forecast, 2019 – 2027
8.2.3.4.
Compound
Annual Growth Rate (CAGR)
8.2.3.5.
Regional
Bifurcation
8.2.3.5.1. North America
8.2.3.5.1.1. Market Estimation, 2013 – 2018
8.2.3.5.1.2. Market Forecast, 2019 – 2027
8.2.3.5.2. Europe
8.2.3.5.2.1. Market Estimation, 2013 – 2018
8.2.3.5.2.2. Market Forecast, 2019 – 2027
8.2.3.5.3. Asia Pacific
8.2.3.5.3.1. Market Estimation, 2013 – 2018
8.2.3.5.3.2. Market Forecast, 2019 – 2027
8.2.3.5.4. Middle East and Africa
8.2.3.5.4.1. Market Estimation, 2013 – 2018
8.2.3.5.4.2. Market Forecast, 2019 – 2027
8.2.3.5.5. Latin America
8.2.3.5.5.1. Market Estimation, 2013 – 2018
8.2.3.5.5.2. Market Forecast, 2019 – 2027
8.2.4. Human Resource
8.2.4.1.
Definition
8.2.4.2.
Market Estimation
and Penetration, 2013 – 2018
8.2.4.3.
Market
Forecast, 2019 – 2027
8.2.4.4.
Compound
Annual Growth Rate (CAGR)
8.2.4.5.
Regional
Bifurcation
8.2.4.5.1. North America
8.2.4.5.1.1. Market Estimation, 2013 – 2018
8.2.4.5.1.2. Market Forecast, 2019 – 2027
8.2.4.5.2. Europe
8.2.4.5.2.1. Market Estimation, 2013 – 2018
8.2.4.5.2.2. Market Forecast, 2019 – 2027
8.2.4.5.3. Asia Pacific
8.2.4.5.3.1. Market Estimation, 2013 – 2018
8.2.4.5.3.2. Market Forecast, 2019 – 2027
8.2.4.5.4. Middle East and Africa
8.2.4.5.4.1. Market Estimation, 2013 – 2018
8.2.4.5.4.2. Market Forecast, 2019 – 2027
8.2.4.5.5. Latin America
8.2.4.5.5.1. Market Estimation, 2013 – 2018
8.2.4.5.5.2. Market Forecast, 2019 – 2027
8.3.
Key Segment
for Channeling Investments
8.3.1. By Application
9.
Global
Business Intelligence Market Analysis and Forecasts, 2019 – 2027
9.1.
Overview
9.2.
Global
Business Intelligence Market Revenue (US$ Mn) and Forecasts, By Deployment Mode
9.2.1. On Premise
9.2.1.1.
Definition
9.2.1.2.
Market
Estimation and Penetration, 2013 – 2018
9.2.1.3.
Market
Forecast, 2019 – 2027
9.2.1.4.
Compound
Annual Growth Rate (CAGR)
9.2.1.5.
Regional
Bifurcation
9.2.1.5.1. North America
9.2.1.5.1.1. Market Estimation, 2013 – 2018
9.2.1.5.1.2. Market Forecast, 2019 – 2027
9.2.1.5.2. Europe
9.2.1.5.2.1. Market Estimation, 2013 – 2018
9.2.1.5.2.2. Market Forecast, 2019 – 2027
9.2.1.5.3. Asia Pacific
9.2.1.5.3.1. Market Estimation, 2013 – 2018
9.2.1.5.3.2. Market Forecast, 2019 – 2027
9.2.1.5.4. Middle East and Africa
9.2.1.5.4.1. Market Estimation, 2013 – 2018
9.2.1.5.4.2. Market Forecast, 2019 – 2027
9.2.1.5.5. Latin America
9.2.1.5.5.1. Market Estimation, 2013 – 2018
9.2.1.5.5.2. Market Forecast, 2019 – 2027
9.2.2. Cloud
9.2.2.1.
Definition
9.2.2.2.
Market
Estimation and Penetration, 2013 – 2018
9.2.2.3.
Market
Forecast, 2019 – 2027
9.2.2.4.
Compound
Annual Growth Rate (CAGR)
9.2.2.5.
Regional
Bifurcation
9.2.2.5.1. North America
9.2.2.5.1.1. Market Estimation, 2013 – 2018
9.2.2.5.1.2. Market Forecast, 2019 – 2027
9.2.2.5.2. Europe
9.2.2.5.2.1. Market Estimation, 2013 – 2018
9.2.2.5.2.2. Market Forecast, 2019 – 2027
9.2.2.5.3. Asia Pacific
9.2.2.5.3.1. Market Estimation, 2013 – 2018
9.2.2.5.3.2. Market Forecast, 2019 – 2027
9.2.2.5.4. Middle East and Africa
9.2.2.5.4.1. Market Estimation, 2013 – 2018
9.2.2.5.4.2. Market Forecast, 2019 – 2027
9.2.2.5.5. Latin America
9.2.2.5.5.1. Market Estimation, 2013 – 2018
9.2.2.5.5.2. Market Forecast, 2019 – 2027
9.2.3. Hybrid
9.2.3.1.
Definition
9.2.3.2.
Market
Estimation and Penetration, 2013 – 2018
9.2.3.3.
Market
Forecast, 2019 – 2027
9.2.3.4.
Compound
Annual Growth Rate (CAGR)
9.2.3.5.
Regional
Bifurcation
9.2.3.5.1. North America
9.2.3.5.1.1. Market Estimation, 2013 – 2018
9.2.3.5.1.2. Market Forecast, 2019 – 2027
9.2.3.5.2. Europe
9.2.3.5.2.1. Market Estimation, 2013 – 2018
9.2.3.5.2.2. Market Forecast, 2019 – 2027
9.2.3.5.3. Asia Pacific
9.2.3.5.3.1. Market Estimation, 2013 – 2018
9.2.3.5.3.2. Market Forecast, 2019 – 2027
9.2.3.5.4. Middle East and Africa
9.2.3.5.4.1. Market Estimation, 2013 – 2018
9.2.3.5.4.2. Market Forecast, 2019 – 2027
9.2.3.5.5. Latin America
9.2.3.5.5.1. Market Estimation, 2013 – 2018
9.2.3.5.5.2. Market Forecast, 2019 – 2027
9.3.
Key
Segment for Channeling Investments
9.3.1. By Deployment Mode
10. Global Business Intelligence Market Analysis
and Forecasts, 2019 – 2027
10.1. Overview
10.2. Global Business Intelligence Market Revenue
(US$ Mn) and Forecasts, By End-Use
10.2.1. Banking, Financial Services and Insurance
(BFSI)
10.2.1.1.
Definition
10.2.1.2.
Market
Estimation and Penetration, 2013 – 2018
10.2.1.3.
Market
Forecast, 2019 – 2027
10.2.1.4.
Compound
Annual Growth Rate (CAGR)
10.2.1.5.
Regional
Bifurcation
10.2.1.5.1. North America
10.2.1.5.1.1. Market Estimation, 2013 – 2018
10.2.1.5.1.2. Market Forecast, 2019 – 2027
10.2.1.5.2. Europe
10.2.1.5.2.1. Market Estimation, 2013 – 2018
10.2.1.5.2.2. Market Forecast, 2019 – 2027
10.2.1.5.3. Asia Pacific
10.2.1.5.3.1. Market Estimation, 2013 – 2018
10.2.1.5.3.2. Market Forecast, 2019 – 2027
10.2.1.5.4. Middle East and Africa
10.2.1.5.4.1. Market Estimation, 2013 – 2018
10.2.1.5.4.2. Market Forecast, 2019 – 2027
10.2.1.5.5. Latin America
10.2.1.5.5.1. Market Estimation, 2013 – 2018
10.2.1.5.5.2. Market Forecast, 2019 – 2027
10.2.2. Power and Energy
10.2.2.1.
Definition
10.2.2.2.
Market
Estimation and Penetration, 2013 – 2018
10.2.2.3.
Market
Forecast, 2019 – 2027
10.2.2.4.
Compound
Annual Growth Rate (CAGR)
10.2.2.5.
Regional
Bifurcation
10.2.2.5.1. North America
10.2.2.5.1.1. Market Estimation, 2013 – 2018
10.2.2.5.1.2. Market Forecast, 2019 – 2027
10.2.2.5.2. Europe
10.2.2.5.2.1. Market Estimation, 2013 – 2018
10.2.2.5.2.2. Market Forecast, 2019 – 2027
10.2.2.5.3. Asia Pacific
10.2.2.5.3.1. Market Estimation, 2013 – 2018
10.2.2.5.3.2. Market Forecast, 2019 – 2027
10.2.2.5.4. Middle East and Africa
10.2.2.5.4.1. Market Estimation, 2013 – 2018
10.2.2.5.4.2. Market Forecast, 2019 – 2027
10.2.2.5.5. Latin America
10.2.2.5.5.1. Market Estimation, 2013 – 2018
10.2.2.5.5.2. Market Forecast, 2019 – 2027
10.2.3. IT and Telecom
10.2.3.1.
Definition
10.2.3.2.
Market
Estimation and Penetration, 2013 – 2018
10.2.3.3.
Market
Forecast, 2019 – 2027
10.2.3.4.
Compound
Annual Growth Rate (CAGR)
10.2.3.5.
Regional
Bifurcation
10.2.3.5.1. North America
10.2.3.5.1.1. Market Estimation, 2013 – 2018
10.2.3.5.1.2. Market Forecast, 2019 – 2027
10.2.3.5.2. Europe
10.2.3.5.2.1. Market Estimation, 2013 – 2018
10.2.3.5.2.2. Market Forecast, 2019 – 2027
10.2.3.5.3. Asia Pacific
10.2.3.5.3.1. Market Estimation, 2013 – 2018
10.2.3.5.3.2. Market Forecast, 2019 – 2027
10.2.3.5.4. Middle East and Africa
10.2.3.5.4.1. Market Estimation, 2013 – 2018
10.2.3.5.4.2. Market Forecast, 2019 – 2027
10.2.3.5.5. Latin America
10.2.3.5.5.1. Market Estimation, 2013 – 2018
10.2.3.5.5.2. Market Forecast, 2019 – 2027
10.2.4. Retail
10.2.4.1.
Definition
10.2.4.2.
Market
Estimation and Penetration, 2013 – 2018
10.2.4.3.
Market
Forecast, 2019 – 2027
10.2.4.4.
Compound
Annual Growth Rate (CAGR)
10.2.4.5.
Regional
Bifurcation
10.2.4.5.1. North America
10.2.4.5.1.1. Market Estimation, 2013 – 2018
10.2.4.5.1.2. Market Forecast, 2019 – 2027
10.2.4.5.2. Europe
10.2.4.5.2.1. Market Estimation, 2013 – 2018
10.2.4.5.2.2. Market Forecast, 2019 – 2027
10.2.4.5.3. Asia Pacific
10.2.4.5.3.1. Market Estimation, 2013 – 2018
10.2.4.5.3.2. Market Forecast, 2019 – 2027
10.2.4.5.4. Middle East and Africa
10.2.4.5.4.1. Market Estimation, 2013 – 2018
10.2.4.5.4.2. Market Forecast, 2019 – 2027
10.2.4.5.5. Latin America
10.2.4.5.5.1. Market Estimation, 2013 – 2018
10.2.4.5.5.2. Market Forecast, 2019 – 2027
10.2.5. Healthcare
10.2.5.1.
Definition
10.2.5.2.
Market
Estimation and Penetration, 2013 – 2018
10.2.5.3.
Market
Forecast, 2019 – 2027
10.2.5.4.
Compound
Annual Growth Rate (CAGR)
10.2.5.5.
Regional
Bifurcation
10.2.5.5.1. North America
10.2.5.5.1.1. Market Estimation, 2013 – 2018
10.2.5.5.1.2. Market Forecast, 2019 – 2027
10.2.5.5.2. Europe
10.2.5.5.2.1. Market Estimation, 2013 – 2018
10.2.5.5.2.2. Market Forecast, 2019 – 2027
10.2.5.5.3. Asia Pacific
10.2.5.5.3.1. Market Estimation, 2013 – 2018
10.2.5.5.3.2. Market Forecast, 2019 – 2027
10.2.5.5.4. Middle East and Africa
10.2.5.5.4.1. Market Estimation, 2013 – 2018
10.2.5.5.4.2. Market Forecast, 2019 – 2027
10.2.5.5.5. Latin America
10.2.5.5.5.1. Market Estimation, 2013 – 2018
10.2.5.5.5.2. Market Forecast, 2019 – 2027
10.2.6. Transport
10.2.6.1.
Definition
10.2.6.2.
Market
Estimation and Penetration, 2013 – 2018
10.2.6.3.
Market
Forecast, 2019 – 2027
10.2.6.4.
Compound
Annual Growth Rate (CAGR)
10.2.6.5.
Regional
Bifurcation
10.2.6.5.1. North America
10.2.6.5.1.1. Market Estimation, 2013 – 2018
10.2.6.5.1.2. Market Forecast, 2019 – 2027
10.2.6.5.2. Europe
10.2.6.5.2.1. Market Estimation, 2013 – 2018
10.2.6.5.2.2. Market Forecast, 2019 – 2027
10.2.6.5.3. Asia Pacific
10.2.6.5.3.1. Market Estimation, 2013 – 2018
10.2.6.5.3.2. Market Forecast, 2019 – 2027
10.2.6.5.4. Middle East and Africa
10.2.6.5.4.1. Market Estimation, 2013 – 2018
10.2.6.5.4.2. Market Forecast, 2019 – 2027
10.2.6.5.5. Latin America
10.2.6.5.5.1. Market Estimation, 2013 – 2018
10.2.6.5.5.2. Market Forecast, 2019 – 2027
10.2.7. Others (Education, Media and Entertainment,
etc.)
10.2.7.1.
Definition
10.2.7.2.
Market
Estimation and Penetration, 2013 – 2018
10.2.7.3.
Market
Forecast, 2019 – 2027
10.2.7.4.
Compound
Annual Growth Rate (CAGR)
10.2.7.5.
Regional
Bifurcation
10.2.7.5.1. North America
10.2.7.5.1.1. Market Estimation, 2013 – 2018
10.2.7.5.1.2. Market Forecast, 2019 – 2027
10.2.7.5.2. Europe
10.2.7.5.2.1. Market Estimation, 2013 – 2018
10.2.7.5.2.2. Market Forecast, 2019 – 2027
10.2.7.5.3. Asia Pacific
10.2.7.5.3.1. Market Estimation, 2013 – 2018
10.2.7.5.3.2. Market Forecast, 2019 – 2027
10.2.7.5.4. Middle East and Africa
10.2.7.5.4.1. Market Estimation, 2013 – 2018
10.2.7.5.4.2. Market Forecast, 2019 – 2027
10.2.7.5.5. Latin America
10.2.7.5.5.1. Market Estimation, 2013 – 2018
10.2.7.5.5.2. Market Forecast, 2019 – 2027
10.3. Key Segment for Channeling Investments
10.3.1. By End-Use
11. North America Business Intelligence Market
Analysis and Forecasts, 2019 - 2027
11.1. Overview
11.1.1. North America Business Intelligence Market
Revenue (US$ Mn)
11.2. North America Business Intelligence Market
Revenue (US$ Mn) and Forecasts, By Application
11.2.1. Fraud Detection in Online Transactions
11.2.2. Distribution Grid
11.2.3. Supply Chain
11.2.4. Human Resource
11.3. North America Business Intelligence Market
Revenue (US$ Mn) and Forecasts, By Deployment Mode
11.3.1. On Premise
11.3.2. Cloud
11.3.3. Hybrid
11.4. North America Business Intelligence Market
Revenue (US$ Mn) and Forecasts, By End-Use
11.4.1. Banking, Financial Services and Insurance
(BFSI)
11.4.2. Power and Energy
11.4.3. IT and Telecom
11.4.4. Retail
11.4.5. Healthcare
11.4.6. Transport
11.4.7. Others (Education, Media and Entertainment,
etc.)
11.5. North America Business Intelligence Market
Revenue (US$ Mn) and Forecasts, By Country
11.5.1. U.S
11.5.1.1.
U.S
Business Intelligence Market Revenue (US$ Mn) and Forecasts, By Application
11.5.1.1.1. Fraud Detection in Online Transactions
11.5.1.1.2. Distribution Grid
11.5.1.1.3. Supply Chain
11.5.1.1.4. Human Resource
11.5.1.2.
U.S
Business Intelligence Market Revenue (US$ Mn) and Forecasts, By Deployment Mode
11.5.1.2.1. On Premise
11.5.1.2.2. Cloud
11.5.1.2.3. Hybrid
11.5.1.3.
U.S
Business Intelligence Market Revenue (US$ Mn) and Forecasts, By End-Use
11.5.1.3.1. Banking, Financial Services and Insurance
(BFSI)
11.5.1.3.2. Power and Energy
11.5.1.3.3. IT and Telecom
11.5.1.3.4. Retail
11.5.1.3.5. Healthcare
11.5.1.3.6. Transport
11.5.1.3.7. Others (Education, Media and Entertainment,
etc.)
11.5.2. Canada
11.5.2.1.
Canada
Business Intelligence Market Revenue (US$ Mn) and Forecasts, By Application
11.5.2.1.1. Fraud Detection in Online Transactions
11.5.2.1.2. Distribution Grid
11.5.2.1.3. Supply Chain
11.5.2.1.4. Human Resource
11.5.2.2.
Canada
Business Intelligence Market Revenue (US$ Mn) and Forecasts, By Deployment Mode
11.5.2.2.1. On Premise
11.5.2.2.2. Cloud
11.5.2.2.3. Hybrid
11.5.2.3.
Canada
Business Intelligence Market Revenue (US$ Mn) and Forecasts, By End-Use
11.5.2.3.1. Banking, Financial Services and Insurance
(BFSI)
11.5.2.3.2. Power and Energy
11.5.2.3.3. IT and Telecom
11.5.2.3.4. Retail
11.5.2.3.5. Healthcare
11.5.2.3.6. Transport
11.5.2.3.7. Others (Education, Media and Entertainment,
etc.)
11.5.3. Mexico
11.5.3.1.
Mexico
Business Intelligence Market Revenue (US$ Mn) and Forecasts, By Application
11.5.3.1.1. Fraud Detection in Online Transactions
11.5.3.1.2. Distribution Grid
11.5.3.1.3. Supply Chain
11.5.3.1.4. Human Resource
11.5.3.2.
Mexico
Business Intelligence Market Revenue (US$ Mn) and Forecasts, By Deployment Mode
11.5.3.2.1. On Premise
11.5.3.2.2. Cloud
11.5.3.2.3. Hybrid
11.5.3.3.
Mexico
Business Intelligence Market Revenue (US$ Mn) and Forecasts, By End-Use
11.5.3.3.1. Banking, Financial Services and Insurance
(BFSI)
11.5.3.3.2. Power and Energy
11.5.3.3.3. IT and Telecom
11.5.3.3.4. Retail
11.5.3.3.5. Healthcare
11.5.3.3.6. Transport
11.5.3.3.7. Others (Education, Media and Entertainment,
etc.)
11.5.4. Rest of North America
11.5.4.1.
Rest of
North America Business Intelligence Market Revenue (US$ Mn) and Forecasts, By
Application
11.5.4.1.1. Fraud Detection in Online Transactions
11.5.4.1.2. Distribution Grid
11.5.4.1.3. Supply Chain
11.5.4.1.4. Human Resource
11.5.4.2.
Rest of
North America Business Intelligence Market Revenue (US$ Mn) and Forecasts, By
Deployment Mode
11.5.4.2.1. On Premise
11.5.4.2.2. Cloud
11.5.4.2.3. Hybrid
11.5.4.3.
Rest of
North America Business Intelligence Market Revenue (US$ Mn) and Forecasts, By
End-Use
11.5.4.3.1. Banking, Financial Services and Insurance
(BFSI)
11.5.4.3.2. Power and Energy
11.5.4.3.3. IT and Telecom
11.5.4.3.4. Retail
11.5.4.3.5. Healthcare
11.5.4.3.6. Transport
11.5.4.3.7. Others (Education, Media and Entertainment,
etc.)
11.6. Key Segment for Channeling Investments
11.6.1. By Country
11.6.2. By Application
11.6.3. By Deployment Mode
11.6.4. By End-Use
12. Europe Business Intelligence Market Analysis
and Forecasts, 2019 - 2027
12.1. Overview
12.1.1. Europe Business Intelligence Market Revenue
(US$ Mn)
12.2. Europe Business Intelligence Market Revenue
(US$ Mn) and Forecasts, By Application
12.2.1. Fraud Detection in Online Transactions
12.2.2. Distribution Grid
12.2.3. Supply Chain
12.2.4. Human Resource
12.3. Europe Business Intelligence Market Revenue
(US$ Mn) and Forecasts, By Deployment Mode
12.3.1. On Premise
12.3.2. Cloud
12.3.3. Hybrid
12.4. Europe Business Intelligence Market Revenue
(US$ Mn) and Forecasts, By End-Use
12.4.1. Banking, Financial Services and Insurance
(BFSI)
12.4.2. Power and Energy
12.4.3. IT and Telecom
12.4.4. Retail
12.4.5. Healthcare
12.4.6. Transport
12.4.7. Others (Education, Media and Entertainment,
etc.)
12.5. Europe Business Intelligence Market Revenue
(US$ Mn) and Forecasts, By Country
12.5.1. France
12.5.1.1.
France
Business Intelligence Market Revenue (US$ Mn) and Forecasts, By Application
12.5.1.1.1. Fraud Detection in Online Transactions
12.5.1.1.2. Distribution Grid
12.5.1.1.3. Supply Chain
12.5.1.1.4. Human Resource
12.5.1.2.
France
Business Intelligence Market Revenue (US$ Mn) and Forecasts, By Deployment Mode
12.5.1.2.1. On Premise
12.5.1.2.2. Cloud
12.5.1.2.3. Hybrid
12.5.1.3.
France
Business Intelligence Market Revenue (US$ Mn) and Forecasts, By End-Use
12.5.1.3.1. Banking, Financial Services and Insurance
(BFSI)
12.5.1.3.2. Power and Energy
12.5.1.3.3. IT and Telecom
12.5.1.3.4. Retail
12.5.1.3.5. Healthcare
12.5.1.3.6. Transport
12.5.1.3.7. Others (Education, Media and Entertainment,
etc.)
12.5.2. The UK
12.5.2.1.
The UK
Business Intelligence Market Revenue (US$ Mn) and Forecasts, By Application
12.5.2.1.1. Fraud Detection in Online Transactions
12.5.2.1.2. Distribution Grid
12.5.2.1.3. Supply Chain
12.5.2.1.4. Human Resource
12.5.2.2.
The UK
Business Intelligence Market Revenue (US$ Mn) and Forecasts, By Deployment Mode
12.5.2.2.1. On Premise
12.5.2.2.2. Cloud
12.5.2.2.3. Hybrid
12.5.2.3.
The UK
Business Intelligence Market Revenue (US$ Mn) and Forecasts, By End-Use
12.5.2.3.1. Banking, Financial Services and Insurance
(BFSI)
12.5.2.3.2. Power and Energy
12.5.2.3.3. IT and Telecom
12.5.2.3.4. Retail
12.5.2.3.5. Healthcare
12.5.2.3.6. Transport
12.5.2.3.7. Others (Education, Media and Entertainment,
etc.)
12.5.3. Spain
12.5.3.1.
Spain
Business Intelligence Market Revenue (US$ Mn) and Forecasts, By Application
12.5.3.1.1. Fraud Detection in Online Transactions
12.5.3.1.2. Distribution Grid
12.5.3.1.3. Supply Chain
12.5.3.1.4. Human Resource
12.5.3.2.
Spain Business
Intelligence Market Revenue (US$ Mn) and Forecasts, By Deployment Mode
12.5.3.2.1. On Premise
12.5.3.2.2. Cloud
12.5.3.2.3. Hybrid
12.5.3.3.
Spain
Business Intelligence Market Revenue (US$ Mn) and Forecasts, By End-Use
12.5.3.3.1. Banking, Financial Services and Insurance
(BFSI)
12.5.3.3.2. Power and Energy
12.5.3.3.3. IT and Telecom
12.5.3.3.4. Retail
12.5.3.3.5. Healthcare
12.5.3.3.6. Transport
12.5.3.3.7. Others (Education, Media and Entertainment,
etc.)
12.5.4. Germany
12.5.4.1.
Germany
Business Intelligence Market Revenue (US$ Mn) and Forecasts, By Application
12.5.4.1.1. Fraud Detection in Online Transactions
12.5.4.1.2. Distribution Grid
12.5.4.1.3. Supply Chain
12.5.4.1.4. Human Resource
12.5.4.2.
Germany
Business Intelligence Market Revenue (US$ Mn) and Forecasts, By Deployment Mode
12.5.4.2.1. On Premise
12.5.4.2.2. Cloud
12.5.4.2.3. Hybrid
12.5.4.3.
Germany
Business Intelligence Market Revenue (US$ Mn) and Forecasts, By End-Use
12.5.4.3.1. Banking, Financial Services and Insurance
(BFSI)
12.5.4.3.2. Power and Energy
12.5.4.3.3. IT and Telecom
12.5.4.3.4. Retail
12.5.4.3.5. Healthcare
12.5.4.3.6. Transport
12.5.4.3.7. Others (Education, Media and Entertainment,
etc.)
12.5.5. Italy
12.5.5.1.
Italy
Business Intelligence Market Revenue (US$ Mn) and Forecasts, By Application
12.5.5.1.1. Fraud Detection in Online Transactions
12.5.5.1.2. Distribution Grid
12.5.5.1.3. Supply Chain
12.5.5.1.4. Human Resource
12.5.5.2.
Italy
Business Intelligence Market Revenue (US$ Mn) and Forecasts, By Deployment Mode
12.5.5.2.1. On Premise
12.5.5.2.2. Cloud
12.5.5.2.3. Hybrid
12.5.5.3.
Italy
Business Intelligence Market Revenue (US$ Mn) and Forecasts, By End-Use
12.5.5.3.1. Banking, Financial Services and Insurance
(BFSI)
12.5.5.3.2. Power and Energy
12.5.5.3.3. IT and Telecom
12.5.5.3.4. Retail
12.5.5.3.5. Healthcare
12.5.5.3.6. Transport
12.5.5.3.7. Others (Education, Media and Entertainment,
etc.)
12.5.6. Nordic Countries
12.5.6.1.
Nordic
Countries Business Intelligence Market Revenue (US$ Mn) and Forecasts, By
Application
12.5.6.1.1. Fraud Detection in Online Transactions
12.5.6.1.2. Distribution Grid
12.5.6.1.3. Supply Chain
12.5.6.1.4. Human Resource
12.5.6.2.
Nordic
Countries Business Intelligence Market Revenue (US$ Mn) and Forecasts, By
Deployment Mode
12.5.6.2.1. On Premise
12.5.6.2.2. Cloud
12.5.6.2.3. Hybrid
12.5.6.3.
Nordic
Countries Business Intelligence Market Revenue (US$ Mn) and Forecasts, By End-Use
12.5.6.3.1. Banking, Financial Services and Insurance
(BFSI)
12.5.6.3.2. Power and Energy
12.5.6.3.3. IT and Telecom
12.5.6.3.4. Retail
12.5.6.3.5. Healthcare
12.5.6.3.6. Transport
12.5.6.3.7. Others (Education, Media and Entertainment,
etc.)
12.5.6.4.
Nordic
Countries Business Intelligence Market Revenue (US$ Mn) and Forecasts, By
Country
12.5.6.4.1. Denmark
12.5.6.4.2. Finland
12.5.6.4.3. Iceland
12.5.6.4.4. Sweden
12.5.6.4.5. Norway
12.5.7. Benelux Union
12.5.7.1.
Benelux
Union Business Intelligence Market Revenue (US$ Mn) and Forecasts, By
Application
12.5.7.1.1. Fraud Detection in Online Transactions
12.5.7.1.2. Distribution Grid
12.5.7.1.3. Supply Chain
12.5.7.1.4. Human Resource
12.5.7.2.
Benelux
Union Business Intelligence Market Revenue (US$ Mn) and Forecasts, By
Deployment Mode
12.5.7.2.1. On Premise
12.5.7.2.2. Cloud
12.5.7.2.3. Hybrid
12.5.7.3.
Benelux
Union Business Intelligence Market Revenue (US$ Mn) and Forecasts, By End-Use
12.5.7.3.1. Banking, Financial Services and Insurance
(BFSI)
12.5.7.3.2. Power and Energy
12.5.7.3.3. IT and Telecom
12.5.7.3.4. Retail
12.5.7.3.5. Healthcare
12.5.7.3.6. Transport
12.5.7.3.7. Others (Education, Media and Entertainment,
etc.)
12.5.7.4.
Benelux
Union Business Intelligence Market Revenue (US$ Mn) and Forecasts, By Country
12.5.7.4.1. Belgium
12.5.7.4.2. The Netherlands
12.5.7.4.3. Luxembourg
12.5.8. Rest of Europe
12.5.8.1.
Rest of
Europe Business Intelligence Market Revenue (US$ Mn) and Forecasts, By
Application
12.5.8.1.1. Fraud Detection in Online Transactions
12.5.8.1.2. Distribution Grid
12.5.8.1.3. Supply Chain
12.5.8.1.4. Human Resource
12.5.8.2.
Rest of
Europe Business Intelligence Market Revenue (US$ Mn) and Forecasts, By
Deployment Mode
12.5.8.2.1. On Premise
12.5.8.2.2. Cloud
12.5.8.2.3. Hybrid
12.5.8.3.
Rest of
Europe Business Intelligence Market Revenue (US$ Mn) and Forecasts, By End-Use
12.5.8.3.1. Banking, Financial Services and Insurance
(BFSI)
12.5.8.3.2. Power and Energy
12.5.8.3.3. IT and Telecom
12.5.8.3.4. Retail
12.5.8.3.5. Healthcare
12.5.8.3.6. Transport
12.5.8.3.7. Others (Education, Media and Entertainment,
etc.)
12.6. Key Segment for Channeling Investments
12.6.1. By Country
12.6.2. By Application
12.6.3. By Deployment Mode
12.6.4. By End-Use
13. Asia Pacific Business Intelligence Market
Analysis and Forecasts, 2019 - 2027
13.1. Overview
13.1.1. Asia Pacific Business Intelligence Market
Revenue (US$ Mn)
13.2. Asia Pacific Business Intelligence Market
Revenue (US$ Mn) and Forecasts, By Application
13.2.1. Fraud Detection in Online Transactions
13.2.2. Distribution Grid
13.2.3. Supply Chain
13.2.4. Human Resource
13.3. Asia Pacific Business Intelligence Market
Revenue (US$ Mn) and Forecasts, By Deployment Mode
13.3.1. On Premise
13.3.2. Cloud
13.3.3. Hybrid
13.4. Asia Pacific Business Intelligence Market
Revenue (US$ Mn) and Forecasts, By End-Use
13.4.1. Banking, Financial Services and Insurance
(BFSI)
13.4.2. Power and Energy
13.4.3. IT and Telecom
13.4.4. Retail
13.4.5. Healthcare
13.4.6. Transport
13.4.7. Others (Education, Media and Entertainment,
etc.)
13.5. Asia Pacific Business Intelligence Market
Revenue (US$ Mn) and Forecasts, By Country
13.5.1. China
13.5.1.1.
China
Business Intelligence Market Revenue (US$ Mn) and Forecasts, By Application
13.5.1.1.1. Fraud Detection in Online Transactions
13.5.1.1.2. Distribution Grid
13.5.1.1.3. Supply Chain
13.5.1.1.4. Human Resource
13.5.1.2.
China
Business Intelligence Market Revenue (US$ Mn) and Forecasts, By Deployment Mode
13.5.1.2.1. On Premise
13.5.1.2.2. Cloud
13.5.1.2.3. Hybrid
13.5.1.3.
China
Business Intelligence Market Revenue (US$ Mn) and Forecasts, By End-Use
13.5.1.3.1. Banking, Financial Services and Insurance (BFSI)
13.5.1.3.2. Power and Energy
13.5.1.3.3. IT and Telecom
13.5.1.3.4. Retail
13.5.1.3.5. Healthcare
13.5.1.3.6. Transport
13.5.1.3.7. Others (Education, Media and Entertainment,
etc.)
13.5.2. Japan
13.5.2.1.
Japan
Business Intelligence Market Revenue (US$ Mn) and Forecasts, By Application
13.5.2.1.1. Fraud Detection in Online Transactions
13.5.2.1.2. Distribution Grid
13.5.2.1.3. Supply Chain
13.5.2.1.4. Human Resource
13.5.2.2.
Japan
Business Intelligence Market Revenue (US$ Mn) and Forecasts, By Deployment Mode
13.5.2.2.1. On Premise
13.5.2.2.2. Cloud
13.5.2.2.3. Hybrid
13.5.2.3.
Japan
Business Intelligence Market Revenue (US$ Mn) and Forecasts, By End-Use
13.5.2.3.1. Banking, Financial Services and Insurance
(BFSI)
13.5.2.3.2. Power and Energy
13.5.2.3.3. IT and Telecom
13.5.2.3.4. Retail
13.5.2.3.5. Healthcare
13.5.2.3.6. Transport
13.5.2.3.7. Others (Education, Media and Entertainment,
etc.)
13.5.3. India
13.5.3.1.
India
Business Intelligence Market Revenue (US$ Mn) and Forecasts, By Application
13.5.3.1.1. Fraud Detection in Online Transactions
13.5.3.1.2. Distribution Grid
13.5.3.1.3. Supply Chain
13.5.3.1.4. Human Resource
13.5.3.2.
India
Business Intelligence Market Revenue (US$ Mn) and Forecasts, By Deployment Mode
13.5.3.2.1. On Premise
13.5.3.2.2. Cloud
13.5.3.2.3. Hybrid
13.5.3.3.
India
Business Intelligence Market Revenue (US$ Mn) and Forecasts, By End-Use
13.5.3.3.1. Banking, Financial Services and Insurance
(BFSI)
13.5.3.3.2. Power and Energy
13.5.3.3.3. IT and Telecom
13.5.3.3.4. Retail
13.5.3.3.5. Healthcare
13.5.3.3.6. Transport
13.5.3.3.7. Others (Education, Media and Entertainment,
etc.)
13.5.4. New Zealand
13.5.4.1.
New
Zealand Business Intelligence Market Revenue (US$ Mn) and Forecasts, By
Application
13.5.4.1.1. Fraud Detection in Online Transactions
13.5.4.1.2. Distribution Grid
13.5.4.1.3. Supply Chain
13.5.4.1.4. Human Resource
13.5.4.2.
New
Zealand Business Intelligence Market Revenue (US$ Mn) and Forecasts, By
Deployment Mode
13.5.4.2.1. On Premise
13.5.4.2.2. Cloud
13.5.4.2.3. Hybrid
13.5.4.3.
New
Zealand Business Intelligence Market Revenue (US$ Mn) and Forecasts, By End-Use
13.5.4.3.1. Banking, Financial Services and Insurance
(BFSI)
13.5.4.3.2. Power and Energy
13.5.4.3.3. IT and Telecom
13.5.4.3.4. Retail
13.5.4.3.5. Healthcare
13.5.4.3.6. Transport
13.5.4.3.7. Others (Education, Media and Entertainment,
etc.)
13.5.5. Australia
13.5.5.1.
Australia
Business Intelligence Market Revenue (US$ Mn) and Forecasts, By Application
13.5.5.1.1. Fraud Detection in Online Transactions
13.5.5.1.2. Distribution Grid
13.5.5.1.3. Supply Chain
13.5.5.1.4. Human Resource
13.5.5.2.
Australia
Business Intelligence Market Revenue (US$ Mn) and Forecasts, By Deployment Mode
13.5.5.2.1. On Premise
13.5.5.2.2. Cloud
13.5.5.2.3. Hybrid
13.5.5.3.
Australia
Business Intelligence Market Revenue (US$ Mn) and Forecasts, By End-Use
13.5.5.3.1. Banking, Financial Services and Insurance
(BFSI)
13.5.5.3.2. Power and Energy
13.5.5.3.3. IT and Telecom
13.5.5.3.4. Retail
13.5.5.3.5. Healthcare
13.5.5.3.6. Transport
13.5.5.3.7. Others (Education, Media and Entertainment,
etc.)
13.5.6. South Korea
13.5.6.1.
South
Korea Business Intelligence Market Revenue (US$ Mn) and Forecasts, By
Application
13.5.6.1.1. Fraud Detection in Online Transactions
13.5.6.1.2. Distribution Grid
13.5.6.1.3. Supply Chain
13.5.6.1.4. Human Resource
13.5.6.2.
South
Korea Business Intelligence Market Revenue (US$ Mn) and Forecasts, By
Deployment Mode
13.5.6.2.1. On Premise
13.5.6.2.2. Cloud
13.5.6.2.3. Hybrid
13.5.6.3.
South
Korea Business Intelligence Market Revenue (US$ Mn) and Forecasts, By End-Use
13.5.6.3.1. Banking, Financial Services and Insurance
(BFSI)
13.5.6.3.2. Power and Energy
13.5.6.3.3. IT and Telecom
13.5.6.3.4. Retail
13.5.6.3.5. Healthcare
13.5.6.3.6. Transport
13.5.6.3.7. Others (Education, Media and Entertainment,
etc.)
13.5.7. Southeast Asia
13.5.7.1.
Southeast
Asia Business Intelligence Market Revenue (US$ Mn) and Forecasts, By
Application
13.5.7.1.1. Fraud Detection in Online Transactions
13.5.7.1.2. Distribution Grid
13.5.7.1.3. Supply Chain
13.5.7.1.4. Human Resource
13.5.7.2.
Southeast
Asia Business Intelligence Market Revenue (US$ Mn) and Forecasts, By Deployment
Mode
13.5.7.2.1. On Premise
13.5.7.2.2. Cloud
13.5.7.2.3. Hybrid
13.5.7.3.
Southeast
Asia Business Intelligence Market Revenue (US$ Mn) and Forecasts, By End-Use
13.5.7.3.1. Banking, Financial Services and Insurance
(BFSI)
13.5.7.3.2. Power and Energy
13.5.7.3.3. IT and Telecom
13.5.7.3.4. Retail
13.5.7.3.5. Healthcare
13.5.7.3.6. Transport
13.5.7.3.7. Others (Education, Media and Entertainment,
etc.)
13.5.7.4.
Southeast
Asia Business Intelligence Market Revenue (US$ Mn) and Forecasts, By Country
13.5.7.4.1. Indonesia
13.5.7.4.2. Thailand
13.5.7.4.3. Malaysia
13.5.7.4.4. Singapore
13.5.7.4.5. Rest of Southeast Asia
13.5.8. Rest of Asia Pacific
13.5.8.1.
Rest of
Asia Pacific Business Intelligence Market Revenue (US$ Mn) and Forecasts, By
Application
13.5.8.1.1. Fraud Detection in Online Transactions
13.5.8.1.2. Distribution Grid
13.5.8.1.3. Supply Chain
13.5.8.1.4. Human Resource
13.5.8.2.
Rest of
Asia Pacific Business Intelligence Market Revenue (US$ Mn) and Forecasts, By
Deployment Mode
13.5.8.2.1. On Premise
13.5.8.2.2. Cloud
13.5.8.2.3. Hybrid
13.5.8.3.
Rest of
Asia Pacific Business Intelligence Market Revenue (US$ Mn) and Forecasts, By
End-Use
13.5.8.3.1. Banking, Financial Services and Insurance
(BFSI)
13.5.8.3.2. Power and Energy
13.5.8.3.3. IT and Telecom
13.5.8.3.4. Retail
13.5.8.3.5. Healthcare
13.5.8.3.6. Transport
13.5.8.3.7. Others (Education, Media and Entertainment,
etc.)
13.6. Key Segment for Channeling Investments
13.6.1. By Country
13.6.2. By Application
13.6.3. By Deployment Mode
13.6.4. By End-Use
14. Middle East and Africa Business Intelligence
Market Analysis and Forecasts, 2019 - 2027
14.1. Overview
14.1.1. Middle East and Africa Business Intelligence
Market Revenue (US$ Mn)
14.2. Middle East and Africa Business Intelligence
Market Revenue (US$ Mn) and Forecasts, By Application
14.2.1. Fraud Detection in Online Transactions
14.2.2. Distribution Grid
14.2.3. Supply Chain
14.2.4. Human Resource
14.3. Middle East and Africa Business Intelligence
Market Revenue (US$ Mn) and Forecasts, By Deployment Mode
14.3.1. On Premise
14.3.2. Cloud
14.3.3. Hybrid
14.4. Middle East and Africa Business Intelligence
Market Revenue (US$ Mn) and Forecasts, By End-Use
14.4.1. Banking, Financial Services and Insurance
(BFSI)
14.4.2. Power and Energy
14.4.3. IT and Telecom
14.4.4. Retail
14.4.5. Healthcare
14.4.6. Transport
14.4.7. Others (Education, Media and Entertainment,
etc.)
14.5. Middle East and Africa Business Intelligence
Market Revenue (US$ Mn) and Forecasts, By Country
14.5.1. Saudi Arabia
14.5.1.1.
Saudi
Arabia Business Intelligence Market Revenue (US$ Mn) and Forecasts, By
Application
14.5.1.1.1. Fraud Detection in Online Transactions
14.5.1.1.2. Distribution Grid
14.5.1.1.3. Supply Chain
14.5.1.1.4. Human Resource
14.5.1.2.
Saudi
Arabia Business Intelligence Market Revenue (US$ Mn) and Forecasts, By
Deployment Mode
14.5.1.2.1. On Premise
14.5.1.2.2. Cloud
14.5.1.2.3. Hybrid
14.5.1.3.
Saudi
Arabia Business Intelligence Market Revenue (US$ Mn) and Forecasts, By End-Use
14.5.1.3.1. Banking, Financial Services and Insurance
(BFSI)
14.5.1.3.2. Power and Energy
14.5.1.3.3. IT and Telecom
14.5.1.3.4. Retail
14.5.1.3.5. Healthcare
14.5.1.3.6. Transport
14.5.1.3.7. Others (Education, Media and Entertainment,
etc.)
14.5.2. UAE
14.5.2.1.
UAE
Business Intelligence Market Revenue (US$ Mn) and Forecasts, By Application
14.5.2.1.1. Fraud Detection in Online Transactions
14.5.2.1.2. Distribution Grid
14.5.2.1.3. Supply Chain
14.5.2.1.4. Human Resource
14.5.2.2.
UAE
Business Intelligence Market Revenue (US$ Mn) and Forecasts, By Deployment Mode
14.5.2.2.1. On Premise
14.5.2.2.2. Cloud
14.5.2.2.3. Hybrid
14.5.2.3.
UAE
Business Intelligence Market Revenue (US$ Mn) and Forecasts, By End-Use
14.5.2.3.1. Banking, Financial Services and Insurance
(BFSI)
14.5.2.3.2. Power and Energy
14.5.2.3.3. IT and Telecom
14.5.2.3.4. Retail
14.5.2.3.5. Healthcare
14.5.2.3.6. Transport
14.5.2.3.7. Others (Education, Media and Entertainment,
etc.)
14.5.3. Egypt
14.5.3.1.
Egypt
Business Intelligence Market Revenue (US$ Mn) and Forecasts, By Application
14.5.3.1.1. Fraud Detection in Online Transactions
14.5.3.1.2. Distribution Grid
14.5.3.1.3. Supply Chain
14.5.3.1.4. Human Resource
14.5.3.2.
Egypt
Business Intelligence Market Revenue (US$ Mn) and Forecasts, By Deployment Mode
14.5.3.2.1. On Premise
14.5.3.2.2. Cloud
14.5.3.2.3. Hybrid
14.5.3.3.
Egypt
Business Intelligence Market Revenue (US$ Mn) and Forecasts, By End-Use
14.5.3.3.1. Banking, Financial Services and Insurance
(BFSI)
14.5.3.3.2. Power and Energy
14.5.3.3.3. IT and Telecom
14.5.3.3.4. Retail
14.5.3.3.5. Healthcare
14.5.3.3.6. Transport
14.5.3.3.7. Others (Education, Media and Entertainment,
etc.)
14.5.4. Kuwait
14.5.4.1.
Kuwait
Business Intelligence Market Revenue (US$ Mn) and Forecasts, By Application
14.5.4.1.1. Fraud Detection in Online Transactions
14.5.4.1.2. Distribution Grid
14.5.4.1.3. Supply Chain
14.5.4.1.4. Human Resource
14.5.4.2.
Kuwait
Business Intelligence Market Revenue (US$ Mn) and Forecasts, By Deployment Mode
14.5.4.2.1. On Premise
14.5.4.2.2. Cloud
14.5.4.2.3. Hybrid
14.5.4.3.
Kuwait
Business Intelligence Market Revenue (US$ Mn) and Forecasts, By End-Use
14.5.4.3.1. Banking, Financial Services and Insurance
(BFSI)
14.5.4.3.2. Power and Energy
14.5.4.3.3. IT and Telecom
14.5.4.3.4. Retail
14.5.4.3.5. Healthcare
14.5.4.3.6. Transport
14.5.4.3.7. Others (Education, Media and Entertainment,
etc.)
14.5.5. South Africa
14.5.5.1.
South
Africa Business Intelligence Market Revenue (US$ Mn) and Forecasts, By
Application
14.5.5.1.1. Fraud Detection in Online Transactions
14.5.5.1.2. Distribution Grid
14.5.5.1.3. Supply Chain
14.5.5.1.4. Human Resource
14.5.5.2.
South
Africa Business Intelligence Market Revenue (US$ Mn) and Forecasts, By
Deployment Mode
14.5.5.2.1. On Premise
14.5.5.2.2. Cloud
14.5.5.2.3. Hybrid
14.5.5.3.
South
Africa Business Intelligence Market Revenue (US$ Mn) and Forecasts, By End-Use
14.5.5.3.1. Banking, Financial Services and Insurance
(BFSI)
14.5.5.3.2. Power and Energy
14.5.5.3.3. IT and Telecom
14.5.5.3.4. Retail
14.5.5.3.5. Healthcare
14.5.5.3.6. Transport
14.5.5.3.7. Others (Education, Media and Entertainment,
etc.)
14.5.6. Rest of Middle East & Africa
14.5.6.1.
Rest of
Middle East & Africa Business Intelligence Market Revenue (US$ Mn) and
Forecasts, By Application
14.5.6.1.1. Fraud Detection in Online Transactions
14.5.6.1.2. Distribution Grid
14.5.6.1.3. Supply Chain
14.5.6.1.4. Human Resource
14.5.6.2.
Rest of
Middle East & Africa Business Intelligence Market Revenue (US$ Mn) and
Forecasts, By Deployment Mode
14.5.6.2.1. On Premise
14.5.6.2.2. Cloud
14.5.6.2.3. Hybrid
14.5.6.3.
Rest of
Middle East & Africa Business Intelligence Market Revenue (US$ Mn) and
Forecasts, By End-Use
14.5.6.3.1. Banking, Financial Services and Insurance
(BFSI)
14.5.6.3.2. Power and Energy
14.5.6.3.3. IT and Telecom
14.5.6.3.4. Retail
14.5.6.3.5. Healthcare
14.5.6.3.6. Transport
14.5.6.3.7. Others (Education, Media and Entertainment,
etc.)
14.6. Key Segment for Channeling Investments
14.6.1. By Country
14.6.2. By Application
14.6.3. By Deployment Mode
14.6.4. By End-Use
15. Latin America Business Intelligence Market
Analysis and Forecasts, 2019 - 2027
15.1. Overview
15.1.1. Latin America Business Intelligence Market
Revenue (US$ Mn)
15.2. Latin America Business Intelligence Market
Revenue (US$ Mn) and Forecasts, By Application
15.2.1. Fraud Detection in Online Transactions
15.2.2. Distribution Grid
15.2.3. Supply Chain
15.2.4. Human Resource
15.3. Latin America Business Intelligence Market
Revenue (US$ Mn) and Forecasts, By Deployment Mode
15.3.1. On Premise
15.3.2. Cloud
15.3.3. Hybrid
15.4. Latin America Business Intelligence Market
Revenue (US$ Mn) and Forecasts, By End-Use
15.4.1. Banking, Financial Services and Insurance
(BFSI)
15.4.2. Power and Energy
15.4.3. IT and Telecom
15.4.4. Retail
15.4.5. Healthcare
15.4.6. Transport
15.4.7. Others (Education, Media and Entertainment,
etc.)
15.5. Latin America Business Intelligence Market
Revenue (US$ Mn) and Forecasts, By Country
15.5.1. Brazil
15.5.1.1.
Brazil
Business Intelligence Market Revenue (US$ Mn) and Forecasts, By Application
15.5.1.1.1. Fraud Detection in Online Transactions
15.5.1.1.2. Distribution Grid
15.5.1.1.3. Supply Chain
15.5.1.1.4. Human Resource
15.5.1.2.
Brazil
Business Intelligence Market Revenue (US$ Mn) and Forecasts, By Deployment Mode
15.5.1.2.1. On Premise
15.5.1.2.2. Cloud
15.5.1.2.3. Hybrid
15.5.1.3.
Brazil
Business Intelligence Market Revenue (US$ Mn) and Forecasts, By End-Use
15.5.1.3.1. Banking, Financial Services and Insurance
(BFSI)
15.5.1.3.2. Power and Energy
15.5.1.3.3. IT and Telecom
15.5.1.3.4. Retail
15.5.1.3.5. Healthcare
15.5.1.3.6. Transport
15.5.1.3.7. Others (Education, Media and Entertainment,
etc.)
15.5.2. Argentina
15.5.2.1.
Argentina
Business Intelligence Market Revenue (US$ Mn) and Forecasts, By Application
15.5.2.1.1. Fraud Detection in Online Transactions
15.5.2.1.2. Distribution Grid
15.5.2.1.3. Supply Chain
15.5.2.1.4. Human Resource
15.5.2.2.
Argentina
Business Intelligence Market Revenue (US$ Mn) and Forecasts, By Deployment Mode
15.5.2.2.1. On Premise
15.5.2.2.2. Cloud
15.5.2.2.3. Hybrid
15.5.2.3.
Argentina
Business Intelligence Market Revenue (US$ Mn) and Forecasts, By End-Use
15.5.2.3.1. Banking, Financial Services and Insurance
(BFSI)
15.5.2.3.2. Power and Energy
15.5.2.3.3. IT and Telecom
15.5.2.3.4. Retail
15.5.2.3.5. Healthcare
15.5.2.3.6. Transport
15.5.2.3.7. Others (Education, Media and Entertainment,
etc.)
15.5.3. Rest of Latin America
15.5.3.1.
Rest of
Latin America Business Intelligence Market Revenue (US$ Mn) and Forecasts, By
Application
15.5.3.1.1. Fraud Detection in Online Transactions
15.5.3.1.2. Distribution Grid
15.5.3.1.3. Supply Chain
15.5.3.1.4. Human Resource
15.5.3.2.
Rest of
Latin America Business Intelligence Market Revenue (US$ Mn) and Forecasts, By
Deployment Mode
15.5.3.2.1. On Premise
15.5.3.2.2. Cloud
15.5.3.2.3. Hybrid
15.5.3.3.
Rest of
Latin America Business Intelligence Market Revenue (US$ Mn) and Forecasts, By
End-Use
15.5.3.3.1. Banking, Financial Services and Insurance
(BFSI)
15.5.3.3.2. Power and Energy
15.5.3.3.3. IT and Telecom
15.5.3.3.4. Retail
15.5.3.3.5. Healthcare
15.5.3.3.6. Transport
15.5.3.3.7. Others (Education, Media and Entertainment,
etc.)
15.6. Key Segment for Channeling Investments
15.6.1. By Country
15.6.2. By Application
15.6.3. By Deployment Mode
15.6.4. By End-Use
16. Competitive Benchmarking
16.1. Brand Benchmarking
16.2. Market Share Analysis, 2018
16.3. Global Presence and Growth Strategies
16.3.1. Mergers and Acquisitions
16.3.2. Product Launches
16.3.3. Investments Trends
16.3.4. R&D Initiatives
17. Player Profiles
17.1. Microsoft Azure
17.1.1. Company Details
17.1.2. Company Overview
17.1.3. Product Offerings
17.1.4. Key Developments
17.1.5. Financial Analysis
17.1.6. SWOT Analysis
17.1.7. Business Strategies
17.2. Oracle
17.2.1. Company Details
17.2.2. Company Overview
17.2.3. Product Offerings
17.2.4. Key Developments
17.2.5. Financial Analysis
17.2.6. SWOT Analysis
17.2.7. Business Strategies
17.3. IBM
17.3.1. Company Details
17.3.2. Company Overview
17.3.3. Product Offerings
17.3.4. Key Developments
17.3.5. Financial Analysis
17.3.6. SWOT Analysis
17.3.7. Business Strategies
17.4. SAS
17.4.1. Company Details
17.4.2. Company Overview
17.4.3. Product Offerings
17.4.4. Key Developments
17.4.5. Financial Analysis
17.4.6. SWOT Analysis
17.4.7. Business Strategies
17.5. SAP
17.5.1. Company Details
17.5.2. Company Overview
17.5.3. Product Offerings
17.5.4. Key Developments
17.5.5. Financial Analysis
17.5.6. SWOT Analysis
17.5.7. Business Strategies
17.6. Tableau Software Inc
17.6.1. Company Details
17.6.2. Company Overview
17.6.3. Product Offerings
17.6.4. Key Developments
17.6.5. Financial Analysis
17.6.6. SWOT Analysis
17.6.7. Business Strategies
17.7. MicroStrategy Incorporated
17.7.1. Company Details
17.7.2. Company Overview
17.7.3. Product Offerings
17.7.4. Key Developments
17.7.5. Financial Analysis
17.7.6. SWOT Analysis
17.7.7. Business Strategies
17.8. Salesforce.com, Inc
17.8.1. Company Details
17.8.2. Company Overview
17.8.3. Product Offerings
17.8.4. Key Developments
17.8.5. Financial Analysis
17.8.6. SWOT Analysis
17.8.7. Business Strategies
17.9. Qlik Tech
17.9.1. Company Details
17.9.2. Company Overview
17.9.3. Product Offerings
17.9.4. Key Developments
17.9.5. Financial Analysis
17.9.6. SWOT Analysis
17.9.7. Business Strategies
17.10.
Dundas
BI
17.10.1. Company Details
17.10.2. Company Overview
17.10.3. Product Offerings
17.10.4. Key Developments
17.10.5. Financial Analysis
17.10.6. SWOT Analysis
17.10.7. Business Strategies
17.11.
Birst
17.11.1. Company Details
17.11.2. Company Overview
17.11.3. Product Offerings
17.11.4. Key Developments
17.11.5. Financial Analysis
17.11.6. SWOT Analysis
17.11.7. Business Strategies
17.12.
TARGIT
17.12.1. Company Details
17.12.2. Company Overview
17.12.3. Product Offerings
17.12.4. Key Developments
17.12.5. Financial Analysis
17.12.6. SWOT Analysis
17.12.7. Business Strategies
17.13.
Yellowfin
17.13.1. Company Details
17.13.2. Company Overview
17.13.3. Product Offerings
17.13.4. Key Developments
17.13.5. Financial Analysis
17.13.6. SWOT Analysis
17.13.7. Business Strategies
17.14.
TIBCO
Software Inc
17.14.1. Company Details
17.14.2. Company Overview
17.14.3. Product Offerings
17.14.4. Key Developments
17.14.5. Financial Analysis
17.14.6. SWOT Analysis
17.14.7. Business Strategies
17.15.
SISENSE
17.15.1. Company Details
17.15.2. Company Overview
17.15.3. Product Offerings
17.15.4. Key Developments
17.15.5. Financial Analysis
17.15.6. SWOT Analysis
17.15.7. Business Strategies
17.16.
CSG PRO
17.16.1. Company Details
17.16.2. Company Overview
17.16.3. Product Offerings
17.16.4. Key Developments
17.16.5. Financial Analysis
17.16.6. SWOT Analysis
17.16.7. Business Strategies
17.17.
Accenture
17.17.1. Company Details
17.17.2. Company Overview
17.17.3. Product Offerings
17.17.4. Key Developments
17.17.5. Financial Analysis
17.17.6. SWOT Analysis
17.17.7. Business Strategies
17.18.
Datapine
17.18.1. Company Details
17.18.2. Company Overview
17.18.3. Product Offerings
17.18.4. Key Developments
17.18.5. Financial Analysis
17.18.6. SWOT Analysis
17.18.7. Business Strategies
17.19.
Rwebsys
17.19.1. Company Details
17.19.2. Company Overview
17.19.3. Product Offerings
17.19.4. Key Developments
17.19.5. Financial Analysis
17.19.6. SWOT Analysis
17.19.7. Business Strategies
17.20.
TechnoScore
17.20.1. Company Details
17.20.2. Company Overview
17.20.3. Product Offerings
17.20.4. Key Developments
17.20.5. Financial Analysis
17.20.6. SWOT Analysis
17.20.7. Business Strategies
17.21.
Hidden
Brains
17.21.1. Company Details
17.21.2. Company Overview
17.21.3. Product Offerings
17.21.4. Key Developments
17.21.5. Financial Analysis
17.21.6. SWOT Analysis
17.21.7. Business Strategies
17.22.
Coherent
Solutions
17.22.1. Company Details
17.22.2. Company Overview
17.22.3. Product Offerings
17.22.4. Key Developments
17.22.5. Financial Analysis
17.22.6. SWOT Analysis
17.22.7. Business Strategies
17.23.
TOSAN
17.23.1. Company Details
17.23.2. Company Overview
17.23.3. Product Offerings
17.23.4. Key Developments
17.23.5. Financial Analysis
17.23.6. SWOT Analysis
17.23.7. Business Strategies
17.24.
Panorama
17.24.1. Company Details
17.24.2. Company Overview
17.24.3. Product Offerings
17.24.4. Key Developments
17.24.5. Financial Analysis
17.24.6. SWOT Analysis
17.24.7. Business Strategies
17.25.
Embee
17.25.1. Company Details
17.25.2. Company Overview
17.25.3. Product Offerings
17.25.4. Key Developments
17.25.5. Financial Analysis
17.25.6. SWOT Analysis
17.25.7. Business Strategies
17.26.
Other
Market Players
17.26.1. Company Details
17.26.2. Company Overview
17.26.3. Product Offerings
17.26.4. Key Developments
17.26.5. Financial Analysis
17.26.6. SWOT Analysis
17.26.7. Business Strategies
18. Key Findings
At Absolute Markets Insights, we are engaged in building both global as well as country specific reports. As a result, the approach taken for deriving the estimation and forecast for a specific country is a bit unique and different in comparison to the global research studies. In this case, we not only study the concerned market factors & trends prevailing in a particular country (from secondary research) but we also tend to calculate the actual market size & forecast from the revenue generated from the market participants involved in manufacturing or distributing the any concerned product. These companies can also be service providers. For analyzing any country specifically, we do consider the growth factors prevailing under the states/cities/county for the same. For instance, if we are analyzing an industry specific to United States, we primarily need to study about the states present under the same(where the product/service has the highest growth). Similar analysis will be followed by other countries. Our scope of the report changes with different markets.
Our research study is mainly implement through a mix of both secondary and primary research. Various sources such as industry magazines, trade journals, and government websites and trade associations are reviewed for gathering precise data. Primary interviews are conducted to validate the market size derived from secondary research. Industry experts, major manufacturers and distributors are contacted for further validation purpose on the current market penetration and growth trends.
Prominent participants in our primary research process include:
- Key Opinion Leaders namely the CEOs, CSOs, VPs, purchasing managers, amongst others
- Research and development participants, distributors/suppliers and subject matter experts
Secondary Research includes data extracted from paid data sources:
- Reuters
- Factiva
- Bloomberg
- One Source
- Hoovers
Research Methodology

Key Inclusions


