
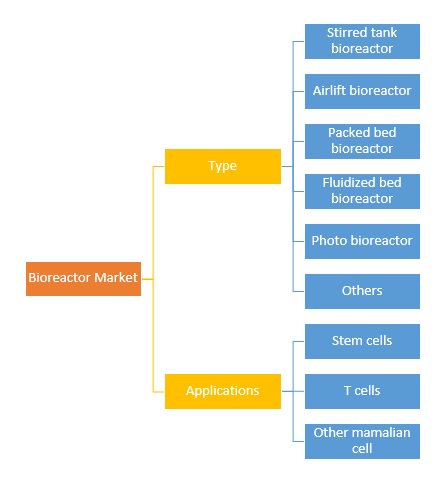
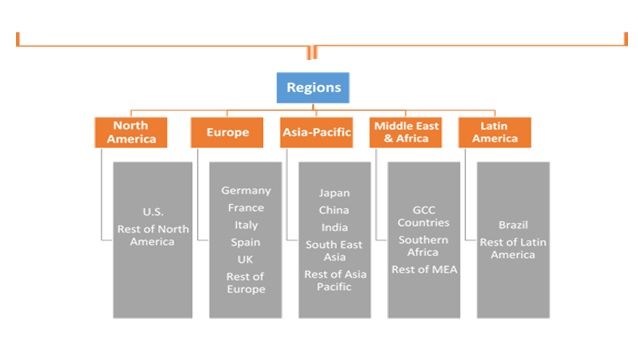
Global Bioreactor Market By Type (Stirred Tank Bioreactor, Airlift Bioreactor, Packed Bed Bioreactor, Fluidized Bed Bioreactor, Photo Bioreactor, Others); By Applications (Stem Cells, T Cells, Other Mammalian cell); By Regional Outlook (U.S., Rest Of North America, France, UK, Germany, Spain, Italy, Rest Of Europe, China, Japan, India, Southeast Asia, Rest Of Asia Pacific, GCC Countries, Southern Africa, Rest Of MEA, Brazil, Rest Of Latin America) – Global Insights, Growth, Size, Comparative Analysis, Trends And Forecast, 2018 - 2026
Industry Trends
Bioreactor is a manufactured device in a shape of vessel in which a chemical process is carried out, where biochemical products are formed from human waste, organic waste, plant cells, and many others. These bioreactors are commonly cylindrical, ranging in different size starting from liters to cubic meters and are commonly made up of stainless steel. The Global Bioreactor Market was valued at US$ 603.91 Mn in 2017 and is expected to reach US$787.57 Mn by 2021.
Global Bioreactor Market, By Application, 2017 & 2021 (US$ Million)
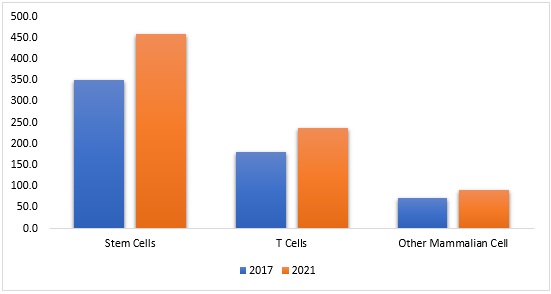
Bioreactor Market, By Application
Stem Cells hold the largest market share in terms of revenue and it is also anticipated to be the fastest growing segment in the future. The stem cells and their derived products offer great biomedical application such as cell therapy, tissue engineering, regenerative medicine and drug screening. Large scale expansion is needed to produce standardized stem cells with good biological parameters for clinical application. Bioreactor system provide controllable and standardized conditions for stem cell culture. This has led the rapid and fast paced growth in the bioreactor market.
Bioreactor Market, By Region
On the basis of geography, North America accounted for major share in 2017 for the market globally. Bioreactor apparatus is used in the biotechnological production of substances such biofuels, biochemicals, fertilizers & pesticides and for the bioconversion of organic waste. The presence of large number of bio-manufacturing industries in North America is one of the major factor responsible for the growth in bioreactor market.
Competitive Landscape
This report provides both, qualitative and quantitative research of the market, as well as integrates worthy insights into the rational scenario and favored development methods adopted by the key contenders. The report also offers extensive research on the key players in this market and detailed insights on the competitiveness of these players. The companies are adopting various strategies such as mergers and acquisition, collaborations, affiliations, and contract. For each company, the report recognizes their corporate headquarter, competitors, product/service type, application and specification, pricing and gross margin.
Some of the primary market participants are Sartorius AG (Germany), Thermo Fisher Scientific Inc. (U.S.), Merck KGaA (Germany) and GE Healthcare (U.S.), Danaher Corporation (U.S), Eppendorf AG (Germany), BBI - Biotech (Germany), Biotron (Switzerland), Cellexus (UK), Fermentec (South Korea), Finesse (USA), Zenith (India) amongst others.

Bioreactor Industry Background
1. Introduction
1.1. Market
Scope
1.2. Market
Segmentation
1.3. Methodology
1.4. Assumptions
2. Bioreactor Market Snapshot
3. Executive Summary: Bioreactor Market
4. Qualitative Analysis: Bioreactor Market
4.1. Introduction
4.1.1. Product Definition
4.1.2. Industry Development
4.2. Market
Dynamics
4.2.1. Drivers
4.2.2. Restraints
4.2.3. Opportunities
4.3. Trends in
Market
5. Global Bioreactor Market Analysis and Forecasts, 2018 – 2026
5.1. Overview
5.1.1. Global Market Revenue (US$ Mn) and Forecasts
5.2. Global
Bioreactor Market Revenue (US$ Mn) and Forecasts, By Type
5.2.1. Stirred Tank Bioreactor
5.2.1.1. Definition
5.2.1.2. Market Penetration
5.2.1.3. Market Revenue Expected to Increase by 2026
5.2.1.4. Compound Annual Growth Rate (CAGR)
5.2.2. Airlift Bioreactor
5.2.2.1. Definition
5.2.2.2. Market Penetration
5.2.2.3. Market Revenue Expected to Increase by 2026
5.2.2.4. Compound Annual Growth Rate (CAGR)
5.2.3. Packed Bed Bioreactor
5.2.3.1. Definition
5.2.3.2. Market Penetration
5.2.3.3. Market Revenue Expected to Increase by 2026
5.2.3.4. Compound Annual Growth Rate (CAGR)
5.2.4. Fluidized Bed Bioreactor
5.2.4.1. Definition
5.2.4.2. Market Penetration
5.2.4.3. Market Revenue Expected to Increase by 2026
5.2.4.4. Compound Annual Growth Rate (CAGR)
5.2.5. Photo Bioreactor
5.2.5.1. Definition
5.2.5.2. Market Penetration
5.2.5.3. Market Revenue Expected to Increase by 2026
5.2.5.4. Compound Annual Growth Rate (CAGR)
5.2.6. Others
5.2.6.1. Definition
5.2.6.2. Market Penetration
5.2.6.3. Market Revenue Expected to Increase by 2026
5.2.6.4. Compound Annual Growth Rate (CAGR)
5.3. Key
Segment for Channeling Investments
5.3.1. By Type
6. Global Bioreactor Market Analysis and Forecasts, 2018 – 2026
6.1. Overview
6.2. Global
Bioreactor Market Revenue (US$ Mn) and Forecasts, By Application
6.2.1. Stem cells
6.2.1.1. Definition
6.2.1.2. Market Penetration
6.2.1.3. Market Revenue Expected to Increase by 2026
6.2.1.4. Compound Annual Growth Rate (CAGR)
6.2.2. T cells
6.2.2.1. Definition
6.2.2.2. Market Penetration
6.2.2.3. Market Revenue Expected to Increase by 2026
6.2.2.4. Compound Annual Growth Rate (CAGR)
6.2.3. Other mammalian cells
6.2.3.1. Definition
6.2.3.2. Market Penetration
6.2.3.3. Market Revenue Expected to Increase by 2026
6.2.3.4. Compound Annual Growth Rate (CAGR)
6.3. Key
Segment for Channeling Investments
6.3.1. By Application
7. North America Bioreactor Market Analysis and Forecasts, 2018
– 2026
7.1. Overview
7.1.1. North America Market Revenue (US$ Mn)
7.2. North
America Market Revenue (US$ Mn) and Forecasts, By Type
7.2.1. Stirred Tank Bioreactor
7.2.2. Airlift Bioreactor
7.2.3. Packed Bed Bioreactor
7.2.4. Fluidized Bed Bioreactor
7.2.5. Photo Bioreactor
7.2.6. Others
7.3. North
America Bioreactor Market Revenue (US$ Mn) and Forecasts, By Application
7.3.1. Stem cells
7.3.2. T cells
7.3.3. Other mammalian cells
7.4. North
America Market Revenue (US$ Mn) and Forecasts, By Country
7.4.1. U.S.
7.4.1.1. U.S. Bioreactor Market Revenue (US$ Mn) and Forecasts, By Type
7.4.1.1.1. Stirred Tank Bioreactor
7.4.1.1.2. Airlift Bioreactor
7.4.1.1.3. Packed Bed Bioreactor
7.4.1.1.4. Fluidized Bed Bioreactor
7.4.1.1.5. Photo Bioreactor
7.4.1.1.6. Others
7.4.1.2. U.S. Bioreactor Market Revenue (US$ Mn) and Forecasts, By
Application
7.4.1.2.1. Stem cells
7.4.1.2.2. T cells
7.4.1.2.3. Other mammalian cells
7.4.2. Rest of North America
7.4.2.1. Rest of North America Bioreactor Market Revenue (US$ Mn) and
Forecasts, By Type
7.4.2.1.1. Stirred Tank Bioreactor
7.4.2.1.2. Airlift Bioreactor
7.4.2.1.3. Packed Bed Bioreactor
7.4.2.1.4. Fluidized Bed Bioreactor
7.4.2.1.5. Photo Bioreactor
7.4.2.1.6. Others
7.4.2.2. Rest of North America Bioreactor Market Revenue (US$ Mn) and
Forecasts, By Application
7.4.2.2.1. Stem cells
7.4.2.2.2. T cells
7.4.2.2.3. Other mammalian cells
7.5. Key
Segment for Channeling Investments
7.5.1. By Country
7.5.2. By Type
7.5.3. By Application
8. Europe Bioreactor Market Analysis and Forecasts, 2018 – 2026
8.1. Overview
8.1.1. Europe Market Revenue (US$ Mn)
8.2. Europe
Bioreactor Market Revenue (US$ Mn) and Forecasts, By Type
8.2.1. Stirred Tank Bioreactor
8.2.2. Airlift Bioreactor
8.2.3. Packed Bed Bioreactor
8.2.4. Fluidized Bed Bioreactor
8.2.5. Photo Bioreactor
8.2.6. Others
8.3. Europe
Market Revenue (US$ Mn) and Forecasts, By Application
8.3.1. Stem cells
8.3.2. T cells
8.3.3. Other mammalian cells
8.4. Europe
Bioreactor Market Revenue (US$ Mn) and Forecasts, By Country
8.4.1. France
8.4.1.1. France Bioreactor Market Revenue (US$ Mn) and Forecasts, By
Type
8.4.1.1.1. Stirred Tank Bioreactor
8.4.1.1.2. Airlift Bioreactor
8.4.1.1.3. Packed Bed Bioreactor
8.4.1.1.4. Fluidized Bed Bioreactor
8.4.1.1.5. Photo Bioreactor
8.4.1.1.6. Others
8.4.1.2. France Market Revenue (US$ Mn) and Forecasts, By Application
8.4.1.2.1. Stem cells
8.4.1.2.2. T cells
8.4.1.2.3. Other mammalian cells
8.4.2. The UK
8.4.2.1. The UK Bioreactor Market Revenue (US$ Mn) and Forecasts, By
Type
8.4.2.1.1. Stirred Tank Bioreactor
8.4.2.1.2. Airlift Bioreactor
8.4.2.1.3. Packed Bed Bioreactor
8.4.2.1.4. Fluidized Bed Bioreactor
8.4.2.1.5. Photo Bioreactor
8.4.2.1.6. Others
8.4.2.2. The UK Market Revenue (US$ Mn) and Forecasts, By Application
8.4.2.2.1. Stem cells
8.4.2.2.2. T cells
8.4.2.2.3. Other mammalian cells
8.4.3. Spain
8.4.3.1. Spain Bioreactor Market Revenue (US$ Mn) and Forecasts, By
Type
8.4.3.1.1. Stirred Tank Bioreactor
8.4.3.1.2. Airlift Bioreactor
8.4.3.1.3. Packed Bed Bioreactor
8.4.3.1.4. Fluidized Bed Bioreactor
8.4.3.1.5. Photo Bioreactor
8.4.3.1.6. Others
8.4.3.2. Spain Market Revenue (US$ Mn) and Forecasts, By Application
8.4.3.2.1. Stem cells
8.4.3.2.2. T cells
8.4.3.2.3. Other mammalian cells
8.4.4. Germany
8.4.4.1. Germany Bioreactor Market Revenue (US$ Mn) and Forecasts, By
Type
8.4.4.1.1. Stirred Tank Bioreactor
8.4.4.1.2. Airlift Bioreactor
8.4.4.1.3. Packed Bed Bioreactor
8.4.4.1.4. Fluidized Bed Bioreactor
8.4.4.1.5. Photo Bioreactor
8.4.4.1.6. Others
8.4.4.2. Germany Market Revenue (US$ Mn) and Forecasts, By Application
8.4.4.2.1. Stem cells
8.4.4.2.2. T cells
8.4.4.2.3. Other mammalian cells
8.4.5. Italy
8.4.5.1. Italy Bioreactor Market Revenue (US$ Mn) and Forecasts, By
Type
8.4.5.1.1. Stirred Tank Bioreactor
8.4.5.1.2. Airlift Bioreactor
8.4.5.1.3. Packed Bed Bioreactor
8.4.5.1.4. Fluidized Bed Bioreactor
8.4.5.1.5. Photo Bioreactor
8.4.5.1.6. Others
8.4.5.2. Italy Market Revenue (US$ Mn) and Forecasts, By Application
8.4.5.2.1. Stem cells
8.4.5.2.2. T cells
8.4.5.2.3. Other mammalian cells
8.4.6. Rest of Europe
8.4.6.1. Rest of Europe Bioreactor Market Revenue (US$ Mn) and
Forecasts, By Type
8.4.6.1.1. Stirred Tank Bioreactor
8.4.6.1.2. Airlift Bioreactor
8.4.6.1.3. Packed Bed Bioreactor
8.4.6.1.4. Fluidized Bed Bioreactor
8.4.6.1.5. Photo Bioreactor
8.4.6.1.6. Others
8.4.6.2. Rest of Europe Market Revenue (US$ Mn) and Forecasts, By
Application
8.4.6.2.1. Stem cells
8.4.6.2.2. T cells
8.4.6.2.3. Other mammalian cells
8.5. Key
Segment for Channeling Investments
8.5.1. By Country
8.5.2. By Type
8.5.3. By Application
9. Asia Pacific Bioreactor Market Analysis and Forecasts, 2018 –
2026
9.1. Overview
9.1.1. Asia Pacific Market Revenue (US$ Mn)
9.2. Asia
Pacific Bioreactor Market Revenue (US$ Mn) and Forecasts, By Type
9.2.1. Stirred Tank Bioreactor
9.2.2. Airlift Bioreactor
9.2.3. Packed Bed Bioreactor
9.2.4. Fluidized Bed Bioreactor
9.2.5. Photo Bioreactor
9.2.6. Others
9.3. Asia
Pacific Market Revenue (US$ Mn) and Forecasts, By Application
9.3.1. Stem cells
9.3.2. T cells
9.3.3. Other mammalian cells
9.4. Asia
Pacific Bioreactor Market Revenue (US$ Mn) and Forecasts, By Country
9.4.1. China
9.4.1.1. China Bioreactor Market Revenue (US$ Mn) and Forecasts, By
Type
9.4.1.1.1. Stirred Tank Bioreactor
9.4.1.1.2. Airlift Bioreactor
9.4.1.1.3. Packed Bed Bioreactor
9.4.1.1.4. Fluidized Bed Bioreactor
9.4.1.1.5. Photo Bioreactor
9.4.1.1.6. Others
9.4.1.2. China Market Revenue (US$ Mn) and Forecasts, By Application
9.4.1.2.1. Stem cells
9.4.1.2.2. T cells
9.4.1.2.3. Other mammalian cells
9.4.2. Japan
9.4.2.1. Japan Bioreactor Market Revenue (US$ Mn) and Forecasts, By
Type
9.4.2.1.1. Stirred Tank Bioreactor
9.4.2.1.2. Airlift Bioreactor
9.4.2.1.3. Packed Bed Bioreactor
9.4.2.1.4. Fluidized Bed Bioreactor
9.4.2.1.5. Photo Bioreactor
9.4.2.1.6. Others
9.4.2.2. Japan Market Revenue (US$ Mn) and Forecasts, By Application
9.4.2.2.1. Stem cells
9.4.2.2.2. T cells
9.4.2.2.3. Other mammalian cells
9.4.3. India
9.4.3.1. India Bioreactor Market Revenue (US$ Mn) and Forecasts, By
Type
9.4.3.1.1. Stirred Tank Bioreactor
9.4.3.1.2. Airlift Bioreactor
9.4.3.1.3. Packed Bed Bioreactor
9.4.3.1.4. Fluidized Bed Bioreactor
9.4.3.1.5. Photo Bioreactor
9.4.3.1.6. Others
9.4.3.2. India Market Revenue (US$ Mn) and Forecasts, By Application
9.4.3.2.1. Stem cells
9.4.3.2.2. T cells
9.4.3.2.3. Other mammalian cells
9.4.4. Southeast Asia
9.4.4.1. Southeast Asia Bioreactor Market Revenue (US$ Mn) and
Forecasts, By Type
9.4.4.1.1. Stirred Tank Bioreactor
9.4.4.1.2. Airlift Bioreactor
9.4.4.1.3. Packed Bed Bioreactor
9.4.4.1.4. Fluidized Bed Bioreactor
9.4.4.1.5. Photo Bioreactor
9.4.4.1.6. Others
9.4.4.2. Southeast Asia Market Revenue (US$ Mn) and Forecasts, By
Application
9.4.4.2.1. Stem cells
9.4.4.2.2. T cells
9.4.4.2.3. Other mammalian cells
9.4.5. Rest of Asia Pacific
9.4.5.1. Rest of Asia Pacific Bioreactor Market Revenue (US$ Mn) and
Forecasts, By Type
9.4.5.1.1. Stirred Tank Bioreactor
9.4.5.1.2. Airlift Bioreactor
9.4.5.1.3. Packed Bed Bioreactor
9.4.5.1.4. Fluidized Bed Bioreactor
9.4.5.1.5. Photo Bioreactor
9.4.5.1.6. Others
9.4.5.2. Rest of Asia Pacific Bioreactor Market Revenue (US$ Mn) and
Forecasts, By Application
9.4.5.2.1. Stem cells
9.4.5.2.2. T cells
9.4.5.2.3. Other mammalian cells
9.5. Key
Segment for Channeling Investments
9.5.1. By Country
9.5.2. By Type
9.5.3. By Application
10. Middle East and Africa Bioreactor Market Analysis and Forecasts,
2018 – 2026
10.1. Overview
10.1.1. Middle East and Africa Market Revenue (US$ Mn)
10.2. Middle
East and Africa Bioreactor Market Revenue (US$ Mn) and Forecasts, By Type
10.2.1. Stirred Tank Bioreactor
10.2.2. Airlift Bioreactor
10.2.3. Packed Bed Bioreactor
10.2.4. Fluidized Bed Bioreactor
10.2.5. Photo Bioreactor
10.2.6. Others
10.3. Middle
East and Africa Market Revenue (US$ Mn) and Forecasts, By Application
10.3.1. Stem cells
10.3.2. T cells
10.3.3. Other mammalian cells
10.4. Middle
East and Africa Bioreactor Market Revenue (US$ Mn) and Forecasts, By Country
10.4.1. GCC Countries
10.4.1.1. GCC Countries Bioreactor Market Revenue (US$ Mn) and
Forecasts, By Type
10.4.1.1.1. Stirred Tank Bioreactor
10.4.1.1.2. Airlift Bioreactor
10.4.1.1.3. Packed Bed Bioreactor
10.4.1.1.4. Fluidized Bed Bioreactor
10.4.1.1.5. Photo Bioreactor
10.4.1.1.6. Others
10.4.1.2. GCC Countries Market Revenue (US$ Mn) and Forecasts, By
Application
10.4.1.2.1. Stem cells
10.4.1.2.2. T cells
10.4.1.2.3. Other mammalian cells
10.4.2. Southern Africa
10.4.2.1. Southern Africa Bioreactor Market Revenue (US$ Mn) and
Forecasts, By Type
10.4.2.1.1. Stirred Tank Bioreactor
10.4.2.1.2. Airlift Bioreactor
10.4.2.1.3. Packed Bed Bioreactor
10.4.2.1.4. Fluidized Bed Bioreactor
10.4.2.1.5. Photo Bioreactor
10.4.2.1.6. Others
10.4.2.2. Southern Africa Market Revenue (US$ Mn) and Forecasts, By
Application
10.4.2.2.1. Stem cells
10.4.2.2.2. T cells
10.4.2.2.3. Other mammalian cells
10.4.3. Rest of MEA
10.4.3.1. Rest of MEA Bioreactor Market Revenue (US$ Mn) and Forecasts,
By Type
10.4.3.1.1. Stirred Tank Bioreactor
10.4.3.1.2. Airlift Bioreactor
10.4.3.1.3. Packed Bed Bioreactor
10.4.3.1.4. Fluidized Bed Bioreactor
10.4.3.1.5. Photo Bioreactor
10.4.3.1.6. Others
10.4.3.2. Rest of MEA Market Revenue (US$ Mn) and Forecasts, By
Application
10.4.3.2.1. Stem cells
10.4.3.2.2. T cells
10.4.3.2.3. Other mammalian cells
10.5. Key
Segment for Channeling Investments
10.5.1. By Country
10.5.2. By Type
10.5.3. By Application
11. Latin America Bioreactor Market Analysis and Forecasts, 2018
– 2026
11.1. Overview
11.1.1. Latin America Market Revenue (US$ Mn)
11.2. Latin
America Bioreactor Market Revenue (US$ Mn) and Forecasts, By Type
11.2.1. Stirred Tank Bioreactor
11.2.2. Airlift Bioreactor
11.2.3. Packed Bed Bioreactor
11.2.4. Fluidized Bed Bioreactor
11.2.5. Photo Bioreactor
11.2.6. Others
11.3. Latin
America Market Revenue (US$ Mn) and Forecasts, By Application
11.3.1. Stem cells
11.3.2. T cells
11.3.3. Other mammalian cells
11.4. Latin
America Bioreactor Market Revenue (US$ Mn) and Forecasts, By Country
11.4.1. Brazil
11.4.1.1. Brazil Bioreactor Market Revenue (US$ Mn) and Forecasts, By
Type
11.4.1.1.1. Stirred Tank Bioreactor
11.4.1.1.2. Airlift Bioreactor
11.4.1.1.3. Packed Bed Bioreactor
11.4.1.1.4. Fluidized Bed Bioreactor
11.4.1.1.5. Photo Bioreactor
11.4.1.1.6. Others
11.4.1.2. Brazil Market Revenue (US$ Mn) and Forecasts, By Application
11.4.1.2.1. Stem cells
11.4.1.2.2. T cells
11.4.1.2.3. Other mammalian cells
11.4.2. Rest of Latin America
11.4.2.1. Rest of Latin America Bioreactor Market Revenue (US$ Mn) and
Forecasts, By Type
11.4.2.1.1. Stirred Tank Bioreactor
11.4.2.1.2. Airlift Bioreactor
11.4.2.1.3. Packed Bed Bioreactor
11.4.2.1.4. Fluidized Bed Bioreactor
11.4.2.1.5. Photo Bioreactor
11.4.2.1.6. Others
11.4.2.2. Rest of Latin America Bioreactor Market Revenue (US$ Mn) and
Forecasts, By Application
11.4.2.2.1. Stem cells
11.4.2.2.2. T cells
11.4.2.2.3. Other mammalian cells
11.5. Key
Segment for Channeling Investments
11.5.1. By Country
11.5.2. By Type
11.5.3. By Application
12. Competitive Benchmarking
12.1. Player
Positioning Analysis
12.2. Global
Presence and Growth Strategies
13. Player Profiles
13.1. BBI -
Biotech
13.1.1. Company Details
13.1.2. Company Overview
13.1.3. Product Offerings
13.1.4. Key Developments
13.1.5. Financial Analysis
13.1.6. SWOT Analysis
13.1.7. Business Strategies
13.2. Biotron
13.2.1. Company Details
13.2.2. Company Overview
13.2.3. Product Offerings
13.2.4. Key Developments
13.2.5. Financial Analysis
13.2.6. SWOT Analysis
13.2.7. Business Strategies
13.3. Cellexus
13.3.1. Company Details
13.3.2. Company Overview
13.3.3. Product Offerings
13.3.4. Key Developments
13.3.5. Financial Analysis
13.3.6. SWOT Analysis
13.3.7. Business Strategies
13.4. Danaher
Corporation
13.4.1. Company Details
13.4.2. Company Overview
13.4.3. Product Offerings
13.4.4. Key Developments
13.4.5. Financial Analysis
13.4.6. SWOT Analysis
13.4.7. Business Strategies
13.5. Eppendorf
AG
13.5.1. Company Details
13.5.2. Company Overview
13.5.3. Product Offerings
13.5.4. Key Developments
13.5.5. Financial Analysis
13.5.6. SWOT Analysis
13.5.7. Business Strategies
13.6. Fermentec
13.6.1. Company Details
13.6.2. Company Overview
13.6.3. Product Offerings
13.6.4. Key Developments
13.6.5. Financial Analysis
13.6.6. SWOT Analysis
13.6.7. Business Strategies
13.7. Finesse
13.7.1. Company Details
13.7.2. Company Overview
13.7.3. Product Offerings
13.7.4. Key Developments
13.7.5. Financial Analysis
13.7.6. SWOT Analysis
13.7.7. Business Strategies
13.8. GE
Healthcare
13.8.1. Company Details
13.8.2. Company Overview
13.8.3. Product Offerings
13.8.4. Key Developments
13.8.5. Financial Analysis
13.8.6. SWOT Analysis
13.8.7. Business Strategies
13.9. Merck
KGaA
13.9.1. Company Details
13.9.2. Company Overview
13.9.3. Product Offerings
13.9.4. Key Developments
13.9.5. Financial Analysis
13.9.6. SWOT Analysis
13.9.7. Business Strategies
13.10. Sartorius
AG
13.10.1. Company Details
13.10.2. Company Overview
13.10.3. Product Offerings
13.10.4. Key Developments
13.10.5. Financial Analysis
13.10.6. SWOT Analysis
13.10.7. Business
Strategies
13.11. Thermo
Fisher Scientific Inc.
13.11.1. Company
Details
13.11.2. Company
Overview
13.11.3. Product
Offerings
13.11.4. Key
Developments
13.11.5. Financial
Analysis
13.11.6. SWOT
Analysis
13.11.7. Business
Strategies
13.12. Zenith
13.12.1. Company Details
13.12.2. Company Overview
13.12.3. Product Offerings
13.12.4. Key Developments
13.12.5. Financial Analysis
13.12.6. SWOT Analysis
13.12.7. Business Strategies
Note: This ToC is
tentative and can be changed according to the research study conducted during
the course of report completion.
At Absolute Markets Insights, we are engaged in building both global as well as country specific reports. As a result, the approach taken for deriving the estimation and forecast for a specific country is a bit unique and different in comparison to the global research studies. In this case, we not only study the concerned market factors & trends prevailing in a particular country (from secondary research) but we also tend to calculate the actual market size & forecast from the revenue generated from the market participants involved in manufacturing or distributing the any concerned product. These companies can also be service providers. For analyzing any country specifically, we do consider the growth factors prevailing under the states/cities/county for the same. For instance, if we are analyzing an industry specific to United States, we primarily need to study about the states present under the same(where the product/service has the highest growth). Similar analysis will be followed by other countries. Our scope of the report changes with different markets.
Our research study is mainly implement through a mix of both secondary and primary research. Various sources such as industry magazines, trade journals, and government websites and trade associations are reviewed for gathering precise data. Primary interviews are conducted to validate the market size derived from secondary research. Industry experts, major manufacturers and distributors are contacted for further validation purpose on the current market penetration and growth trends.
Prominent participants in our primary research process include:
- Key Opinion Leaders namely the CEOs, CSOs, VPs, purchasing managers, amongst others
- Research and development participants, distributors/suppliers and subject matter experts
Secondary Research includes data extracted from paid data sources:
- Reuters
- Factiva
- Bloomberg
- One Source
- Hoovers
Research Methodology

Key Inclusions


