
Global Green Logistics Market By Organization Size (Large Enterprises and Small and Medium Enterprises); By Supply Chain Process (Transportation, Inbound Logistics, Outbound Logistics, Disposal and Reverse Logistics, Warehousing and Material Handling and Packaging); By Industry (Retail and Consumer Goods, Semiconductor and Electronics, Chemical and Material, Automotive, Energy and Utilities, Farming and Agriculture and Others) – Global Insights, Growth, Size, Comparative Analysis, Trends and Forecast, 2019 – 2027
Market Overview/Industry Trends
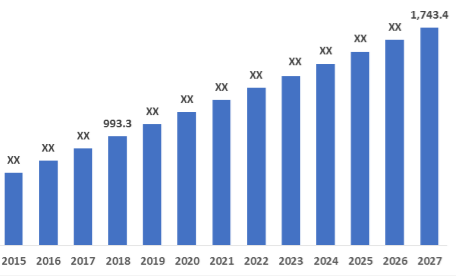
The global green logistics market was valued at US$ 993.3 Billion in 2018 and is anticipated to grow at a CAGR of 6.5% during the forecast period to reach a value of US$ 1,743.4 Billion by 2027. Green logistics is the company’s attempt to minimize the damage to the environment due to the logistics operations of an organization. Logistics is involved in various operations including transportation, warehousing & material handling, packaging among others. Logistics organizations are required to follow certain specifications to obtain the energy star rating and other environmental certifications which is very important for the organization to operate in the market. Thus, logistics firms are focusing on low carbon emission vehicles that are driving the global green logistics market across the globe. For instance, ISO stands for International Organization for Standardization which is an independent, non-governmental international organization that develops international standards for the member countries. ISO 14001: 2015 is a standard set by the ISO, which specifies the requirements for an environmental management system that an organization can use to enhance its environmental performance.
Global warming is impacting the weather, ice caps, and glaciers negatively. We can see the rise in the sea level due to the reduction in the ice caps, and glacier cover because of which companies are focusing on green logistics so that they can protect the environment. For example, according to NASA, Greenland and Antarctic sheets have declined in mass. According to the data of NASA's Gravity Recovery and Climate Experiment, between 1993 and 2016, Greenland has lost about an average of 286 billion tons of ice per year while during the same period, Antarctica has lost nearly 127 billion tons of ice per year. The volume of Antarctica ice mass loss has tripled in the last decade. Moreover, since the late 19th century, Earth’s average surface temperature has increased by about 1.62 degrees Fahrenheit (0.9 degrees Celsius). This has been caused by an increase in carbon dioxide and other human-made emissions into the atmosphere. Furthermore, in the last century, the global sea level has risen about 8 inches. Al these factors led to stringent environmental regulations in transport industry across the world. Road transportation is a major source of environmental pollution and there are stringent regulations for commercial vehicles plying on road. All these factors are prompting the global logistics company to adopt eco-friendly environmental polices including the use of electric vehicles for their transportation fleet thus increasing the size of global green logistics market.
Rise in fuel cost is also leading to global logistics company in adopting clean energy vehicles including electric vehicles which is increasing the market size of global green logistics market. For example, IEA is made up of 30 member countries and 8 association countries. According to the statistics published by them, global crude oil prices have been rising since 2016. In 2016, the crude oil price was US$ 0.27 and in 2018 it was US$ 0.45. Moreover, according to the clean cities alternative fuel price report, in the U.S., the average diesel price on April 1, 2000, was US$ 1.29 per GGE while the price of CNG was US$ 0.89 per GGE. On 1st Oct 2019, the price of diesel was US$ 2.74 per GGE while the price of CNG was US$ 2.20 per GGE. However, the measurement of how much carbon has been emitted in the environment and preparing a report on it is time-consuming and a costly process that is hindering the demand of the global green logistics market.
Today, society is focusing more on environmentally friendly products which are why companies are also emphasizing green logistics to have a competitive advantage over the other companies which is driving the demand of the global green logistics market. For example, a study conducted in the UK and America found that half of the digital consumers said that their purchasing decisions are affected by their environmental concerns. Among those who were surveyed, 34.0% actively avoid the products that are harmful to the environment like plastic straws or cutlery.
Rise in penetration of digitization in global logistics is increasing the size of global green logistics market. Digital logistics means paper-free communication to the stakeholders in the supply chain through the use of an electronic medium. With the use of digital logistics, shippers of goods can carry their goods to the consumers with less waste and smaller carbon footprint by bundling shipments together. For example, convoy has resulted in the reduction of carbon footprint by 45.0% through bundling of freight. Bundling of freight reduces the number of miles truckers travel without carrying any goods with them. This helps in the reduction of carbon emitted in the environment.
Rise in penetration of artificial intelligence (AI) in global logistics industry is anticipated to grow the future market of green logistics. As of now, only a few companies are using AI in their logistics services. According to the news published on the website of Nike on 16th September 2019, Nike has opened a new distribution center named the Court at Ham, Belgium which is expected to produce zero carbon and zero waste. It will operate completely from wind, solar, geothermal, hydroelectric and biomass power. Moreover, penalties imposed by government on non-compliance of the standard set for the companies for harming the environment is driving the global green logistics market. For instance, In India, the Air (Prevention and Control of Pollution) Act has been made to prevent, control and reduce the air pollution in the country. According to its section 39, Penalty for contravention of certain provisions of the Act, whosoever violate any of the provision of this act will be punishable with imprisonment for a term which may extend to three months or with fine which may extend to ten thousand rupees or with both, and in the case of continuing violation of the act, that person will be liable with an additional fine which may extend to five thousand rupees for every day. This act is also implemented on all the transportation vehicles which emits hazardous pollutant in the environment.
Global Green Logistics Market Revenue & Forecast, (US$ Billion), 2015 – 2027
Organization Size Outlook:
Based on organization size, the global green logistics market is divided into large enterprises and small and medium enterprises. Large global companies are focusing on the sustainability of logistics operations in their organization. For example, FedEx, which is a global courier delivery giant, is collaborating with Red Rock Biofuels to convert forest waste into biofuels. Red Rock Biofuels will produce approximately three million gallons of low-carbon, renewable jet fuel per year which is used by FedEx for their courier transportation. Also, FedEx uses around 70% of the recycled fibers for packaging materials. Another example can be of Ford Motors, which produces 95% of its vehicles using scrap metals in North America.
Supply Chain Process Outlook:
Based on the supply chain process, the global green logistics market is divided into transportation, warehousing & material handling and packaging. Transportation is further classified into Inbound Logistics, Outbound Logistics, and Disposal & Reverse Logistics. In terms of revenue, transportation will grow faster than warehousing & material handling and packaging over the forecast period.
Industry Outlook:
Based on industry, the global green logistics market is divided into retail and consumer goods, semiconductor and electronics, chemical and material, automotive, energy and utilities, farming and agriculture and others. Chemical and material will grow faster than other segments with a CAGR of 7.1% over the forecast period.
Regional Outlook:
The Asia Pacific held a share of 36.97% in the global green logistics market in 2018. It is expected to grow at the highest rate from 2019 to 2027. For example, according to the report published by DHL on ground transportation logistics, companies in the Asia Pacific focus more on green logistics compared to other regions. Moreover, Green Freight Asia, a network of Asian freight companies, is working together to improve fuel efficiency, reduce carbon dioxide emission, and lower the logistics costs in the supply chain.
Competitive Landscape
The report provides both, qualitative and quantitative research of airport logistics systems market, as well as provides comprehensive insights and development methods adopted by the key contenders. Some of the players operating in the Global green logistics market are 20Cube Logistics Pte Ltd, Al Futtaim Logistics, Bolloré Logistics, Bowling Green Logistics, DHL International GmbH, Express Freight Management, Fujitsu Limited, Go Green Logistics, Hupac Group, KLG Europe, Mahindra Logistics Ltd., Peter Green Chilled, The Green Group, Transervice Logistics Inc., United Parcel Service of America, Inc. and Westerman Multimodal Logistics. Major market players are offering their solution with new technologies. For example, in 2016, DHL International GmbH, tested delivering couriers using their drone – Parcelcopter for last mile delivery applications.

Global Green Logistics Market:
- By Organization Size
- Large Enterprises
- Small and Medium Enterprises
- By Supply Chain Process
- Transportation
- Inbound Logistics
- Outbound Logistics
- Disposal and Reverse Logistics
- Warehousing and Material Handling
- Packaging
- By Industry
- Retail and Consumer Goods
- Semiconductor and Electronics
- Chemical and Material
- Automotive
- Energy and Utilities
- Farming and Agriculture
- Others
- By Region
- North America
- US
- Canada
- Mexico
- Rest of North America
- Europe
- France
- The UK
- Spain
- Germany
- Italy
- Nordic Countries
- Denmark
- Finland
- Iceland
- Sweden
- Norway
- Benelux Union
- Belgium
- The Netherlands
- Luxembourg
- Rest of Europe
- Asia Pacific
- China
- Japan
- India
- New Zealand
- Australia
- South Korea
- Southeast Asia
- Indonesia
- Thailand
- Malaysia
- Singapore
- Rest of Southeast Asia
- Rest of Asia Pacific
- Middle East and Africa
- Saudi Arabia
- UAE
- Egypt
- Kuwait
- South Africa
- Rest of Middle East & Africa
- Latin America
- Brazil
- Argentina
- Rest of Latin America
- North America
Table of contents
1. Market Scope
1.1. Market
Segmentation
1.2. Years
Considered
1.2.1. Historic
Years: 2013 - 2017
1.2.2. Base
Year: 2018
1.2.3. Forecast
Years: 2019 – 2027
2. Key Target Audiences
3. Research Methodology
3.1. Primary
Research
3.1.1. Research
Questionnaire
3.1.2. Global
Percentage Breakdown
3.1.3. Primary
Interviews: Key Opinion Leaders (KOLs)
3.2. Secondary
Research
3.2.1. Paid
Databases
3.2.2. Secondary
Sources
3.3. Market
Size Estimates
3.3.1. Top-Down
Approach
3.3.2. Bottom-Up
Approach
3.4. Data
Triangulation Methodology
3.5. Research
Assumptions
4. Recommendations and Insights from AMI’s Perspective**
5. Holistic Overview of Green Logistics Market
6. Market Synopsis: Green
Logistics Market
7. Green Logistics Market Analysis: Qualitative Perspective
7.1. Introduction
7.1.1. Product
Definition
7.1.2. Industry
Development
7.2. Market
Dynamics
7.2.1. Drivers
7.2.2. Restraints
7.2.3. Opportunities
7.3. Trends in
Green Logistics Market
7.4. Macro-Economic
and Micro-Economic Indicators: Green Logistics Market
7.5. Porter’s
Five Force Analysis
8. Global Green Logistics Market Analysis and Forecasts, 2019 –
2027
8.1. Overview
8.1.1. Global
Green Logistics Market Revenue (US$ Mn)
8.2. Global
Green Logistics Market Revenue (US$ Mn) and Forecasts, By Organization Size
8.2.1. Large
Enterprises
8.2.1.1. Definition
8.2.1.2. Market
Estimation and Penetration, 2013 – 2018
8.2.1.3. Market
Forecast, 2019 – 2027
8.2.1.4. Compound
Annual Growth Rate (CAGR)
8.2.1.5. Regional
Bifurcation
8.2.1.5.1. North
America
8.2.1.5.1.1. Market
Estimation, 2013 – 2018
8.2.1.5.1.2. Market
Forecast, 2019 – 2027
8.2.1.5.2. Europe
8.2.1.5.2.1. Market
Estimation, 2013 – 2018
8.2.1.5.2.2. Market
Forecast, 2019 – 2027
8.2.1.5.3. Asia
Pacific
8.2.1.5.3.1. Market
Estimation, 2013 – 2018
8.2.1.5.3.2. Market
Forecast, 2019 – 2027
8.2.1.5.4. Middle
East and Africa
8.2.1.5.4.1. Market
Estimation, 2013 – 2018
8.2.1.5.4.2. Market
Forecast, 2019 – 2027
8.2.1.5.5. Latin
America
8.2.1.5.5.1. Market
Estimation, 2013 – 2018
8.2.1.5.5.2. Market
Forecast, 2019 – 2027
8.2.2. Small
and Medium Enterprises
8.2.2.1. Definition
8.2.2.2. Market
Estimation and Penetration, 2013 – 2018
8.2.2.3. Market
Forecast, 2019 – 2027
8.2.2.4. Compound
Annual Growth Rate (CAGR)
8.2.2.5. Regional
Bifurcation
8.2.2.5.1. North
America
8.2.2.5.1.1. Market
Estimation, 2013 – 2018
8.2.2.5.1.2. Market
Forecast, 2019 – 2027
8.2.2.5.2. Europe
8.2.2.5.2.1. Market
Estimation, 2013 – 2018
8.2.2.5.2.2. Market
Forecast, 2019 – 2027
8.2.2.5.3. Asia
Pacific
8.2.2.5.3.1. Market
Estimation, 2013 – 2018
8.2.2.5.3.2. Market
Forecast, 2019 – 2027
8.2.2.5.4. Middle
East and Africa
8.2.2.5.4.1. Market
Estimation, 2013 – 2018
8.2.2.5.4.2. Market
Forecast, 2019 – 2027
8.2.2.5.5. Latin
America
8.2.2.5.5.1. Market
Estimation, 2013 – 2018
8.2.2.5.5.2. Market
Forecast, 2019 – 2027
8.3. Key
Segment for Channeling Investments
8.3.1. By
Organization Size
9. Global Green Logistics Market Analysis and Forecasts, 2019 –
2027
9.1. Overview
9.2. Global
Green Logistics Market Revenue (US$ Mn) and Forecasts, By Supply Chain Process
9.2.1. Transportation
(Definition, Market Estimation and Penetration, 2013 – 2018, Market Estimation
(2013 – 2018), Market Forecast (2019 – 2027), Compound Annual Growth Rate
(CAGR), Regional Bifurcation (North America, Europe, Asia Pacific, Middle East
and Africa, Latin America) and Information on Inbound Logistics, Outbound
Logistics, Disposal and Reverse Logistics)
9.2.1.1. Inbound
Logistics
9.2.1.2. Outbound
Logistics
9.2.1.3. Disposal
and Reverse Logistics
9.2.2. Warehousing
and Material Handling
9.2.2.1. Definition
9.2.2.2. Market
Estimation and Penetration, 2013 – 2018
9.2.2.3. Market
Forecast, 2019 – 2027
9.2.2.4. Compound
Annual Growth Rate (CAGR)
9.2.2.5. Regional
Bifurcation
9.2.2.5.1. North
America
9.2.2.5.1.1. Market
Estimation, 2013 – 2018
9.2.2.5.1.2. Market
Forecast, 2019 – 2027
9.2.2.5.2. Europe
9.2.2.5.2.1. Market
Estimation, 2013 – 2018
9.2.2.5.2.2. Market
Forecast, 2019 – 2027
9.2.2.5.3. Asia
Pacific
9.2.2.5.3.1. Market
Estimation, 2013 – 2018
9.2.2.5.3.2. Market
Forecast, 2019 – 2027
9.2.2.5.4. Middle
East and Africa
9.2.2.5.4.1. Market
Estimation, 2013 – 2018
9.2.2.5.4.2. Market
Forecast, 2019 – 2027
9.2.2.5.5. Latin
America
9.2.2.5.5.1. Market
Estimation, 2013 – 2018
9.2.2.5.5.2. Market
Forecast, 2019 – 2027
9.2.3. Packaging
9.2.3.1. Definition
9.2.3.2. Market
Estimation and Penetration, 2013 – 2018
9.2.3.3. Market
Forecast, 2019 – 2027
9.2.3.4. Compound
Annual Growth Rate (CAGR)
9.2.3.5. Regional
Bifurcation
9.2.3.5.1. North
America
9.2.3.5.1.1. Market
Estimation, 2013 – 2018
9.2.3.5.1.2. Market
Forecast, 2019 – 2027
9.2.3.5.2. Europe
9.2.3.5.2.1. Market
Estimation, 2013 – 2018
9.2.3.5.2.2. Market
Forecast, 2019 – 2027
9.2.3.5.3. Asia
Pacific
9.2.3.5.3.1. Market
Estimation, 2013 – 2018
9.2.3.5.3.2. Market
Forecast, 2019 – 2027
9.2.3.5.4. Middle
East and Africa
9.2.3.5.4.1. Market
Estimation, 2013 – 2018
9.2.3.5.4.2. Market
Forecast, 2019 – 2027
9.2.3.5.5. Latin
America
9.2.3.5.5.1. Market
Estimation, 2013 – 2018
9.2.3.5.5.2. Market
Forecast, 2019 – 2027
9.3. Key
Segment for Channeling Investments
9.3.1. By
Supply Chain Process
10. Global Green Logistics Market Analysis and Forecasts, 2019 –
2027
10.1. Overview
10.2. Global
Green Logistics Market Revenue (US$ Mn) and Forecasts, By Industry
10.2.1. Retail
and Consumer Goods
10.2.1.1. Definition
10.2.1.2. Market
Estimation and Penetration, 2013 – 2018
10.2.1.3. Market
Forecast, 2019 – 2027
10.2.1.4. Compound
Annual Growth Rate (CAGR)
10.2.1.5. Regional
Bifurcation
10.2.1.5.1. North
America
10.2.1.5.1.1. Market
Estimation, 2013 – 2018
10.2.1.5.1.2. Market
Forecast, 2019 – 2027
10.2.1.5.2. Europe
10.2.1.5.2.1. Market
Estimation, 2013 – 2018
10.2.1.5.2.2. Market
Forecast, 2019 – 2027
10.2.1.5.3. Asia
Pacific
10.2.1.5.3.1. Market
Estimation, 2013 – 2018
10.2.1.5.3.2. Market
Forecast, 2019 – 2027
10.2.1.5.4. Middle
East and Africa
10.2.1.5.4.1. Market
Estimation, 2013 – 2018
10.2.1.5.4.2. Market
Forecast, 2019 – 2027
10.2.1.5.5. Latin
America
10.2.1.5.5.1. Market
Estimation, 2013 – 2018
10.2.1.5.5.2. Market
Forecast, 2019 – 2027
10.2.2. Semiconductor
and Electronics
10.2.2.1. Definition
10.2.2.2. Market
Estimation and Penetration, 2013 – 2018
10.2.2.3. Market
Forecast, 2019 – 2027
10.2.2.4. Compound
Annual Growth Rate (CAGR)
10.2.2.5. Regional
Bifurcation
10.2.2.5.1. North
America
10.2.2.5.1.1. Market
Estimation, 2013 – 2018
10.2.2.5.1.2. Market
Forecast, 2019 – 2027
10.2.2.5.2. Europe
10.2.2.5.2.1. Market
Estimation, 2013 – 2018
10.2.2.5.2.2. Market
Forecast, 2019 – 2027
10.2.2.5.3. Asia
Pacific
10.2.2.5.3.1. Market
Estimation, 2013 – 2018
10.2.2.5.3.2. Market
Forecast, 2019 – 2027
10.2.2.5.4. Middle
East and Africa
10.2.2.5.4.1. Market
Estimation, 2013 – 2018
10.2.2.5.4.2. Market
Forecast, 2019 – 2027
10.2.2.5.5. Latin
America
10.2.2.5.5.1. Market
Estimation, 2013 – 2018
10.2.2.5.5.2. Market
Forecast, 2019 – 2027
10.2.3. Chemical
and Material
10.2.3.1. Definition
10.2.3.2. Market
Estimation and Penetration, 2013 – 2018
10.2.3.3. Market
Forecast, 2019 – 2027
10.2.3.4. Compound
Annual Growth Rate (CAGR)
10.2.3.5. Regional
Bifurcation
10.2.3.5.1. North
America
10.2.3.5.1.1. Market
Estimation, 2013 – 2018
10.2.3.5.1.2. Market
Forecast, 2019 – 2027
10.2.3.5.2. Europe
10.2.3.5.2.1. Market
Estimation, 2013 – 2018
10.2.3.5.2.2. Market
Forecast, 2019 – 2027
10.2.3.5.3. Asia
Pacific
10.2.3.5.3.1. Market
Estimation, 2013 – 2018
10.2.3.5.3.2. Market
Forecast, 2019 – 2027
10.2.3.5.4. Middle
East and Africa
10.2.3.5.4.1. Market
Estimation, 2013 – 2018
10.2.3.5.4.2. Market
Forecast, 2019 – 2027
10.2.3.5.5. Latin
America
10.2.3.5.5.1. Market
Estimation, 2013 – 2018
10.2.3.5.5.2. Market
Forecast, 2019 – 2027
10.2.4. Automotive
10.2.4.1. Definition
10.2.4.2. Market
Estimation and Penetration, 2013 – 2018
10.2.4.3. Market
Forecast, 2019 – 2027
10.2.4.4. Compound
Annual Growth Rate (CAGR)
10.2.4.5. Regional
Bifurcation
10.2.4.5.1. North
America
10.2.4.5.1.1. Market
Estimation, 2013 – 2018
10.2.4.5.1.2. Market
Forecast, 2019 – 2027
10.2.4.5.2. Europe
10.2.4.5.2.1. Market
Estimation, 2013 – 2018
10.2.4.5.2.2. Market
Forecast, 2019 – 2027
10.2.4.5.3. Asia
Pacific
10.2.4.5.3.1. Market
Estimation, 2013 – 2018
10.2.4.5.3.2. Market
Forecast, 2019 – 2027
10.2.4.5.4. Middle
East and Africa
10.2.4.5.4.1. Market
Estimation, 2013 – 2018
10.2.4.5.4.2. Market
Forecast, 2019 – 2027
10.2.4.5.5. Latin
America
10.2.4.5.5.1. Market
Estimation, 2013 – 2018
10.2.4.5.5.2. Market
Forecast, 2019 – 2027
10.2.5. Energy
and Utilities
10.2.5.1. Definition
10.2.5.2. Market
Estimation and Penetration, 2013 – 2018
10.2.5.3. Market
Forecast, 2019 – 2027
10.2.5.4. Compound
Annual Growth Rate (CAGR)
10.2.5.5. Regional
Bifurcation
10.2.5.5.1. North
America
10.2.5.5.1.1. Market
Estimation, 2013 – 2018
10.2.5.5.1.2. Market
Forecast, 2019 – 2027
10.2.5.5.2. Europe
10.2.5.5.2.1. Market
Estimation, 2013 – 2018
10.2.5.5.2.2. Market
Forecast, 2019 – 2027
10.2.5.5.3. Asia
Pacific
10.2.5.5.3.1. Market
Estimation, 2013 – 2018
10.2.5.5.3.2. Market
Forecast, 2019 – 2027
10.2.5.5.4. Middle
East and Africa
10.2.5.5.4.1. Market
Estimation, 2013 – 2018
10.2.5.5.4.2. Market
Forecast, 2019 – 2027
10.2.5.5.5. Latin
America
10.2.5.5.5.1. Market
Estimation, 2013 – 2018
10.2.5.5.5.2. Market
Forecast, 2019 – 2027
10.2.6. Farming
and Agriculture
10.2.6.1. Definition
10.2.6.2. Market
Estimation and Penetration, 2013 – 2018
10.2.6.3. Market
Forecast, 2019 – 2027
10.2.6.4. Compound
Annual Growth Rate (CAGR)
10.2.6.5. Regional
Bifurcation
10.2.6.5.1. North
America
10.2.6.5.1.1. Market
Estimation, 2013 – 2018
10.2.6.5.1.2. Market
Forecast, 2019 – 2027
10.2.6.5.2. Europe
10.2.6.5.2.1. Market
Estimation, 2013 – 2018
10.2.6.5.2.2. Market
Forecast, 2019 – 2027
10.2.6.5.3. Asia
Pacific
10.2.6.5.3.1. Market
Estimation, 2013 – 2018
10.2.6.5.3.2. Market
Forecast, 2019 – 2027
10.2.6.5.4. Middle
East and Africa
10.2.6.5.4.1. Market
Estimation, 2013 – 2018
10.2.6.5.4.2. Market
Forecast, 2019 – 2027
10.2.6.5.5. Latin
America
10.2.6.5.5.1. Market
Estimation, 2013 – 2018
10.2.6.5.5.2. Market
Forecast, 2019 – 2027
10.2.7. Others
10.2.7.1. Definition
10.2.7.2. Market
Estimation and Penetration, 2013 – 2018
10.2.7.3. Market
Forecast, 2019 – 2027
10.2.7.4. Compound
Annual Growth Rate (CAGR)
10.2.7.5. Regional
Bifurcation
10.2.7.5.1. North
America
10.2.7.5.1.1. Market
Estimation, 2013 – 2018
10.2.7.5.1.2. Market
Forecast, 2019 – 2027
10.2.7.5.2. Europe
10.2.7.5.2.1. Market
Estimation, 2013 – 2018
10.2.7.5.2.2. Market
Forecast, 2019 – 2027
10.2.7.5.3. Asia
Pacific
10.2.7.5.3.1. Market
Estimation, 2013 – 2018
10.2.7.5.3.2. Market
Forecast, 2019 – 2027
10.2.7.5.4. Middle
East and Africa
10.2.7.5.4.1. Market
Estimation, 2013 – 2018
10.2.7.5.4.2. Market
Forecast, 2019 – 2027
10.2.7.5.5. Latin
America
10.2.7.5.5.1. Market
Estimation, 2013 – 2018
10.2.7.5.5.2. Market
Forecast, 2019 – 2027
10.3. Key
Segment for Channeling Investments
10.3.1. By
Industry
11. North America Green Logistics Market Analysis and Forecasts,
2019 - 2027
11.1. Overview
11.1.1. North
America Green Logistics Market Revenue (US$ Mn)
11.2. North
America Green Logistics Market Revenue (US$ Mn) and Forecasts, By Organization
Size
11.2.1. Large
Enterprises
11.2.2. Small
and Medium Enterprises
11.3. North
America Green Logistics Market Revenue (US$ Mn) and Forecasts, By Supply Chain
Process
11.3.1. Transportation
11.3.1.1. Inbound
Logistics
11.3.1.2. Outbound
Logistics
11.3.1.3. Disposal
and Reverse Logistics
11.3.2. Warehousing
and Material Handling
11.3.3. Packaging
11.4. North
America Green Logistics Market Revenue (US$ Mn) and Forecasts, By Industry
11.4.1. Retail
and Consumer Goods
11.4.2. Semiconductor
and Electronics
11.4.3. Chemical
and Material
11.4.4. Automotive
11.4.5. Energy
and Utilities
11.4.6. Farming
and Agriculture
11.4.7. Others
11.5. North
America Green Logistics Market Revenue (US$ Mn) and Forecasts, By Country
11.5.1. U.S
11.5.1.1. U.S
Green Logistics Market Revenue (US$ Mn) and Forecasts, By Organization Size
11.5.1.1.1. Large
Enterprises
11.5.1.1.2. Small
and Medium Enterprises
11.5.1.2. U.S
Green Logistics Market Revenue (US$ Mn) and Forecasts, By Supply Chain Process
11.5.1.2.1. Transportation
11.5.1.2.1.1. Inbound
Logistics
11.5.1.2.1.2. Outbound
Logistics
11.5.1.2.1.3. Disposal
and Reverse Logistics
11.5.1.2.2. Warehousing
and Material Handling
11.5.1.2.3. Packaging
11.5.1.3. U.S
Green Logistics Market Revenue (US$ Mn) and Forecasts, By Industry
11.5.1.3.1. Retail
and Consumer Goods
11.5.1.3.2. Semiconductor
and Electronics
11.5.1.3.3. Chemical
and Material
11.5.1.3.4. Automotive
11.5.1.3.5. Energy
and Utilities
11.5.1.3.6. Farming
and Agriculture
11.5.1.3.7. Others
11.5.2. Canada
11.5.2.1. Canada
Green Logistics Market Revenue (US$ Mn) and Forecasts, By Organization Size
11.5.2.1.1. Large
Enterprises
11.5.2.1.2. Small
and Medium Enterprises
11.5.2.2. Canada
Green Logistics Market Revenue (US$ Mn) and Forecasts, By Supply Chain Process
11.5.2.2.1. Transportation
11.5.2.2.1.1. Inbound
Logistics
11.5.2.2.1.2. Outbound
Logistics
11.5.2.2.1.3. Disposal
and Reverse Logistics
11.5.2.2.2. Warehousing
and Material Handling
11.5.2.2.3. Packaging
11.5.2.3. Canada
Green Logistics Market Revenue (US$ Mn) and Forecasts, By Industry
11.5.2.3.1. Retail
and Consumer Goods
11.5.2.3.2. Semiconductor
and Electronics
11.5.2.3.3. Chemical
and Material
11.5.2.3.4. Automotive
11.5.2.3.5. Energy
and Utilities
11.5.2.3.6. Farming
and Agriculture
11.5.2.3.7. Others
11.5.3. Mexico
11.5.3.1. Mexico
Green Logistics Market Revenue (US$ Mn) and Forecasts, By Organization Size
11.5.3.1.1. Large
Enterprises
11.5.3.1.2. Small
and Medium Enterprises
11.5.3.2. Mexico
Green Logistics Market Revenue (US$ Mn) and Forecasts, By Supply Chain Process
11.5.3.2.1. Transportation
11.5.3.2.1.1. Inbound
Logistics
11.5.3.2.1.2. Outbound
Logistics
11.5.3.2.1.3. Disposal
and Reverse Logistics
11.5.3.2.2. Warehousing
and Material Handling
11.5.3.2.3. Packaging
11.5.3.3. Mexico
Green Logistics Market Revenue (US$ Mn) and Forecasts, By Industry
11.5.3.3.1. Retail
and Consumer Goods
11.5.3.3.2. Semiconductor
and Electronics
11.5.3.3.3. Chemical
and Material
11.5.3.3.4. Automotive
11.5.3.3.5. Energy
and Utilities
11.5.3.3.6. Farming
and Agriculture
11.5.3.3.7. Others
11.5.4. Rest of
North America
11.5.4.1. Rest
of North America Green Logistics Market Revenue (US$ Mn) and Forecasts, By
Organization Size
11.5.4.1.1. Large
Enterprises
11.5.4.1.2. Small
and Medium Enterprises
11.5.4.2. Rest
of North America Green Logistics Market Revenue (US$ Mn) and Forecasts, By
Supply Chain Process
11.5.4.2.1. Transportation
11.5.4.2.1.1. Inbound
Logistics
11.5.4.2.1.2. Outbound
Logistics
11.5.4.2.1.3. Disposal
and Reverse Logistics
11.5.4.2.2. Warehousing
and Material Handling
11.5.4.2.3. Packaging
11.5.4.3. Rest
of North America Green Logistics Market Revenue (US$ Mn) and Forecasts, By
Industry
11.5.4.3.1. Retail
and Consumer Goods
11.5.4.3.2. Semiconductor
and Electronics
11.5.4.3.3. Chemical
and Material
11.5.4.3.4. Automotive
11.5.4.3.5. Energy
and Utilities
11.5.4.3.6. Farming
and Agriculture
11.5.4.3.7. Others
11.6. Key
Segment for Channeling Investments
11.6.1. By
Country
11.6.2. By
Organization Size
11.6.3. By
Supply Chain Process
11.6.4. By
Industry
12. Europe Green Logistics Market Analysis and Forecasts, 2019 -
2027
12.1. Overview
12.1.1. Europe
Green Logistics Market Revenue (US$ Mn)
12.2. Europe
Green Logistics Market Revenue (US$ Mn) and Forecasts, By Organization Size
12.2.1. Large
Enterprises
12.2.2. Small
and Medium Enterprises
12.3. Europe
Green Logistics Market Revenue (US$ Mn) and Forecasts, By Supply Chain Process
12.3.1. Transportation
12.3.1.1. Inbound
Logistics
12.3.1.2. Outbound
Logistics
12.3.1.3. Disposal
and Reverse Logistics
12.3.2. Warehousing
and Material Handling
12.3.3. Packaging
12.4. Europe
Green Logistics Market Revenue (US$ Mn) and Forecasts, By Industry
12.4.1. Retail
and Consumer Goods
12.4.2. Semiconductor
and Electronics
12.4.3. Chemical
and Material
12.4.4. Automotive
12.4.5. Energy
and Utilities
12.4.6. Farming
and Agriculture
12.4.7. Others
12.5. Europe
Green Logistics Market Revenue (US$ Mn) and Forecasts, By Country
12.5.1. France
12.5.1.1. France
Green Logistics Market Revenue (US$ Mn) and Forecasts, By Organization Size
12.5.1.1.1. Large
Enterprises
12.5.1.1.2. Small
and Medium Enterprises
12.5.1.2. France
Green Logistics Market Revenue (US$ Mn) and Forecasts, By Supply Chain Process
12.5.1.2.1. Transportation
12.5.1.2.1.1. Inbound
Logistics
12.5.1.2.1.2. Outbound
Logistics
12.5.1.2.1.3. Disposal
and Reverse Logistics
12.5.1.2.2. Warehousing
and Material Handling
12.5.1.2.3. Packaging
12.5.1.3. France
Green Logistics Market Revenue (US$ Mn) and Forecasts, By Industry
12.5.1.3.1. Retail
and Consumer Goods
12.5.1.3.2. Semiconductor
and Electronics
12.5.1.3.3. Chemical
and Material
12.5.1.3.4. Automotive
12.5.1.3.5. Energy
and Utilities
12.5.1.3.6. Farming
and Agriculture
12.5.1.3.7. Others
12.5.2. The UK
12.5.2.1. The
UK Green Logistics Market Revenue (US$ Mn) and Forecasts, By Organization Size
12.5.2.1.1. Large
Enterprises
12.5.2.1.2. Small
and Medium Enterprises
12.5.2.2. The
UK Green Logistics Market Revenue (US$ Mn) and Forecasts, By Supply Chain
Process
12.5.2.2.1. Transportation
12.5.2.2.1.1. Inbound
Logistics
12.5.2.2.1.2. Outbound
Logistics
12.5.2.2.1.3. Disposal
and Reverse Logistics
12.5.2.2.2. Warehousing
and Material Handling
12.5.2.2.3. Packaging
12.5.2.3. The
UK Green Logistics Market Revenue (US$ Mn) and Forecasts, By Industry
12.5.2.3.1. Retail
and Consumer Goods
12.5.2.3.2. Semiconductor
and Electronics
12.5.2.3.3. Chemical
and Material
12.5.2.3.4. Automotive
12.5.2.3.5. Energy
and Utilities
12.5.2.3.6. Farming
and Agriculture
12.5.2.3.7. Others
12.5.3. Spain
12.5.3.1. Spain
Green Logistics Market Revenue (US$ Mn) and Forecasts, By Organization Size
12.5.3.1.1. Large
Enterprises
12.5.3.1.2. Small
and Medium Enterprises
12.5.3.2. Spain
Green Logistics Market Revenue (US$ Mn) and Forecasts, By Supply Chain Process
12.5.3.2.1. Transportation
12.5.3.2.1.1. Inbound
Logistics
12.5.3.2.1.2. Outbound
Logistics
12.5.3.2.1.3. Disposal
and Reverse Logistics
12.5.3.2.2. Warehousing
and Material Handling
12.5.3.2.3. Packaging
12.5.3.3. Spain
Green Logistics Market Revenue (US$ Mn) and Forecasts, By Industry
12.5.3.3.1. Retail
and Consumer Goods
12.5.3.3.2. Semiconductor
and Electronics
12.5.3.3.3. Chemical
and Material
12.5.3.3.4. Automotive
12.5.3.3.5. Energy
and Utilities
12.5.3.3.6. Farming
and Agriculture
12.5.3.3.7. Others
12.5.4. Germany
12.5.4.1. Germany
Green Logistics Market Revenue (US$ Mn) and Forecasts, By Organization Size
12.5.4.1.1. Large
Enterprises
12.5.4.1.2. Small
and Medium Enterprises
12.5.4.2. Germany
Green Logistics Market Revenue (US$ Mn) and Forecasts, By Supply Chain Process
12.5.4.2.1. Transportation
12.5.4.2.1.1. Inbound
Logistics
12.5.4.2.1.2. Outbound
Logistics
12.5.4.2.1.3. Disposal
and Reverse Logistics
12.5.4.2.2. Warehousing
and Material Handling
12.5.4.2.3. Packaging
12.5.4.3. Germany
Green Logistics Market Revenue (US$ Mn) and Forecasts, By Industry
12.5.4.3.1. Retail
and Consumer Goods
12.5.4.3.2. Semiconductor
and Electronics
12.5.4.3.3. Chemical
and Material
12.5.4.3.4. Automotive
12.5.4.3.5. Energy
and Utilities
12.5.4.3.6. Farming
and Agriculture
12.5.4.3.7. Others
12.5.5. Italy
12.5.5.1. Italy
Green Logistics Market Revenue (US$ Mn) and Forecasts, By Organization Size
12.5.5.1.1. Large
Enterprises
12.5.5.1.2. Small
and Medium Enterprises
12.5.5.2. Italy
Green Logistics Market Revenue (US$ Mn) and Forecasts, By Supply Chain Process
12.5.5.2.1. Transportation
12.5.5.2.1.1. Inbound
Logistics
12.5.5.2.1.2. Outbound
Logistics
12.5.5.2.1.3. Disposal
and Reverse Logistics
12.5.5.2.2. Warehousing
and Material Handling
12.5.5.2.3. Packaging
12.5.5.3. Italy
Green Logistics Market Revenue (US$ Mn) and Forecasts, By Industry
12.5.5.3.1. Retail
and Consumer Goods
12.5.5.3.2. Semiconductor
and Electronics
12.5.5.3.3. Chemical
and Material
12.5.5.3.4. Automotive
12.5.5.3.5. Energy
and Utilities
12.5.5.3.6. Farming
and Agriculture
12.5.5.3.7. Others
12.5.6. Nordic
Countries
12.5.6.1. Nordic
Countries Green Logistics Market Revenue (US$ Mn) and Forecasts, By
Organization Size
12.5.6.1.1. Large
Enterprises
12.5.6.1.2. Small
and Medium Enterprises
12.5.6.2. Nordic
Countries Green Logistics Market Revenue (US$ Mn) and Forecasts, By Supply
Chain Process
12.5.6.2.1. Transportation
12.5.6.2.1.1. Inbound
Logistics
12.5.6.2.1.2. Outbound
Logistics
12.5.6.2.1.3. Disposal
and Reverse Logistics
12.5.6.2.2. Warehousing
and Material Handling
12.5.6.2.3. Packaging
12.5.6.3. Nordic
Countries Green Logistics Market Revenue (US$ Mn) and Forecasts, By Industry
12.5.6.3.1. Retail
and Consumer Goods
12.5.6.3.2. Semiconductor
and Electronics
12.5.6.3.3. Chemical
and Material
12.5.6.3.4. Automotive
12.5.6.3.5. Energy
and Utilities
12.5.6.3.6. Farming
and Agriculture
12.5.6.3.7. Others
12.5.6.4. Nordic
Countries Green Logistics Market Revenue (US$ Mn) and Forecasts, By Country
12.5.6.4.1. Denmark
12.5.6.4.2. Finland
12.5.6.4.3. Iceland
12.5.6.4.4. Sweden
12.5.6.4.5. Norway
12.5.7. Benelux
Union
12.5.7.1. Benelux
Union Green Logistics Market Revenue (US$ Mn) and Forecasts, By Organization
Size
12.5.7.1.1. Large
Enterprises
12.5.7.1.2. Small
and Medium Enterprises
12.5.7.2. Benelux
Union Green Logistics Market Revenue (US$ Mn) and Forecasts, By Supply Chain
Process
12.5.7.2.1. Transportation
12.5.7.2.1.1. Inbound
Logistics
12.5.7.2.1.2. Outbound
Logistics
12.5.7.2.1.3. Disposal
and Reverse Logistics
12.5.7.2.2. Warehousing
and Material Handling
12.5.7.2.3. Packaging
12.5.7.3. Benelux
Union Green Logistics Market Revenue (US$ Mn) and Forecasts, By Industry
12.5.7.3.1. Retail
and Consumer Goods
12.5.7.3.2. Semiconductor
and Electronics
12.5.7.3.3. Chemical
and Material
12.5.7.3.4. Automotive
12.5.7.3.5. Energy
and Utilities
12.5.7.3.6. Farming
and Agriculture
12.5.7.3.7. Others
12.5.7.4. Benelux
Union Green Logistics Market Revenue (US$ Mn) and Forecasts, By Country
12.5.7.4.1. Belgium
12.5.7.4.2. The
Netherlands
12.5.7.4.3. Luxembourg
12.5.8. Rest of
Europe
12.5.8.1. Rest
of Europe Green Logistics Market Revenue (US$ Mn) and Forecasts, By
Organization Size
12.5.8.1.1. Large
Enterprises
12.5.8.1.2. Small
and Medium Enterprises
12.5.8.2. Rest
of Europe Green Logistics Market Revenue (US$ Mn) and Forecasts, By Supply
Chain Process
12.5.8.2.1. Transportation
12.5.8.2.1.1. Inbound
Logistics
12.5.8.2.1.2. Outbound
Logistics
12.5.8.2.1.3. Disposal
and Reverse Logistics
12.5.8.2.2. Warehousing
and Material Handling
12.5.8.2.3. Packaging
12.5.8.3. Rest
of Europe Green Logistics Market Revenue (US$ Mn) and Forecasts, By Industry
12.5.8.3.1. Retail
and Consumer Goods
12.5.8.3.2. Semiconductor
and Electronics
12.5.8.3.3. Chemical
and Material
12.5.8.3.4. Automotive
12.5.8.3.5. Energy
and Utilities
12.5.8.3.6. Farming
and Agriculture
12.5.8.3.7. Others
12.6. Key
Segment for Channeling Investments
12.6.1. By
Country
12.6.2. By
Organization Size
12.6.3. By
Supply Chain Process
12.6.4. By
Industry
13. Asia Pacific Green Logistics Market Analysis and Forecasts,
2019 - 2027
13.1. Overview
13.1.1. Asia
Pacific Green Logistics Market Revenue (US$ Mn)
13.2. Asia
Pacific Green Logistics Market Revenue (US$ Mn) and Forecasts, By Organization
Size
13.2.1. Large
Enterprises
13.2.2. Small
and Medium Enterprises
13.3. Asia
Pacific Green Logistics Market Revenue (US$ Mn) and Forecasts, By Supply Chain
Process
13.3.1. Transportation
13.3.1.1. Inbound
Logistics
13.3.1.2. Outbound
Logistics
13.3.1.3. Disposal
and Reverse Logistics
13.3.2. Warehousing
and Material Handling
13.3.3. Packaging
13.4. Asia
Pacific Green Logistics Market Revenue (US$ Mn) and Forecasts, By Industry
13.4.1. Retail
and Consumer Goods
13.4.2. Semiconductor
and Electronics
13.4.3. Chemical
and Material
13.4.4. Automotive
13.4.5. Energy
and Utilities
13.4.6. Farming
and Agriculture
13.4.7. Others
13.5. Asia
Pacific Green Logistics Market Revenue (US$ Mn) and Forecasts, By Country
13.5.1. China
13.5.1.1. China
Green Logistics Market Revenue (US$ Mn) and Forecasts, By Organization Size
13.5.1.1.1. Large
Enterprises
13.5.1.1.2. Small
and Medium Enterprises
13.5.1.2. China
Green Logistics Market Revenue (US$ Mn) and Forecasts, By Supply Chain Process
13.5.1.2.1. Transportation
13.5.1.2.1.1. Inbound
Logistics
13.5.1.2.1.2. Outbound
Logistics
13.5.1.2.1.3. Disposal
and Reverse Logistics
13.5.1.2.2. Warehousing
and Material Handling
13.5.1.2.3. Packaging
13.5.1.3. China
Green Logistics Market Revenue (US$ Mn) and Forecasts, By Industry
13.5.1.3.1. Retail
and Consumer Goods
13.5.1.3.2. Semiconductor
and Electronics
13.5.1.3.3. Chemical
and Material
13.5.1.3.4. Automotive
13.5.1.3.5. Energy
and Utilities
13.5.1.3.6. Farming
and Agriculture
13.5.1.3.7. Others
13.5.2. Japan
13.5.2.1. Japan
Green Logistics Market Revenue (US$ Mn) and Forecasts, By Organization Size
13.5.2.1.1. Large
Enterprises
13.5.2.1.2. Small
and Medium Enterprises
13.5.2.2. Japan
Green Logistics Market Revenue (US$ Mn) and Forecasts, By Supply Chain Process
13.5.2.2.1. Transportation
13.5.2.2.1.1. Inbound
Logistics
13.5.2.2.1.2. Outbound
Logistics
13.5.2.2.1.3. Disposal
and Reverse Logistics
13.5.2.2.2. Warehousing
and Material Handling
13.5.2.2.3. Packaging
13.5.2.3. Japan
Green Logistics Market Revenue (US$ Mn) and Forecasts, By Industry
13.5.2.3.1. Retail
and Consumer Goods
13.5.2.3.2. Semiconductor
and Electronics
13.5.2.3.3. Chemical
and Material
13.5.2.3.4. Automotive
13.5.2.3.5. Energy
and Utilities
13.5.2.3.6. Farming
and Agriculture
13.5.2.3.7. Others
13.5.3. India
13.5.3.1. India
Green Logistics Market Revenue (US$ Mn) and Forecasts, By Organization Size
13.5.3.1.1. Large
Enterprises
13.5.3.1.2. Small
and Medium Enterprises
13.5.3.2. India
Green Logistics Market Revenue (US$ Mn) and Forecasts, By Supply Chain Process
13.5.3.2.1. Transportation
13.5.3.2.1.1. Inbound
Logistics
13.5.3.2.1.2. Outbound
Logistics
13.5.3.2.1.3. Disposal
and Reverse Logistics
13.5.3.2.2. Warehousing
and Material Handling
13.5.3.2.3. Packaging
13.5.3.3. India
Green Logistics Market Revenue (US$ Mn) and Forecasts, By Industry
13.5.3.3.1. Retail
and Consumer Goods
13.5.3.3.2. Semiconductor
and Electronics
13.5.3.3.3. Chemical
and Material
13.5.3.3.4. Automotive
13.5.3.3.5. Energy
and Utilities
13.5.3.3.6. Farming
and Agriculture
13.5.3.3.7. Others
13.5.4. New
Zealand
13.5.4.1. New
Zealand Green Logistics Market Revenue (US$ Mn) and Forecasts, By Organization
Size
13.5.4.1.1. Large
Enterprises
13.5.4.1.2. Small
and Medium Enterprises
13.5.4.2. New
Zealand Green Logistics Market Revenue (US$ Mn) and Forecasts, By Supply Chain
Process
13.5.4.2.1. Transportation
13.5.4.2.1.1. Inbound
Logistics
13.5.4.2.1.2. Outbound
Logistics
13.5.4.2.1.3. Disposal
and Reverse Logistics
13.5.4.2.2. Warehousing
and Material Handling
13.5.4.2.3. Packaging
13.5.4.3. New
Zealand Green Logistics Market Revenue (US$ Mn) and Forecasts, By Industry
13.5.4.3.1. Retail
and Consumer Goods
13.5.4.3.2. Semiconductor
and Electronics
13.5.4.3.3. Chemical
and Material
13.5.4.3.4. Automotive
13.5.4.3.5. Energy
and Utilities
13.5.4.3.6. Farming
and Agriculture
13.5.4.3.7. Others
13.5.5. Australia
13.5.5.1. Australia
Green Logistics Market Revenue (US$ Mn) and Forecasts, By Organization Size
13.5.5.1.1. Large
Enterprises
13.5.5.1.2. Small
and Medium Enterprises
13.5.5.2. Australia
Green Logistics Market Revenue (US$ Mn) and Forecasts, By Supply Chain Process
13.5.5.2.1. Transportation
13.5.5.2.1.1. Inbound
Logistics
13.5.5.2.1.2. Outbound
Logistics
13.5.5.2.1.3. Disposal
and Reverse Logistics
13.5.5.2.2. Warehousing
and Material Handling
13.5.5.2.3. Packaging
13.5.5.3. Australia
Green Logistics Market Revenue (US$ Mn) and Forecasts, By Industry
13.5.5.3.1. Retail
and Consumer Goods
13.5.5.3.2. Semiconductor
and Electronics
13.5.5.3.3. Chemical
and Material
13.5.5.3.4. Automotive
13.5.5.3.5. Energy
and Utilities
13.5.5.3.6. Farming
and Agriculture
13.5.5.3.7. Others
13.5.6. South
Korea
13.5.6.1. South
Korea Green Logistics Market Revenue (US$ Mn) and Forecasts, By Organization
Size
13.5.6.1.1. Large
Enterprises
13.5.6.1.2. Small
and Medium Enterprises
13.5.6.2. South
Korea Green Logistics Market Revenue (US$ Mn) and Forecasts, By Supply Chain
Process
13.5.6.2.1. Transportation
13.5.6.2.1.1. Inbound
Logistics
13.5.6.2.1.2. Outbound
Logistics
13.5.6.2.1.3. Disposal
and Reverse Logistics
13.5.6.2.2. Warehousing
and Material Handling
13.5.6.2.3. Packaging
13.5.6.3. South
Korea Green Logistics Market Revenue (US$ Mn) and Forecasts, By Industry
13.5.6.3.1. Retail
and Consumer Goods
13.5.6.3.2. Semiconductor
and Electronics
13.5.6.3.3. Chemical
and Material
13.5.6.3.4. Automotive
13.5.6.3.5. Energy
and Utilities
13.5.6.3.6. Farming
and Agriculture
13.5.6.3.7. Others
13.5.7. Southeast
Asia
13.5.7.1. Southeast
Asia Green Logistics Market Revenue (US$ Mn) and Forecasts, By Organization
Size
13.5.7.1.1. Large
Enterprises
13.5.7.1.2. Small
and Medium Enterprises
13.5.7.2. Southeast
Asia Green Logistics Market Revenue (US$ Mn) and Forecasts, By Supply Chain
Process
13.5.7.2.1. Transportation
13.5.7.2.1.1. Inbound
Logistics
13.5.7.2.1.2. Outbound
Logistics
13.5.7.2.1.3. Disposal
and Reverse Logistics
13.5.7.2.2. Warehousing
and Material Handling
13.5.7.2.3. Packaging
13.5.7.3. Southeast
Asia Green Logistics Market Revenue (US$ Mn) and Forecasts, By Industry
13.5.7.3.1. Retail
and Consumer Goods
13.5.7.3.2. Semiconductor
and Electronics
13.5.7.3.3. Chemical
and Material
13.5.7.3.4. Automotive
13.5.7.3.5. Energy
and Utilities
13.5.7.3.6. Farming
and Agriculture
13.5.7.3.7. Others
13.5.7.4. Southeast
Asia Green Logistics Market Revenue (US$ Mn) and Forecasts, By Country
13.5.7.4.1. Indonesia
13.5.7.4.2. Thailand
13.5.7.4.3. Malaysia
13.5.7.4.4. Singapore
13.5.7.4.5. Rest
of Southeast Asia
13.5.8. Rest of
Asia Pacific
13.5.8.1. Rest
of Asia Pacific Green Logistics Market Revenue (US$ Mn) and Forecasts, By
Organization Size
13.5.8.1.1. Large
Enterprises
13.5.8.1.2. Small
and Medium Enterprises
13.5.8.2. Rest
of Asia Pacific Green Logistics Market Revenue (US$ Mn) and Forecasts, By
Supply Chain Process
13.5.8.2.1. Transportation
13.5.8.2.1.1. Inbound
Logistics
13.5.8.2.1.2. Outbound
Logistics
13.5.8.2.1.3. Disposal
and Reverse Logistics
13.5.8.2.2. Warehousing
and Material Handling
13.5.8.2.3. Packaging
13.5.8.3. Rest
of Asia Pacific Green Logistics Market Revenue (US$ Mn) and Forecasts, By
Industry
13.5.8.3.1. Retail
and Consumer Goods
13.5.8.3.2. Semiconductor
and Electronics
13.5.8.3.3. Chemical
and Material
13.5.8.3.4. Automotive
13.5.8.3.5. Energy
and Utilities
13.5.8.3.6. Farming
and Agriculture
13.5.8.3.7. Others
13.6. Key
Segment for Channeling Investments
13.6.1. By
Country
13.6.2. By
Organization Size
13.6.3. By
Supply Chain Process
13.6.4. By
Industry
14. Middle East and Africa Green Logistics Market Analysis and
Forecasts, 2019 - 2027
14.1. Overview
14.1.1. Middle
East and Africa Green Logistics Market Revenue (US$ Mn)
14.2. Middle
East and Africa Green Logistics Market Revenue (US$ Mn) and Forecasts, By
Organization Size
14.2.1. Large
Enterprises
14.2.2. Small
and Medium Enterprises
14.3. Middle
East and Africa Green Logistics Market Revenue (US$ Mn) and Forecasts, By
Supply Chain Process
14.3.1. Transportation
14.3.1.1. Inbound
Logistics
14.3.1.2. Outbound
Logistics
14.3.1.3. Disposal
and Reverse Logistics
14.3.2. Warehousing
and Material Handling
14.3.3. Packaging
14.4. Middle
East and Africa Green Logistics Market Revenue (US$ Mn) and Forecasts, By
Industry
14.4.1. Retail
and Consumer Goods
14.4.2. Semiconductor
and Electronics
14.4.3. Chemical
and Material
14.4.4. Automotive
14.4.5. Energy
and Utilities
14.4.6. Farming
and Agriculture
14.4.7. Others
14.5. Middle
East and Africa Green Logistics Market Revenue (US$ Mn) and Forecasts, By
Country
14.5.1. Saudi
Arabia
14.5.1.1. Saudi
Arabia Green Logistics Market Revenue (US$ Mn) and Forecasts, By Organization
Size
14.5.1.1.1. Large
Enterprises
14.5.1.1.2. Small
and Medium Enterprises
14.5.1.2. Saudi
Arabia Green Logistics Market Revenue (US$ Mn) and Forecasts, By Supply Chain
Process
14.5.1.2.1. Transportation
14.5.1.2.1.1. Inbound
Logistics
14.5.1.2.1.2. Outbound
Logistics
14.5.1.2.1.3. Disposal
and Reverse Logistics
14.5.1.2.2. Warehousing
and Material Handling
14.5.1.2.3. Packaging
14.5.1.3. Saudi
Arabia Green Logistics Market Revenue (US$ Mn) and Forecasts, By Industry
14.5.1.3.1. Retail
and Consumer Goods
14.5.1.3.2. Semiconductor
and Electronics
14.5.1.3.3. Chemical
and Material
14.5.1.3.4. Automotive
14.5.1.3.5. Energy
and Utilities
14.5.1.3.6. Farming
and Agriculture
14.5.1.3.7. Others
14.5.2. UAE
14.5.2.1. UAE
Green Logistics Market Revenue (US$ Mn) and Forecasts, By Organization Size
14.5.2.1.1. Large
Enterprises
14.5.2.1.2. Small
and Medium Enterprises
14.5.2.2. UAE
Green Logistics Market Revenue (US$ Mn) and Forecasts, By Supply Chain Process
14.5.2.2.1. Transportation
14.5.2.2.1.1. Inbound
Logistics
14.5.2.2.1.2. Outbound
Logistics
14.5.2.2.1.3. Disposal
and Reverse Logistics
14.5.2.2.2. Warehousing
and Material Handling
14.5.2.2.3. Packaging
14.5.2.3. UAE
Green Logistics Market Revenue (US$ Mn) and Forecasts, By Industry
14.5.2.3.1. Retail
and Consumer Goods
14.5.2.3.2. Semiconductor
and Electronics
14.5.2.3.3. Chemical
and Material
14.5.2.3.4. Automotive
14.5.2.3.5. Energy
and Utilities
14.5.2.3.6. Farming
and Agriculture
14.5.2.3.7. Others
14.5.3. Egypt
14.5.3.1. Egypt
Green Logistics Market Revenue (US$ Mn) and Forecasts, By Organization Size
14.5.3.1.1. Large
Enterprises
14.5.3.1.2. Small
and Medium Enterprises
14.5.3.2. Egypt
Green Logistics Market Revenue (US$ Mn) and Forecasts, By Supply Chain Process
14.5.3.2.1. Transportation
14.5.3.2.1.1. Inbound
Logistics
14.5.3.2.1.2. Outbound
Logistics
14.5.3.2.1.3. Disposal
and Reverse Logistics
14.5.3.2.2. Warehousing
and Material Handling
14.5.3.2.3. Packaging
14.5.3.3. Egypt
Green Logistics Market Revenue (US$ Mn) and Forecasts, By Industry
14.5.3.3.1. Retail
and Consumer Goods
14.5.3.3.2. Semiconductor
and Electronics
14.5.3.3.3. Chemical
and Material
14.5.3.3.4. Automotive
14.5.3.3.5. Energy
and Utilities
14.5.3.3.6. Farming
and Agriculture
14.5.3.3.7. Others
14.5.4. Kuwait
14.5.4.1. Kuwait
Green Logistics Market Revenue (US$ Mn) and Forecasts, By Organization Size
14.5.4.1.1. Large
Enterprises
14.5.4.1.2. Small
and Medium Enterprises
14.5.4.2. Kuwait
Green Logistics Market Revenue (US$ Mn) and Forecasts, By Supply Chain Process
14.5.4.2.1. Transportation
14.5.4.2.1.1. Inbound
Logistics
14.5.4.2.1.2. Outbound
Logistics
14.5.4.2.1.3. Disposal
and Reverse Logistics
14.5.4.2.2. Warehousing
and Material Handling
14.5.4.2.3. Packaging
14.5.4.3. Kuwait
Green Logistics Market Revenue (US$ Mn) and Forecasts, By Industry
14.5.4.3.1. Retail
and Consumer Goods
14.5.4.3.2. Semiconductor
and Electronics
14.5.4.3.3. Chemical
and Material
14.5.4.3.4. Automotive
14.5.4.3.5. Energy
and Utilities
14.5.4.3.6. Farming
and Agriculture
14.5.4.3.7. Others
14.5.5. South
Africa
14.5.5.1. South
Africa Green Logistics Market Revenue (US$ Mn) and Forecasts, By Organization
Size
14.5.5.1.1. Large
Enterprises
14.5.5.1.2. Small
and Medium Enterprises
14.5.5.2. South
Africa Green Logistics Market Revenue (US$ Mn) and Forecasts, By Supply Chain
Process
14.5.5.2.1. Transportation
14.5.5.2.1.1. Inbound
Logistics
14.5.5.2.1.2. Outbound
Logistics
14.5.5.2.1.3. Disposal
and Reverse Logistics
14.5.5.2.2. Warehousing
and Material Handling
14.5.5.2.3. Packaging
14.5.5.3. South
Africa Green Logistics Market Revenue (US$ Mn) and Forecasts, By Industry
14.5.5.3.1. Retail
and Consumer Goods
14.5.5.3.2. Semiconductor
and Electronics
14.5.5.3.3. Chemical
and Material
14.5.5.3.4. Automotive
14.5.5.3.5. Energy
and Utilities
14.5.5.3.6. Farming
and Agriculture
14.5.5.3.7. Others
14.5.6. Rest of
Middle East & Africa
14.5.6.1. Rest
of Middle East & Africa Green Logistics Market Revenue (US$ Mn) and
Forecasts, By Organization Size
14.5.6.1.1. Large
Enterprises
14.5.6.1.2. Small
and Medium Enterprises
14.5.6.2. Rest
of Middle East & Africa Green Logistics Market Revenue (US$ Mn) and
Forecasts, By Supply Chain Process
14.5.6.2.1. Transportation
14.5.6.2.1.1. Inbound
Logistics
14.5.6.2.1.2. Outbound
Logistics
14.5.6.2.1.3. Disposal
and Reverse Logistics
14.5.6.2.2. Warehousing
and Material Handling
14.5.6.2.3. Packaging
14.5.6.3. Rest
of Middle East & Africa Green Logistics Market Revenue (US$ Mn) and
Forecasts, By Industry
14.5.6.3.1. Retail
and Consumer Goods
14.5.6.3.2. Semiconductor
and Electronics
14.5.6.3.3. Chemical
and Material
14.5.6.3.4. Automotive
14.5.6.3.5. Energy
and Utilities
14.5.6.3.6. Farming
and Agriculture
14.5.6.3.7. Others
14.6. Key
Segment for Channeling Investments
14.6.1. By
Country
14.6.2. By
Organization Size
14.6.3. By
Supply Chain Process
14.6.4. By
Industry
15. Latin America Green Logistics Market Analysis and Forecasts,
2019 - 2027
15.1. Overview
15.1.1. Latin
America Green Logistics Market Revenue (US$ Mn)
15.2. Latin
America Green Logistics Market Revenue (US$ Mn) and Forecasts, By Organization
Size
15.2.1. Large
Enterprises
15.2.2. Small
and Medium Enterprises
15.3. Latin
America Green Logistics Market Revenue (US$ Mn) and Forecasts, By Supply Chain
Process
15.3.1. Transportation
15.3.1.1. Inbound
Logistics
15.3.1.2. Outbound
Logistics
15.3.1.3. Disposal
and Reverse Logistics
15.3.2. Warehousing
and Material Handling
15.3.3. Packaging
15.4. Latin
America Green Logistics Market Revenue (US$ Mn) and Forecasts, By Industry
15.4.1. Retail
and Consumer Goods
15.4.2. Semiconductor
and Electronics
15.4.3. Chemical
and Material
15.4.4. Automotive
15.4.5. Energy
and Utilities
15.4.6. Farming
and Agriculture
15.4.7. Others
15.5. Latin
America Green Logistics Market Revenue (US$ Mn) and Forecasts, By Country
15.5.1. Brazil
15.5.1.1. Brazil
Green Logistics Market Revenue (US$ Mn) and Forecasts, By Organization Size
15.5.1.1.1. Large
Enterprises
15.5.1.1.2. Small
and Medium Enterprises
15.5.1.2. Brazil
Green Logistics Market Revenue (US$ Mn) and Forecasts, By Supply Chain Process
15.5.1.2.1. Transportation
15.5.1.2.1.1. Inbound
Logistics
15.5.1.2.1.2. Outbound
Logistics
15.5.1.2.1.3. Disposal
and Reverse Logistics
15.5.1.2.2. Warehousing
and Material Handling
15.5.1.2.3. Packaging
15.5.1.3. Brazil
Green Logistics Market Revenue (US$ Mn) and Forecasts, By Industry
15.5.1.3.1. Retail
and Consumer Goods
15.5.1.3.2. Semiconductor
and Electronics
15.5.1.3.3. Chemical
and Material
15.5.1.3.4. Automotive
15.5.1.3.5. Energy
and Utilities
15.5.1.3.6. Farming
and Agriculture
15.5.1.3.7. Others
15.5.2. Argentina
15.5.2.1. Argentina
Green Logistics Market Revenue (US$ Mn) and Forecasts, By Organization Size
15.5.2.1.1. Large
Enterprises
15.5.2.1.2. Small
and Medium Enterprises
15.5.2.2. Argentina
Green Logistics Market Revenue (US$ Mn) and Forecasts, By Supply Chain Process
15.5.2.2.1. Transportation
15.5.2.2.1.1. Inbound
Logistics
15.5.2.2.1.2. Outbound
Logistics
15.5.2.2.1.3. Disposal
and Reverse Logistics
15.5.2.2.2. Warehousing
and Material Handling
15.5.2.2.3. Packaging
15.5.2.3. Argentina
Green Logistics Market Revenue (US$ Mn) and Forecasts, By Industry
15.5.2.3.1. Retail
and Consumer Goods
15.5.2.3.2. Semiconductor
and Electronics
15.5.2.3.3. Chemical
and Material
15.5.2.3.4. Automotive
15.5.2.3.5. Energy
and Utilities
15.5.2.3.6. Farming
and Agriculture
15.5.2.3.7. Others
15.5.3. Rest of
Latin America
15.5.3.1. Rest
of Latin America Green Logistics Market Revenue (US$ Mn) and Forecasts, By
Organization Size
15.5.3.1.1. Large
Enterprises
15.5.3.1.2. Small
and Medium Enterprises
15.5.3.2. Rest
of Latin America Green Logistics Market Revenue (US$ Mn) and Forecasts, By
Supply Chain Process
15.5.3.2.1. Transportation
15.5.3.2.1.1. Inbound
Logistics
15.5.3.2.1.2. Outbound
Logistics
15.5.3.2.1.3. Disposal
and Reverse Logistics
15.5.3.2.2. Warehousing
and Material Handling
15.5.3.2.3. Packaging
15.5.3.3. Rest
of Latin America Green Logistics Market Revenue (US$ Mn) and Forecasts, By
Industry
15.5.3.3.1. Retail
and Consumer Goods
15.5.3.3.2. Semiconductor
and Electronics
15.5.3.3.3. Chemical
and Material
15.5.3.3.4. Automotive
15.5.3.3.5. Energy
and Utilities
15.5.3.3.6. Farming
and Agriculture
15.5.3.3.7. Others
15.6. Key
Segment for Channeling Investments
15.6.1. By
Country
15.6.2. By
Organization Size
15.6.3. By
Supply Chain Process
15.6.4. By
Industry
16. Competitive Benchmarking
16.1. Market
Share Analysis, 2018
16.2. Global
Presence and Growth Strategies
16.2.1. Mergers
and Acquisitions
16.2.2. Product
Launches
16.2.3. Investments
Trends
16.2.4. R&D
Initiatives
17. Player Profiles
17.1. 20Cube
Logistics Pte Ltd
17.1.1. Company
Details
17.1.2. Company
Overview
17.1.3. Product
Offerings
17.1.4. Key
Developments
17.1.5. Financial
Analysis
17.1.6. SWOT
Analysis
17.1.7. Business
Strategies
17.2. Al
Futtaim Logistics
17.2.1. Company
Details
17.2.2. Company
Overview
17.2.3. Product
Offerings
17.2.4. Key
Developments
17.2.5. Financial
Analysis
17.2.6. SWOT
Analysis
17.2.7. Business
Strategies
17.3. Bolloré
Logistics
17.3.1. Company
Details
17.3.2. Company
Overview
17.3.3. Product
Offerings
17.3.4. Key
Developments
17.3.5. Financial
Analysis
17.3.6. SWOT
Analysis
17.3.7. Business
Strategies
17.4. Bowling
Green Logistics
17.4.1. Company
Details
17.4.2. Company
Overview
17.4.3. Product
Offerings
17.4.4. Key
Developments
17.4.5. Financial
Analysis
17.4.6. SWOT Analysis
17.4.7. Business
Strategies
17.5. DHL
International GmbH
17.5.1. Company
Details
17.5.2. Company
Overview
17.5.3. Product
Offerings
17.5.4. Key
Developments
17.5.5. Financial
Analysis
17.5.6. SWOT
Analysis
17.5.7. Business
Strategies
17.6. Express
Freight Management
17.6.1. Company
Details
17.6.2. Company
Overview
17.6.3. Product
Offerings
17.6.4. Key Developments
17.6.5. Financial
Analysis
17.6.6. SWOT
Analysis
17.6.7. Business
Strategies
17.7. Fujitsu
Limited
17.7.1. Company
Details
17.7.2. Company
Overview
17.7.3. Product
Offerings
17.7.4. Key
Developments
17.7.5. Financial
Analysis
17.7.6. SWOT
Analysis
17.7.7. Business
Strategies
17.8. Go Green
Logistics
17.8.1. Company
Details
17.8.2. Company
Overview
17.8.3. Product
Offerings
17.8.4. Key
Developments
17.8.5. Financial
Analysis
17.8.6. SWOT
Analysis
17.8.7. Business
Strategies
17.9. Hupac
Group
17.9.1. Company
Details
17.9.2. Company
Overview
17.9.3. Product
Offerings
17.9.4. Key
Developments
17.9.5. Financial
Analysis
17.9.6. SWOT
Analysis
17.9.7. Business
Strategies
17.10. KLG
Europe
17.10.1. Company
Details
17.10.2. Company
Overview
17.10.3. Product
Offerings
17.10.4. Key
Developments
17.10.5. Financial
Analysis
17.10.6. SWOT
Analysis
17.10.7. Business
Strategies
17.11. Mahindra
Logistics Ltd.
17.11.1. Company
Details
17.11.2. Company
Overview
17.11.3. Product
Offerings
17.11.4. Key
Developments
17.11.5. Financial
Analysis
17.11.6. SWOT
Analysis
17.11.7. Business
Strategies
17.12. Peter
Green Chilled
17.12.1. Company
Details
17.12.2. Company
Overview
17.12.3. Product
Offerings
17.12.4. Key
Developments
17.12.5. Financial
Analysis
17.12.6. SWOT
Analysis
17.12.7. Business
Strategies
17.13. The
Green Group
17.13.1. Company
Details
17.13.2. Company
Overview
17.13.3. Product
Offerings
17.13.4. Key
Developments
17.13.5. Financial
Analysis
17.13.6. SWOT
Analysis
17.13.7. Business
Strategies
17.14. Transervice
Logistics Inc.
17.14.1. Company
Details
17.14.2. Company
Overview
17.14.3. Product
Offerings
17.14.4. Key
Developments
17.14.5. Financial
Analysis
17.14.6. SWOT
Analysis
17.14.7. Business
Strategies
17.15. United
Parcel Service of America, Inc.
17.15.1. Company
Details
17.15.2. Company
Overview
17.15.3. Product
Offerings
17.15.4. Key Developments
17.15.5. Financial
Analysis
17.15.6. SWOT
Analysis
17.15.7. Business
Strategies
17.16. Westerman
Multimodal Logistics
17.16.1. Company
Details
17.16.2. Company
Overview
17.16.3. Product
Offerings
17.16.4. Key
Developments
17.16.5. Financial
Analysis
17.16.6. SWOT
Analysis
17.16.7. Business
Strategies
17.17. Other
Market Participants
18. Key Findings
At Absolute Markets Insights, we are engaged in building both global as well as country specific reports. As a result, the approach taken for deriving the estimation and forecast for a specific country is a bit unique and different in comparison to the global research studies. In this case, we not only study the concerned market factors & trends prevailing in a particular country (from secondary research) but we also tend to calculate the actual market size & forecast from the revenue generated from the market participants involved in manufacturing or distributing the any concerned product. These companies can also be service providers. For analyzing any country specifically, we do consider the growth factors prevailing under the states/cities/county for the same. For instance, if we are analyzing an industry specific to United States, we primarily need to study about the states present under the same(where the product/service has the highest growth). Similar analysis will be followed by other countries. Our scope of the report changes with different markets.
Our research study is mainly implement through a mix of both secondary and primary research. Various sources such as industry magazines, trade journals, and government websites and trade associations are reviewed for gathering precise data. Primary interviews are conducted to validate the market size derived from secondary research. Industry experts, major manufacturers and distributors are contacted for further validation purpose on the current market penetration and growth trends.
Prominent participants in our primary research process include:
- Key Opinion Leaders namely the CEOs, CSOs, VPs, purchasing managers, amongst others
- Research and development participants, distributors/suppliers and subject matter experts
Secondary Research includes data extracted from paid data sources:
- Reuters
- Factiva
- Bloomberg
- One Source
- Hoovers
Research Methodology

Key Inclusions


