
Global Mitigation Banking Market, by Type (Wetland or Stream Banks, Conservation Banks, Forest Conservation), by Verticals (Construction and Mining, Energy and Utilities, Manufacturing, Healthcare, Transportation, Others), by Region (United States, Canada, Mexico, France, The UK, Spain, Germany, Italy, Nordic Countries, Benelux Union, Rest of Europe, China, Japan, India, New Zealand, Australia, South Korea, Southeast Asia, Rest of Asia Pacific, Brazil, Argentina, Rest of Latin America, Saudi Arabia, UAE, Egypt, Kuwait, South Africa, Rest of Middle East & Africa) — Global Insights, Growth, Size, Comparative Analysis, Trends and Forecast, 2019–2027
Market Overview/Industry Trends
Mitigation banking is a structure of credits and debits developed to safeguard the ecological loss caused to the environment, especially to wetlands or stream banks resulting from development or construction works. Mitigation banking market system involves the compensation for the prevention as well as restoration of natural habitats, conservation banks, and forest lands in order to maintain the balance to the net loss caused during development work to the ecosystem. The definition of mitigation banking varies across different regulatory bodies but aims for compensation for unavoidable impacts caused to the environment. According to the National Mitigation Banking Association (NMBA), “mitigation banking is the restoration, creation, enhancement, or preservation of a wetland, stream, or other habitat area undertaken expressly to compensate for unavoidable resource losses in advance of development actions when such compensation cannot be achieved at the development site or would not be as environmentally beneficial.”
Mitigation banking aids to balance the undesirable effects of escalating industrialization on natural habitats and wetlands to a greater extent. A significant challenge faced by potential investors of mitigation banking is lack of access to quantitative data pertaining to wetland credit costs is hindering the growth of the market. Involvement of engineers, consultants, contractors, landowners, nurseries, corporations, non-profits, resource agencies among others in the global mitigation banking industry is projected to positively impact the growth of the mitigation banking market during the forecast period.
In general there are two types of mitigation banks: Wetland or stream banks and Conservation banks. The wetland or stream mitigation banks offers credits to compensate the damage caused to wetlands and streams due to industrialization. The wetland or stream mitigation banks are approved by USEPA (Environmental Protection Agency) and USACE (Army Corps of Engineers). The conservation banks offers credits when there is damage to losses of endangered species or habitats. The conservation mitigation banks are approved by NMFS (National Marine Fisheries Service) and USFWS (Fish and Wildlife Service). In general there are four components of mitigation banks: bank site, bank instrument, interagency review team (IRT) and bank service area. The IRT team provides final approval of a site for mitigation bank in global mitigation banking market.
Governments across various geographies are constantly making efforts by introducing various conservation acts with an aim to provide mitigation banking services to industries at large. For instance, the NMBA’s federal legislation that includes, Endangered Species Act and the Clean Water Act aims to assist the mitigation banking industry by ensuring developers compensate for the ecological harm they cause through their infrastructure projects and developments. Similarly, in 2019, the Florida Association of Mitigation Bankers (FAMB) signed HB 521 into the mitigation law that amends the mitigation decisions for wetlands that are impacted by developments. With this initiative, the FAMB ensured that road construction can be built in a timely manner while protecting Florida’s valuable natural resources at the same time. Furthermore, FAMB also reported that Florida’s mitigation banks have witnessed significant growth and serviced nearly 4,280 federal permits, thereby protecting over 180,000 acres of habitat as a part of over 100 approved mitigation banks in Florida thus increasing the market size of the U.S. mitigation banking market.
The ability of private conservation businesses to generate credits for enhanced as well as restored streams for protected habitats enables them to offset their environmental impact along with meeting state, as well as federal requirements, is projected to propel the market. Mitigation banking enables developers of public as well as private projects to purchase credits in order to mitigate, or offset, their own unavoidable impact on wetlands. Furthermore, rising investments done by mitigation bankers with an aim to buy credits for their projects are contributing to the growth of the market. For example in 2019, The Earth Partners invested millions of dollars in refurbishment upfront, thereby pushing the developers to buy credits from them for their projects. Thus, such factors are projected to contribute to the growth of the mitigation banking market during the forecast period.
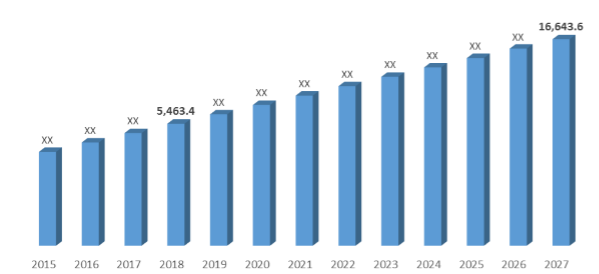
In terms of revenue, the global mitigation banking market accounted for US$ 5,463.4 Mn in 2018 and is anticipated to reach US$ 16,643.6 Mn by 2027 growing at a CAGR of 13.5% over the forecast period. The study analyzes the market in terms of revenue across all the major regions, which has been further bifurcated into countries.
Smart Mitigation Banking Market Revenue & Forecast, (US$ Million), 2015–2027
Verticals Outlook:
Construction and mining industry accounted for the largest share of the market in global mitigation banking market. Rise in construction activities in emerging economies including China, India is leading to increased destruction of environment resources which subsequently is driving the adoption of mitigation baking systems. In addition, the ability of a mitigation banking system to effectively transfer the liability of ecological loss done by construction and mining industries has further contributed to the growth of the segment. Furthermore, increasing approval in the number of mitigation banks has generated opportunities for construction and mining, energy and utilities, and manufacturing industries to leverage the notions of mitigation banking. Thus, such factors are anticipated to propel the mitigation banking market during the forecast period.
Regional Outlook:
Governments across the globe are gradually adopting mitigation banking systems to protect the environment owing to continuous rise in environmental degradation with increase in urbanization and industrialization. Rise in environmental degradation resulting in increase in sea levels that threaten the existence of several inhabited islands, especially in the Asia Pacific region. Developed region such as North America and Europe are focused on environmental protection and are pioneers in mitigation banking system. North America mitigation banking market dominate the global mitigation banking market followed by Europe. Based on the revenue, North America held the highest share in the global mitigation banking market in 2018. In 2018, North America occupied 62.9% of the market share in 2018, followed by Europe which had 18.4% of the share. All levels of the government in the U.S., i.e. the federal, state and local, implement some measures to tackle the loss of environment on account of development measures. The United States Environment Protection Agency (USEPA) spearheads the mitigation activities in the U.S. Organizations collaborate with mitigation bankers for complying with the government regulations in the U.S. North America is also expected to show the highest growth during the forecast years, at a CAGR of 14.9%.
Competitive Landscape
The report provides both qualitative and quantitative research of the lawsuit financing market as well as provides comprehensive insights and development methods adopted by the prominent market players. Some of the key market participants in the mitigation banking market are Alafia River Wetland Mitigation Bank, Inc., Burns & McDonnell, EarthBalance, Ecosystem Services, LLC, Habitat Bank LLC, The Mitigation Banking Group, Inc., Ecosystem Investment Partners (EIP), The Wetlandsbank Company, Wetland Studies and Solutions, Inc., Weyerhaeuser, LJA Environmental Services, Inc., Wildwood Environmental Credit Company, WRA, Inc., The Loudermilk Companies, LLC, Great Ecology, Mitigation Credit Services, LLC,, amongst others. There is increasing collaboration between the market players, especially in North America. Recently, the rebranding of the National Mitigation Banking Association (NMBA) was completed. NMBA was renamed to Ecological Restoration Business Association. The association aims at increasing awareness among the stakeholders so as to nullify the adverse effects of climate change. The report will include the business strategies, key development and SWOT analysis of the prominent market players, amongst other parameters.

Global Mitigation Banking Market:
- By Type
- Wetland or Stream Banks
- Conservation Banks
- Forest Conservation
- By Verticals
- Construction and Mining
- Energy and Utilities
- Manufacturing
- Healthcare
- Transportation
- Others
- By Geography
- North America
- United States
- Canada
- Mexico
- Europe
- France
- The UK
- Spain
- Germany
- Italy
- Nordic Countries
- Denmark
- Finland
- Iceland
- Sweden
- Norway
- Benelux Union
- Belgium
- The Netherlands
- Luxembourg
- Rest of Europe
- Asia Pacific
- China
- Japan
- India
- New Zealand
- Australia
- South Korea
- Southeast Asia
- Indonesia
- Thailand
- Malaysia
- Singapore
- Rest of Southeast Asia
- Rest of Asia Pacific
- Latin America
- Brazil
- Argentina
- Rest of Latin America
- Middle East and Africa
- Saudi Arabia
- UAE
- Egypt
- Kuwait
- South Africa
- Rest of Middle East & Africa
- North America
Table of Contents
1.
Market Scope
1.1. Market Segmentation
1.2. Years Considered
1.2.1. Historic Years: 2013 - 2017
1.2.2. Base Year: 2018
1.2.3. Forecast Years: 2019 – 2027
2.
Key Target Audiences
3.
Research Methodology
3.1. Primary Research
3.1.1. Research Questionnaire
3.1.2. Global Percentage Breakdown
3.1.3. Primary Interviews: Key Opinion Leaders (KOLs)
3.2. Secondary Research
3.2.1. Paid Databases
3.2.2. Secondary Sources
3.3. Market Size Estimates
3.3.1. Top-Down Approach
3.3.2. Bottom-Up Approach
3.4. Data Triangulation Methodology
3.5. Research Assumptions
4.
Recommendations and
Insights from AMI’s Perspective**
5.
Holistic Overview of Mitigation Banking Market
6.
Market Synopsis: Mitigation Banking Market
7.
Mitigation Banking Market Analysis: Qualitative Perspective
7.1. Introduction
7.1.1. Product Definition
7.1.2. Industry Development
7.2. Market Dynamics
7.2.1. Drivers
7.2.2. Restraints
7.2.3. Opportunities
7.2.4. Challenges
7.3. Trends in Mitigation
Banking Market
7.4. Market Determinants Radar Chart
7.5. Macro-Economic and Micro-Economic Indicators: Mitigation Banking Market
7.6. Porter’s Five Force Analysis
8.
Global Mitigation Banking Market Analysis and Forecasts, 2019 – 2027
8.1. Overview
8.1.1. Global Mitigation
Banking Market Revenue (US$ Mn)
8.2. Global Mitigation
Banking Market Revenue (US$ Mn) and
Forecasts, By Type
8.2.1. Wetland or Stream Banks
8.2.1.1. Definition
8.2.1.2. Market Estimation and Penetration, 2013 – 2018
8.2.1.3. Market Forecast, 2019 – 2027
8.2.1.4. Compound Annual Growth Rate (CAGR)
8.2.1.5. Regional Bifurcation
8.2.1.5.1. North America
8.2.1.5.1.1. Market Estimation, 2013 – 2018
8.2.1.5.1.2. Market Forecast, 2019 – 2027
8.2.1.5.2. Europe
8.2.1.5.2.1. Market Estimation, 2013 – 2018
8.2.1.5.2.2. Market Forecast, 2019 – 2027
8.2.1.5.3. Asia Pacific
8.2.1.5.3.1. Market Estimation, 2013 – 2018
8.2.1.5.3.2. Market Forecast, 2019 – 2027
8.2.1.5.4. Middle East and Africa
8.2.1.5.4.1. Market Estimation, 2013 – 2018
8.2.1.5.4.2. Market Forecast, 2019 – 2027
8.2.1.5.5. Latin America
8.2.1.5.5.1. Market Estimation, 2013 – 2018
8.2.1.5.5.2. Market Forecast, 2019 – 2027
8.2.2. Conservation Banks
8.2.2.1. Definition
8.2.2.2. Market Estimation and Penetration, 2013 – 2018
8.2.2.3. Market Forecast, 2019 – 2027
8.2.2.4. Compound Annual Growth Rate (CAGR)
8.2.2.5. Regional Bifurcation
8.2.2.5.1. North America
8.2.2.5.1.1. Market Estimation, 2013 – 2018
8.2.2.5.1.2. Market Forecast, 2019 – 2027
8.2.2.5.2. Europe
8.2.2.5.2.1. Market Estimation, 2013 – 2018
8.2.2.5.2.2. Market Forecast, 2019 – 2027
8.2.2.5.3. Asia Pacific
8.2.2.5.3.1. Market Estimation, 2013 – 2018
8.2.2.5.3.2. Market Forecast, 2019 – 2027
8.2.2.5.4. Middle East and Africa
8.2.2.5.4.1. Market Estimation, 2013 – 2018
8.2.2.5.4.2. Market Forecast, 2019 – 2027
8.2.2.5.5. Latin America
8.2.2.5.5.1. Market Estimation, 2013 – 2018
8.2.2.5.5.2. Market Forecast, 2019 – 2027
8.2.3. Forest Conservation
8.2.3.1. Definition
8.2.3.2. Market Estimation and Penetration, 2013 – 2018
8.2.3.3. Market Forecast, 2019 – 2027
8.2.3.4. Compound Annual Growth Rate (CAGR)
8.2.3.5. Regional Bifurcation
8.2.3.5.1. North America
8.2.3.5.1.1. Market Estimation, 2013 – 2018
8.2.3.5.1.2. Market Forecast, 2019 – 2027
8.2.3.5.2. Europe
8.2.3.5.2.1. Market Estimation, 2013 – 2018
8.2.3.5.2.2. Market Forecast, 2019 – 2027
8.2.3.5.3. Asia Pacific
8.2.3.5.3.1. Market Estimation, 2013 – 2018
8.2.3.5.3.2. Market Forecast, 2019 – 2027
8.2.3.5.4. Middle East and Africa
8.2.3.5.4.1. Market Estimation, 2013 – 2018
8.2.3.5.4.2. Market Forecast, 2019 – 2027
8.2.3.5.5. Latin America
8.2.3.5.5.1. Market Estimation, 2013 – 2018
8.2.3.5.5.2. Market Forecast, 2019 – 2027
8.3. Key Segment for Channeling Investments
8.3.1. By Type
9.
Global Mitigation Banking Market Analysis and Forecasts, 2019 – 2027
9.1. Overview
9.2. Global Mitigation
Banking Market Revenue (US$ Mn) and
Forecasts, By Verticals
9.2.1. Construction and Mining
9.2.1.1. Definition
9.2.1.2. Market Estimation and Penetration, 2013 – 2018
9.2.1.3. Market Forecast, 2019 – 2027
9.2.1.4. Compound Annual Growth Rate (CAGR)
9.2.1.5. Regional Bifurcation
9.2.1.5.1. North America
9.2.1.5.1.1. Market Estimation, 2013 – 2018
9.2.1.5.1.2. Market Forecast, 2019 – 2027
9.2.1.5.2. Europe
9.2.1.5.2.1. Market Estimation, 2013 – 2018
9.2.1.5.2.2. Market Forecast, 2019 – 2027
9.2.1.5.3. Asia Pacific
9.2.1.5.3.1. Market Estimation, 2013 – 2018
9.2.1.5.3.2. Market Forecast, 2019 – 2027
9.2.1.5.4. Middle East and Africa
9.2.1.5.4.1. Market Estimation, 2013 – 2018
9.2.1.5.4.2. Market Forecast, 2019 – 2027
9.2.1.5.5. Latin America
9.2.1.5.5.1. Market Estimation, 2013 – 2018
9.2.1.5.5.2. Market Forecast, 2019 – 2027
9.2.2. Energy and Utilities
9.2.2.1. Definition
9.2.2.2. Market Estimation and Penetration, 2013 – 2018
9.2.2.3. Market Forecast, 2019 – 2027
9.2.2.4. Compound Annual Growth Rate (CAGR)
9.2.2.5. Regional Bifurcation
9.2.2.5.1. North America
9.2.2.5.1.1. Market Estimation, 2013 – 2018
9.2.2.5.1.2. Market Forecast, 2019 – 2027
9.2.2.5.2. Europe
9.2.2.5.2.1. Market Estimation, 2013 – 2018
9.2.2.5.2.2. Market Forecast, 2019 – 2027
9.2.2.5.3. Asia Pacific
9.2.2.5.3.1. Market Estimation, 2013 – 2018
9.2.2.5.3.2. Market Forecast, 2019 – 2027
9.2.2.5.4. Middle East and Africa
9.2.2.5.4.1. Market Estimation, 2013 – 2018
9.2.2.5.4.2. Market Forecast, 2019 – 2027
9.2.2.5.5. Latin America
9.2.2.5.5.1. Market Estimation, 2013 – 2018
9.2.2.5.5.2. Market Forecast, 2019 – 2027
9.2.3. Manufacturing
9.2.3.1. Definition
9.2.3.2. Market Estimation and Penetration, 2013 – 2018
9.2.3.3. Market Forecast, 2019 – 2027
9.2.3.4. Compound Annual Growth Rate (CAGR)
9.2.3.5. Regional Bifurcation
9.2.3.5.1. North America
9.2.3.5.1.1. Market Estimation, 2013 – 2018
9.2.3.5.1.2. Market Forecast, 2019 – 2027
9.2.3.5.2. Europe
9.2.3.5.2.1. Market Estimation, 2013 – 2018
9.2.3.5.2.2. Market Forecast, 2019 – 2027
9.2.3.5.3. Asia Pacific
9.2.3.5.3.1. Market Estimation, 2013 – 2018
9.2.3.5.3.2. Market Forecast, 2019 – 2027
9.2.3.5.4. Middle East and Africa
9.2.3.5.4.1. Market Estimation, 2013 – 2018
9.2.3.5.4.2. Market Forecast, 2019 – 2027
9.2.3.5.5. Latin America
9.2.3.5.5.1. Market Estimation, 2013 – 2018
9.2.3.5.5.2. Market Forecast, 2019 – 2027
9.2.4. Healthcare
9.2.4.1. Definition
9.2.4.2. Market Estimation and Penetration, 2013 – 2018
9.2.4.3. Market Forecast, 2019 – 2027
9.2.4.4. Compound Annual Growth Rate (CAGR)
9.2.4.5. Regional Bifurcation
9.2.4.5.1. North America
9.2.4.5.1.1. Market Estimation, 2013 – 2018
9.2.4.5.1.2. Market Forecast, 2019 – 2027
9.2.4.5.2. Europe
9.2.4.5.2.1. Market Estimation, 2013 – 2018
9.2.4.5.2.2. Market Forecast, 2019 – 2027
9.2.4.5.3. Asia Pacific
9.2.4.5.3.1. Market Estimation, 2013 – 2018
9.2.4.5.3.2. Market Forecast, 2019 – 2027
9.2.4.5.4. Middle East and Africa
9.2.4.5.4.1. Market Estimation, 2013 – 2018
9.2.4.5.4.2. Market Forecast, 2019 – 2027
9.2.4.5.5. Latin America
9.2.4.5.5.1. Market Estimation, 2013 – 2018
9.2.4.5.5.2. Market Forecast, 2019 – 2027
9.2.5. Transportation
9.2.5.1. Definition
9.2.5.2. Market Estimation and Penetration, 2013 – 2018
9.2.5.3. Market Forecast, 2019 – 2027
9.2.5.4. Compound Annual Growth Rate (CAGR)
9.2.5.5. Regional Bifurcation
9.2.5.5.1. North America
9.2.5.5.1.1. Market Estimation, 2013 – 2018
9.2.5.5.1.2. Market Forecast, 2019 – 2027
9.2.5.5.2. Europe
9.2.5.5.2.1. Market Estimation, 2013 – 2018
9.2.5.5.2.2. Market Forecast, 2019 – 2027
9.2.5.5.3. Asia Pacific
9.2.5.5.3.1. Market Estimation, 2013 – 2018
9.2.5.5.3.2. Market Forecast, 2019 – 2027
9.2.5.5.4. Middle East and Africa
9.2.5.5.4.1. Market Estimation, 2013 – 2018
9.2.5.5.4.2. Market Forecast, 2019 – 2027
9.2.5.5.5. Latin America
9.2.5.5.5.1. Market Estimation, 2013 – 2018
9.2.5.5.5.2. Market Forecast, 2019 – 2027
9.2.6. Others
9.2.6.1. Definition
9.2.6.2. Market Estimation and Penetration, 2013 – 2018
9.2.6.3. Market Forecast, 2019 – 2027
9.2.6.4. Compound Annual Growth Rate (CAGR)
9.2.6.5. Regional Bifurcation
9.2.6.5.1. North America
9.2.6.5.1.1. Market Estimation, 2013 – 2018
9.2.6.5.1.2. Market Forecast, 2019 – 2027
9.2.6.5.2. Europe
9.2.6.5.2.1. Market Estimation, 2013 – 2018
9.2.6.5.2.2. Market Forecast, 2019 – 2027
9.2.6.5.3. Asia Pacific
9.2.6.5.3.1. Market Estimation, 2013 – 2018
9.2.6.5.3.2. Market Forecast, 2019 – 2027
9.2.6.5.4. Middle East and Africa
9.2.6.5.4.1. Market Estimation, 2013 – 2018
9.2.6.5.4.2. Market Forecast, 2019 – 2027
9.2.6.5.5. Latin America
9.2.6.5.5.1. Market Estimation, 2013 – 2018
9.2.6.5.5.2. Market Forecast, 2019 – 2027
9.3. Key Segment for Channeling Investments
9.3.1. By Verticals
10.
North America Mitigation Banking Market Analysis and Forecasts, 2019 - 2027
10.1. Overview
10.1.1. North America
Mitigation Banking Market Revenue
(US$ Mn)
10.2. North America
Mitigation Banking Market Revenue
(US$ Mn) and Forecasts, By Type
10.2.1. Wetland or Stream Banks
10.2.2. Conservation Banks
10.2.3. Forest Conservation
10.3. North America
Mitigation Banking Market Revenue
(US$ Mn) and Forecasts, By Verticals
10.3.1. Construction and Mining
10.3.2. Energy and Utilities
10.3.3. Manufacturing
10.3.4. Healthcare
10.3.5. Transportation
10.3.6. Others
10.4. North America
Mitigation Banking Market Revenue
(US$ Mn) and Forecasts, By Country
10.4.1. U.S
10.4.1.1. U.S Mitigation
Banking Market Revenue (US$ Mn) and
Forecasts, By Type
10.4.1.1.1. Wetland or Stream Banks
10.4.1.1.2. Conservation Banks
10.4.1.1.3. Forest Conservation
10.4.1.2. U.S Mitigation
Banking Market Revenue (US$ Mn) and
Forecasts, By Verticals
10.4.1.2.1. Construction and Mining
10.4.1.2.2. Energy and Utilities
10.4.1.2.3. Manufacturing
10.4.1.2.4. Healthcare
10.4.1.2.5. Transportation
10.4.1.2.6. Others
10.4.2. Canada
10.4.2.1. Canada Mitigation
Banking Market Revenue (US$ Mn) and
Forecasts, By Type
10.4.2.1.1. Wetland or Stream Banks
10.4.2.1.2. Conservation Banks
10.4.2.1.3. Forest Conservation
10.4.2.2. Canada Mitigation
Banking Market Revenue (US$ Mn) and
Forecasts, By Verticals
10.4.2.2.1. Construction and Mining
10.4.2.2.2. Energy and Utilities
10.4.2.2.3. Manufacturing
10.4.2.2.4. Healthcare
10.4.2.2.5. Transportation
10.4.2.2.6. Others
10.4.3. Mexico
10.4.3.1. Mexico Mitigation
Banking Market Revenue (US$ Mn) and
Forecasts, By Type
10.4.3.1.1. Wetland or Stream Banks
10.4.3.1.2. Conservation Banks
10.4.3.1.3. Forest Conservation
10.4.3.2. Mexico Mitigation
Banking Market Revenue (US$ Mn) and
Forecasts, By Verticals
10.4.3.2.1. Construction and Mining
10.4.3.2.2. Energy and Utilities
10.4.3.2.3. Manufacturing
10.4.3.2.4. Healthcare
10.4.3.2.5. Transportation
10.4.3.2.6. Others
10.4.4. Rest of North America
10.4.4.1. Rest of North America
Mitigation Banking Market Revenue
(US$ Mn) and Forecasts, By Type
10.4.4.1.1. Wetland or Stream Banks
10.4.4.1.2. Conservation Banks
10.4.4.1.3. Forest Conservation
10.4.4.2. Rest of North America
Mitigation Banking Market Revenue
(US$ Mn) and Forecasts, By Verticals
10.4.4.2.1. Construction and Mining
10.4.4.2.2. Energy and Utilities
10.4.4.2.3. Manufacturing
10.4.4.2.4. Healthcare
10.4.4.2.5. Transportation
10.4.4.2.6. Others
10.5. Key Segment for Channeling Investments
10.5.1. By Country
10.5.2. By Type
10.5.3. By Verticals
11.
Europe Mitigation Banking Market Analysis and Forecasts, 2019 - 2027
11.1. Overview
11.1.1. Europe Mitigation
Banking Market Revenue (US$ Mn)
11.2. Europe Mitigation
Banking Market Revenue (US$ Mn) and
Forecasts, By Type
11.2.1. Wetland or Stream Banks
11.2.2. Conservation Banks
11.2.3. Forest Conservation
11.3. Europe Mitigation
Banking Market Revenue (US$ Mn) and
Forecasts, By Verticals
11.3.1. Construction and Mining
11.3.2. Energy and Utilities
11.3.3. Manufacturing
11.3.4. Healthcare
11.3.5. Transportation
11.3.6. Others
11.4. Europe Mitigation
Banking Market Revenue (US$ Mn) and
Forecasts, By Country
11.4.1. France
11.4.1.1. France Mitigation
Banking Market Revenue (US$ Mn) and
Forecasts, By Type
11.4.1.1.1. Wetland or Stream Banks
11.4.1.1.2. Conservation Banks
11.4.1.1.3. Forest Conservation
11.4.1.2. France Mitigation
Banking Market Revenue (US$ Mn) and
Forecasts, By Verticals
11.4.1.2.1. Construction and Mining
11.4.1.2.2. Energy and Utilities
11.4.1.2.3. Manufacturing
11.4.1.2.4. Healthcare
11.4.1.2.5. Transportation
11.4.1.2.6. Others
11.4.2. The UK
11.4.2.1. The UK Mitigation
Banking Market Revenue (US$ Mn) and
Forecasts, By Type
11.4.2.1.1. Wetland or Stream Banks
11.4.2.1.2. Conservation Banks
11.4.2.1.3. Forest Conservation
11.4.2.2. The UK Mitigation
Banking Market Revenue (US$ Mn) and
Forecasts, By Verticals
11.4.2.2.1. Construction and Mining
11.4.2.2.2. Energy and Utilities
11.4.2.2.3. Manufacturing
11.4.2.2.4. Healthcare
11.4.2.2.5. Transportation
11.4.2.2.6. Others
11.4.3. Spain
11.4.3.1. Spain Mitigation
Banking Market Revenue (US$ Mn) and
Forecasts, By Type
11.4.3.1.1. Wetland or Stream Banks
11.4.3.1.2. Conservation Banks
11.4.3.1.3. Forest Conservation
11.4.3.2. Spain Mitigation
Banking Market Revenue (US$ Mn) and
Forecasts, By Verticals
11.4.3.2.1. Construction and Mining
11.4.3.2.2. Energy and Utilities
11.4.3.2.3. Manufacturing
11.4.3.2.4. Healthcare
11.4.3.2.5. Transportation
11.4.3.2.6. Others
11.4.4. Germany
11.4.4.1. Germany Mitigation
Banking Market Revenue (US$ Mn) and
Forecasts, By Type
11.4.4.1.1. Wetland or Stream Banks
11.4.4.1.2. Conservation Banks
11.4.4.1.3. Forest Conservation
11.4.4.2. Germany Mitigation
Banking Market Revenue (US$ Mn) and Forecasts,
By Verticals
11.4.4.2.1. Construction and Mining
11.4.4.2.2. Energy and Utilities
11.4.4.2.3. Manufacturing
11.4.4.2.4. Healthcare
11.4.4.2.5. Transportation
11.4.4.2.6. Others
11.4.5. Italy
11.4.5.1. Italy Mitigation
Banking Market Revenue (US$ Mn) and
Forecasts, By Type
11.4.5.1.1. Wetland or Stream Banks
11.4.5.1.2. Conservation Banks
11.4.5.1.3. Forest Conservation
11.4.5.2. Italy Mitigation
Banking Market Revenue (US$ Mn) and
Forecasts, By Verticals
11.4.5.2.1. Construction and Mining
11.4.5.2.2. Energy and Utilities
11.4.5.2.3. Manufacturing
11.4.5.2.4. Healthcare
11.4.5.2.5. Transportation
11.4.5.2.6. Others
11.4.6. Nordic Countries
11.4.6.1. Nordic Countries
Mitigation Banking Market Revenue
(US$ Mn) and Forecasts, By Type
11.4.6.1.1. Wetland or Stream Banks
11.4.6.1.2. Conservation Banks
11.4.6.1.3. Forest Conservation
11.4.6.2. Nordic Countries
Mitigation Banking Market Revenue
(US$ Mn) and Forecasts, By Verticals
11.4.6.2.1. Construction and Mining
11.4.6.2.2. Energy and Utilities
11.4.6.2.3. Manufacturing
11.4.6.2.4. Healthcare
11.4.6.2.5. Transportation
11.4.6.2.6. Others
11.4.6.3. Nordic Countries
Mitigation Banking Market Revenue
(US$ Mn) and Forecasts, By Country
11.4.6.3.1. Denmark
11.4.6.3.2. Finland
11.4.6.3.3. Iceland
11.4.6.3.4. Sweden
11.4.6.3.5. Norway
11.4.7. Benelux Union
11.4.7.1. Benelux Union
Mitigation Banking Market Revenue
(US$ Mn) and Forecasts, By Type
11.4.7.1.1. Wetland or Stream Banks
11.4.7.1.2. Conservation Banks
11.4.7.1.3. Forest Conservation
11.4.7.2. Benelux Union
Mitigation Banking Market Revenue
(US$ Mn) and Forecasts, By Verticals
11.4.7.2.1. Construction and Mining
11.4.7.2.2. Energy and Utilities
11.4.7.2.3. Manufacturing
11.4.7.2.4. Healthcare
11.4.7.2.5. Transportation
11.4.7.2.6. Others
11.4.7.3. Benelux Union Mitigation
Banking Market Revenue (US$ Mn) and
Forecasts, By Country
11.4.7.3.1. Belgium
11.4.7.3.2. The Netherlands
11.4.7.3.3. Luxembourg
11.4.8. Rest of Europe
11.4.8.1. Rest of Europe
Mitigation Banking Market Revenue
(US$ Mn) and Forecasts, By Type
11.4.8.1.1. Wetland or Stream Banks
11.4.8.1.2. Conservation Banks
11.4.8.1.3. Forest Conservation
11.4.8.2. Rest of Europe
Mitigation Banking Market Revenue
(US$ Mn) and Forecasts, By Verticals
11.4.8.2.1. Construction and Mining
11.4.8.2.2. Energy and Utilities
11.4.8.2.3. Manufacturing
11.4.8.2.4. Healthcare
11.4.8.2.5. Transportation
11.4.8.2.6. Others
11.5. Key Segment for Channeling Investments
11.5.1. By Country
11.5.2. By Type
11.5.3. By Verticals
12.
Asia Pacific Mitigation Banking Market Analysis and Forecasts, 2019 - 2027
12.1. Overview
12.1.1. Asia Pacific Mitigation
Banking Market Revenue (US$ Mn)
12.2. Asia Pacific Mitigation
Banking Market Revenue (US$ Mn) and
Forecasts, By Type
12.2.1. Wetland or Stream Banks
12.2.2. Conservation Banks
12.2.3. Forest Conservation
12.3. Asia Pacific Mitigation
Banking Market Revenue (US$ Mn) and
Forecasts, By Verticals
12.3.1. Construction and Mining
12.3.2. Energy and Utilities
12.3.3. Manufacturing
12.3.4. Healthcare
12.3.5. Transportation
12.3.6. Others
12.4. Asia Pacific Mitigation
Banking Market Revenue (US$ Mn) and
Forecasts, By Country
12.4.1. China
12.4.1.1. China Mitigation
Banking Market Revenue (US$ Mn) and
Forecasts, By Type
12.4.1.1.1. Wetland or Stream Banks
12.4.1.1.2. Conservation Banks
12.4.1.1.3. Forest Conservation
12.4.1.2. China Mitigation
Banking Market Revenue (US$ Mn) and
Forecasts, By Verticals
12.4.1.2.1. Construction and Mining
12.4.1.2.2. Energy and Utilities
12.4.1.2.3. Manufacturing
12.4.1.2.4. Healthcare
12.4.1.2.5. Transportation
12.4.1.2.6. Others
12.4.2. Japan
12.4.2.1. Japan Mitigation
Banking Market Revenue (US$ Mn) and
Forecasts, By Type
12.4.2.1.1. Wetland or Stream Banks
12.4.2.1.2. Conservation Banks
12.4.2.1.3. Forest Conservation
12.4.2.2. Japan Mitigation
Banking Market Revenue (US$ Mn) and
Forecasts, By Verticals
12.4.2.2.1. Construction and Mining
12.4.2.2.2. Energy and Utilities
12.4.2.2.3. Manufacturing
12.4.2.2.4. Healthcare
12.4.2.2.5. Transportation
12.4.2.2.6. Others
12.4.3. India
12.4.3.1. India Mitigation
Banking Market Revenue (US$ Mn) and
Forecasts, By Type
12.4.3.1.1. Wetland or Stream Banks
12.4.3.1.2. Conservation Banks
12.4.3.1.3. Forest Conservation
12.4.3.2. India Mitigation
Banking Market Revenue (US$ Mn) and
Forecasts, By Verticals
12.4.3.2.1. Construction and Mining
12.4.3.2.2. Energy and Utilities
12.4.3.2.3. Manufacturing
12.4.3.2.4. Healthcare
12.4.3.2.5. Transportation
12.4.3.2.6. Others
12.4.4. New Zealand
12.4.4.1. New Zealand Mitigation
Banking Market Revenue (US$ Mn) and
Forecasts, By Type
12.4.4.1.1. Wetland or Stream Banks
12.4.4.1.2. Conservation Banks
12.4.4.1.3. Forest Conservation
12.4.4.2. New Zealand Mitigation
Banking Market Revenue (US$ Mn) and
Forecasts, By Verticals
12.4.4.2.1. Construction and Mining
12.4.4.2.2. Energy and Utilities
12.4.4.2.3. Manufacturing
12.4.4.2.4. Healthcare
12.4.4.2.5. Transportation
12.4.4.2.6. Others
12.4.5. Australia
12.4.5.1. Australia Mitigation
Banking Market Revenue (US$ Mn) and
Forecasts, By Type
12.4.5.1.1. Wetland or Stream Banks
12.4.5.1.2. Conservation Banks
12.4.5.1.3. Forest Conservation
12.4.5.2. Australia Mitigation
Banking Market Revenue (US$ Mn) and
Forecasts, By Verticals
12.4.5.2.1. Construction and Mining
12.4.5.2.2. Energy and Utilities
12.4.5.2.3. Manufacturing
12.4.5.2.4. Healthcare
12.4.5.2.5. Transportation
12.4.5.2.6. Others
12.4.6. South Korea
12.4.6.1. South Korea Mitigation
Banking Market Revenue (US$ Mn) and
Forecasts, By Type
12.4.6.1.1. Wetland or Stream Banks
12.4.6.1.2. Conservation Banks
12.4.6.1.3. Forest Conservation
12.4.6.2. South Korea Mitigation
Banking Market Revenue (US$ Mn) and
Forecasts, By Verticals
12.4.6.2.1. Construction and Mining
12.4.6.2.2. Energy and Utilities
12.4.6.2.3. Manufacturing
12.4.6.2.4. Healthcare
12.4.6.2.5. Transportation
12.4.6.2.6. Others
12.4.7. Southeast Asia
12.4.7.1. Southeast Asia
Mitigation Banking Market Revenue
(US$ Mn) and Forecasts, By Type
12.4.7.1.1. Wetland or Stream Banks
12.4.7.1.2. Conservation Banks
12.4.7.1.3. Forest Conservation
12.4.7.2. Southeast Asia
Mitigation Banking Market Revenue
(US$ Mn) and Forecasts, By Verticals
12.4.7.2.1. Construction and Mining
12.4.7.2.2. Energy and Utilities
12.4.7.2.3. Manufacturing
12.4.7.2.4. Healthcare
12.4.7.2.5. Transportation
12.4.7.2.6. Others
12.4.7.3. Southeast Asia
Mitigation Banking Market Revenue
(US$ Mn) and Forecasts, By Country
12.4.7.3.1. Indonesia
12.4.7.3.2. Thailand
12.4.7.3.3. Malaysia
12.4.7.3.4. Singapore
12.4.7.3.5. Rest of Southeast Asia
12.4.8. Rest of Asia Pacific
12.4.8.1. Rest of Asia Pacific
Mitigation Banking Market Revenue
(US$ Mn) and Forecasts, By Type
12.4.8.1.1. Wetland or Stream Banks
12.4.8.1.2. Conservation Banks
12.4.8.1.3. Forest Conservation
12.4.8.2. Rest of Asia Pacific
Mitigation Banking Market Revenue
(US$ Mn) and Forecasts, By Verticals
12.4.8.2.1. Construction and Mining
12.4.8.2.2. Energy and Utilities
12.4.8.2.3. Manufacturing
12.4.8.2.4. Healthcare
12.4.8.2.5. Transportation
12.4.8.2.6. Others
12.5. Key Segment for Channeling Investments
12.5.1. By Country
12.5.2. By Type
12.5.3. By Verticals
13.
Middle East and Africa Mitigation Banking Market Analysis and Forecasts, 2019 - 2027
13.1. Overview
13.1.1. Middle East and Africa
Mitigation Banking Market Revenue
(US$ Mn)
13.2. Middle East and Africa
Mitigation Banking Market Revenue
(US$ Mn) and Forecasts, By Type
13.2.1. Wetland or Stream Banks
13.2.2. Conservation Banks
13.2.3. Forest Conservation
13.3. Middle East and Africa
Mitigation Banking Market Revenue
(US$ Mn) and Forecasts, By Verticals
13.3.1. Construction and Mining
13.3.2. Energy and Utilities
13.3.3. Manufacturing
13.3.4. Healthcare
13.3.5. Transportation
13.3.6. Others
13.4. Middle East and Africa
Mitigation Banking Market Revenue
(US$ Mn) and Forecasts, By Country
13.4.1. Saudi Arabia
13.4.1.1. Saudi Arabia Mitigation
Banking Market Revenue (US$ Mn) and
Forecasts, By Type
13.4.1.1.1. Wetland or Stream Banks
13.4.1.1.2. Conservation Banks
13.4.1.1.3. Forest Conservation
13.4.1.2. Saudi Arabia Mitigation
Banking Market Revenue (US$ Mn) and
Forecasts, By Verticals
13.4.1.2.1. Construction and Mining
13.4.1.2.2. Energy and Utilities
13.4.1.2.3. Manufacturing
13.4.1.2.4. Healthcare
13.4.1.2.5. Transportation
13.4.1.2.6. Others
13.4.2. UAE
13.4.2.1. UAE Mitigation
Banking Market Revenue (US$ Mn) and
Forecasts, By Type
13.4.2.1.1. Wetland or Stream Banks
13.4.2.1.2. Conservation Banks
13.4.2.1.3. Forest Conservation
13.4.2.2. UAE Mitigation
Banking Market Revenue (US$ Mn) and
Forecasts, By Verticals
13.4.2.2.1. Construction and Mining
13.4.2.2.2. Energy and Utilities
13.4.2.2.3. Manufacturing
13.4.2.2.4. Healthcare
13.4.2.2.5. Transportation
13.4.2.2.6. Others
13.4.3. Egypt
13.4.3.1. Egypt Mitigation
Banking Market Revenue (US$ Mn) and
Forecasts, By Type
13.4.3.1.1. Wetland or Stream Banks
13.4.3.1.2. Conservation Banks
13.4.3.1.3. Forest Conservation
13.4.3.2. Egypt Mitigation
Banking Market Revenue (US$ Mn) and
Forecasts, By Verticals
13.4.3.2.1. Construction and Mining
13.4.3.2.2. Energy and Utilities
13.4.3.2.3. Manufacturing
13.4.3.2.4. Healthcare
13.4.3.2.5. Transportation
13.4.3.2.6. Others
13.4.4. Kuwait
13.4.4.1. Kuwait Mitigation
Banking Market Revenue (US$ Mn) and
Forecasts, By Type
13.4.4.1.1. Wetland or Stream Banks
13.4.4.1.2. Conservation Banks
13.4.4.1.3. Forest Conservation
13.4.4.2. Kuwait Mitigation
Banking Market Revenue (US$ Mn) and
Forecasts, By Verticals
13.4.4.2.1. Construction and Mining
13.4.4.2.2. Energy and Utilities
13.4.4.2.3. Manufacturing
13.4.4.2.4. Healthcare
13.4.4.2.5. Transportation
13.4.4.2.6. Others
13.4.5. South Africa
13.4.5.1. South Africa Mitigation
Banking Market Revenue (US$ Mn) and
Forecasts, By Type
13.4.5.1.1. Wetland or Stream Banks
13.4.5.1.2. Conservation Banks
13.4.5.1.3. Forest Conservation
13.4.5.2. South Africa Mitigation
Banking Market Revenue (US$ Mn) and
Forecasts, By Verticals
13.4.5.2.1. Construction and Mining
13.4.5.2.2. Energy and Utilities
13.4.5.2.3. Manufacturing
13.4.5.2.4. Healthcare
13.4.5.2.5. Transportation
13.4.5.2.6. Others
13.4.6. Rest of Middle East & Africa
13.4.6.1. Rest of Middle East & Africa Mitigation Banking Market Revenue (US$ Mn) and Forecasts, By
Type
13.4.6.1.1. Wetland or Stream Banks
13.4.6.1.2. Conservation Banks
13.4.6.1.3. Forest Conservation
13.4.6.2. Rest of Middle East & Africa Mitigation Banking Market Revenue (US$ Mn) and Forecasts, By
Verticals
13.4.6.2.1. Construction and Mining
13.4.6.2.2. Energy and Utilities
13.4.6.2.3. Manufacturing
13.4.6.2.4. Healthcare
13.4.6.2.5. Transportation
13.4.6.2.6. Others
13.5. Key Segment for Channeling Investments
13.5.1. By Country
13.5.2. By Type
13.5.3. By Verticals
14.
Latin America Mitigation Banking Market Analysis and Forecasts, 2019 - 2027
14.1. Overview
14.1.1. Latin America
Mitigation Banking Market Revenue
(US$ Mn)
14.2. Latin America
Mitigation Banking Market Revenue
(US$ Mn) and Forecasts, By Type
14.2.1. Wetland or Stream Banks
14.2.2. Conservation Banks
14.2.3. Forest Conservation
14.3. Latin America
Mitigation Banking Market Revenue
(US$ Mn) and Forecasts, By Verticals
14.3.1. Construction and Mining
14.3.2. Energy and Utilities
14.3.3. Manufacturing
14.3.4. Healthcare
14.3.5. Transportation
14.3.6. Others
14.4. Latin America
Mitigation Banking Market Revenue
(US$ Mn) and Forecasts, By Country
14.4.1. Brazil
14.4.1.1. Brazil Mitigation
Banking Market Revenue (US$ Mn) and
Forecasts, By Type
14.4.1.1.1. Wetland or Stream Banks
14.4.1.1.2. Conservation Banks
14.4.1.1.3. Forest Conservation
14.4.1.2. Brazil Mitigation
Banking Market Revenue (US$ Mn) and
Forecasts, By Verticals
14.4.1.2.1. Construction and Mining
14.4.1.2.2. Energy and Utilities
14.4.1.2.3. Manufacturing
14.4.1.2.4. Healthcare
14.4.1.2.5. Transportation
14.4.1.2.6. Others
14.4.2. Argentina
14.4.2.1. Argentina Mitigation
Banking Market Revenue (US$ Mn) and
Forecasts, By Type
14.4.2.1.1. Wetland or Stream Banks
14.4.2.1.2. Conservation Banks
14.4.2.1.3. Forest Conservation
14.4.2.2. Argentina Mitigation Banking Market Revenue (US$ Mn) and Forecasts, By
Verticals
14.4.2.2.1. Construction and Mining
14.4.2.2.2. Energy and Utilities
14.4.2.2.3. Manufacturing
14.4.2.2.4. Healthcare
14.4.2.2.5. Transportation
14.4.2.2.6. Others
14.4.3. Rest of Latin America
14.4.3.1. Rest of Latin America
Mitigation Banking Market Revenue
(US$ Mn) and Forecasts, By Type
14.4.3.1.1. Wetland or Stream Banks
14.4.3.1.2. Conservation Banks
14.4.3.1.3. Forest Conservation
14.4.3.2. Rest of Latin America
Mitigation Banking Market Revenue
(US$ Mn) and Forecasts, By Verticals
14.4.3.2.1. Construction and Mining
14.4.3.2.2. Energy and Utilities
14.4.3.2.3. Manufacturing
14.4.3.2.4. Healthcare
14.4.3.2.5. Transportation
14.4.3.2.6. Others
14.5. Key Segment for Channeling Investments
14.5.1. By Country
14.5.2. By Type
14.5.3. By Verticals
15.
Competitive Benchmarking
15.1. Brand Benchmarking
15.2. Market Share Analysis, 2018
15.3. Global Presence and Growth Strategies
15.3.1. Mergers and Acquisitions
15.3.2. Product Launches
15.3.3. Investments Trends
15.3.4. R&D Initiatives
16.
Player Profiles
16.1. Alafia River Wetland Mitigation Bank, Inc.
16.1.1. Company Details
16.1.2. Company Overview
16.1.3. Product Offerings
16.1.4. Key Developments
16.1.5. Financial Analysis
16.1.6. SWOT Analysis
16.1.7. Business Strategies
16.2. Burns & McDonnell
16.2.1. Company Details
16.2.2. Company Overview
16.2.3. Product Offerings
16.2.4. Key Developments
16.2.5. Financial Analysis
16.2.6. SWOT Analysis
16.2.7. Business Strategies
16.3. EarthBalance
16.3.1. Company Details
16.3.2. Company Overview
16.3.3. Product Offerings
16.3.4. Key Developments
16.3.5. Financial Analysis
16.3.6. SWOT Analysis
16.3.7. Business Strategies
16.4. Ecosystem Investment Partners
16.4.1. Company Details
16.4.2. Company Overview
16.4.3. Product Offerings
16.4.4. Key Developments
16.4.5. Financial Analysis
16.4.6. SWOT Analysis
16.4.7. Business Strategies
16.5. Ecosystem Services, LLC
16.5.1. Company Details
16.5.2. Company Overview
16.5.3. Product Offerings
16.5.4. Key Developments
16.5.5. Financial Analysis
16.5.6. SWOT Analysis
16.5.7. Business Strategies
16.6. Great Ecology
16.6.1. Company Details
16.6.2. Company Overview
16.6.3. Product Offerings
16.6.4. Key Developments
16.6.5. Financial Analysis
16.6.6. SWOT Analysis
16.6.7. Business Strategies
16.7. Habitat Bank LLC
16.7.1. Company Details
16.7.2. Company Overview
16.7.3. Product Offerings
16.7.4. Key Developments
16.7.5. Financial Analysis
16.7.6. SWOT Analysis
16.7.7. Business Strategies
16.8. LJA Environmental Services, Inc.
16.8.1. Company Details
16.8.2. Company Overview
16.8.3. Product Offerings
16.8.4. Key Developments
16.8.5. Financial Analysis
16.8.6. SWOT Analysis
16.8.7. Business Strategies
16.9. Mitigation Credit Services, LLC
16.9.1. Company Details
16.9.2. Company Overview
16.9.3. Product Offerings
16.9.4. Key Developments
16.9.5. Financial Analysis
16.9.6. SWOT Analysis
16.9.7. Business Strategies
16.10. The
Loudermilk Companies, LLC
16.10.1. Company
Details
16.10.2. Company
Overview
16.10.3. Product
Offerings
16.10.4. Key
Developments
16.10.5. Financial
Analysis
16.10.6. SWOT
Analysis
16.10.7. Business
Strategies
16.11. The
Mitigation Banking Group, Inc
16.11.1. Company
Details
16.11.2. Company
Overview
16.11.3. Product
Offerings
16.11.4. Key
Developments
16.11.5. Financial
Analysis
16.11.6. SWOT
Analysis
16.11.7. Business
Strategies
16.12. The
Wetlandsbank Company
16.12.1. Company
Details
16.12.2. Company
Overview
16.12.3. Product
Offerings
16.12.4. Key
Developments
16.12.5. Financial
Analysis
16.12.6. SWOT
Analysis
16.12.7. Business
Strategies
16.13. Wetland
Studies and Solutions, Inc.
16.13.1. Company
Details
16.13.2. Company
Overview
16.13.3. Product
Offerings
16.13.4. Key
Developments
16.13.5. Financial
Analysis
16.13.6. SWOT
Analysis
16.13.7. Business
Strategies
16.14. Weyerhaeuser
16.14.1. Company
Details
16.14.2. Company
Overview
16.14.3. Product
Offerings
16.14.4. Key
Developments
16.14.5. Financial
Analysis
16.14.6. SWOT
Analysis
16.14.7. Business
Strategies
16.15. Wildwood
Environmental Credit Company
16.15.1. Company
Details
16.15.2. Company
Overview
16.15.3. Product
Offerings
16.15.4. Key
Developments
16.15.5. Financial
Analysis
16.15.6. SWOT
Analysis
16.15.7. Business
Strategies
16.16. WRA,
Inc.
16.16.1. Company
Details
16.16.2. Company
Overview
16.16.3. Product
Offerings
16.16.4. Key
Developments
16.16.5. Financial
Analysis
16.16.6. SWOT
Analysis
16.16.7. Business
Strategies
16.17. Other
Market Participants
17.
Key Findings
At Absolute Markets Insights, we are engaged in building both global as well as country specific reports. As a result, the approach taken for deriving the estimation and forecast for a specific country is a bit unique and different in comparison to the global research studies. In this case, we not only study the concerned market factors & trends prevailing in a particular country (from secondary research) but we also tend to calculate the actual market size & forecast from the revenue generated from the market participants involved in manufacturing or distributing the any concerned product. These companies can also be service providers. For analyzing any country specifically, we do consider the growth factors prevailing under the states/cities/county for the same. For instance, if we are analyzing an industry specific to United States, we primarily need to study about the states present under the same(where the product/service has the highest growth). Similar analysis will be followed by other countries. Our scope of the report changes with different markets.
Our research study is mainly implement through a mix of both secondary and primary research. Various sources such as industry magazines, trade journals, and government websites and trade associations are reviewed for gathering precise data. Primary interviews are conducted to validate the market size derived from secondary research. Industry experts, major manufacturers and distributors are contacted for further validation purpose on the current market penetration and growth trends.
Prominent participants in our primary research process include:
- Key Opinion Leaders namely the CEOs, CSOs, VPs, purchasing managers, amongst others
- Research and development participants, distributors/suppliers and subject matter experts
Secondary Research includes data extracted from paid data sources:
- Reuters
- Factiva
- Bloomberg
- One Source
- Hoovers
Research Methodology

Key Inclusions


