
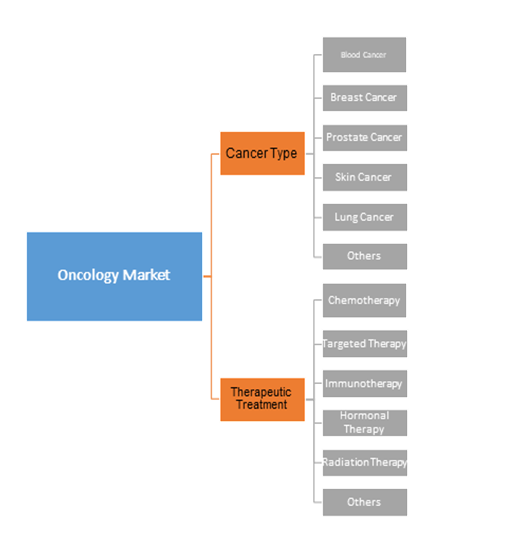
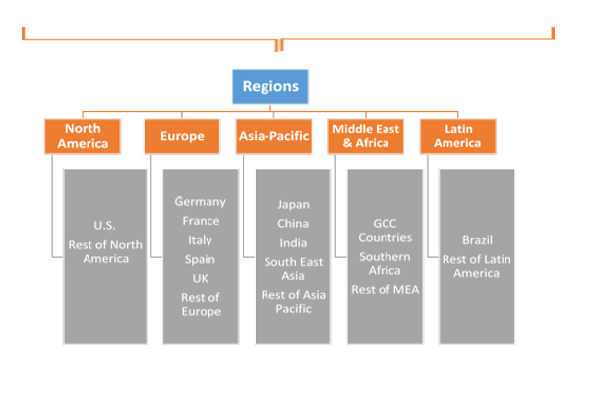
Oncology Market by Cancer Type (Blood Cancer, Breast Cancer, Prostate Cancer, Skin Cancer, Lung Cancer, Others); by Therapeutic Treatment (Chemotherapy, Targeted Therapy, Immunotherapy, Hormonal Therapy, Radiation Therapy, Others); by Regional Outlook (U.S., Rest of North America, France, UK, Germany, Spain, Italy, Rest of Europe, China, Japan, India, Southeast Asia, Rest of Asia Pacific, GCC Countries, Southern Africa, Rest of MEA, Brazil, Rest of Latin America) – Global Insights, Industry Trends, Price Trends, Growth, Size, Supply, Demand, Comparative Analysis, Competitive Market Share and Forecast, 2018-2026
Industry Trends
Oncology is a study of Cancer. The illness is described by irregular cell multiplication, which is trailed by local tissue invasion. At an advanced stage of the disease, the cancer cells migrate to different parts of the body. Cancer is a hereditarily determined illness, with iterative transformations giving selective advantages to the cells with regards to the particular tissue site, trailed by clonal expansion. The oncology market, in terms of revenue, was valued at USD 93.60 Bn in 2016 and is expected to reach US$ 127.52 Bn by 2021.
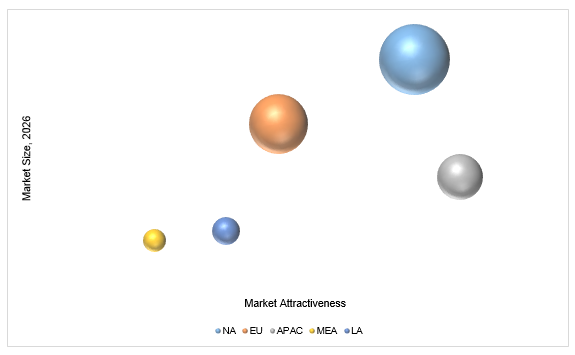
Global Oncology Market (USD Billion), By Region, 2018 - 2026
Cancer is foreseen to become increasingly prevalent because of aging population and rising levels of obesity in the developed world. Besides, the advancement and approval of more targeted oncology treatments are foreseen to decrease toxicity and increase chemotherapy use in elderly patients. Targeted treatment organization will upturn the overall survival.
In 2012, there were 32.6 million individuals living with cancer within five years of diagnosis. These are generally incurable once they advance to the phase where they are unresectable. Chemotherapy compounds are a mainstay treatment for cancers of numerous kinds, at different illness stages. In a typical course of treatment for cancer, numerous chemotherapy compounds are regulated consecutively in combination regimens, as an adjunct to surgery and radiation treatment. Chemotherapy drugs are cytotoxic to partitioning cells, implying that they follow up on both healthy and malignant tissues and are fairly lethal.
Various common etiologic variables have been emphatically portrayed as raising the risk of developing cancer, including age, interminable irritation, gender, obesity, tobacco usage and heritable cancer syndromes. The risk of cancer increases exceedingly in patients beyond 65 years old. Populations in developed countries are anticipated to become progressively aged and demonstrate rising obesity incidence, which will drive both cancer predominance and revenue growth for its treatments.
Oncology Market, By Cancer Type
On the basis of cancer type, the global market is segmented into blood cancer, breast cancer, prostate cancer, skin cancer, and lung cancer among others. Among these, blood cancer segment represented a major share of the global oncology market in 2016 and is anticipated to hold the largest share of the overall market throughout the forecast period. The development of blood cancer segment is significant because of the high cost of the medications used to treat blood cancer. The prevalence of blood cancer is less in well-established countries, and also diagnosis rate is over 90%. This results in most of the individuals diagnosed striving for complete treatment to cure it. Because of the high disposable incomes of customers in developed nations, costly medication treatment of blood cancer is affordable in these regions.
Oncology Market, By Region
North America dominates the market for cancer drugs as the region houses organizations occupied with the advancement in cancer drugs. Correspondingly, the disposable revenues of consumers and health insurance cover for severe sickness in North America are high, which expands the affordability of tumor treatment. Furthermore, US Food and Drug Administration (USFDA) has undertaken activities to support the development of the market by giving a pre-market approval to the medications, which are in the clinical stage; in this way, accelerating the clinical development.
Countless patents in North America demonstrate a substantial investment in R&D from multinational organizations and also research organizations. Europe is the second largest revenue generating region for the oncology market and is relied upon to develop at a CAGR of 7.9% amid the forecast time frame. In U.S. and Europe, a majority of the multinational players has focused on the development of biologics or immunotherapeutic inferable from its high adequacy and target particular action. The research for cancer drugs in Asia-Pacific and LAMEA is rising with the concentration towards the improvement of biosimilars. The predominance of high growth in developing nations, renders these districts as promising areas to direct clinical trials. In addition, the cost of clinical research is low in these region, because of the availability of an enormous population base and good government arrangements adding to the oncology/malignancy drugs showcase development in the developing nations.
Competitive Landscape
The report provides both, qualitative and quantitative research of the market. The report also offers extensive research and detailed insight on the competitiveness of the key players in this market. The key business strategies such as M&A, affiliations, collaborations, and contracts adopted by the major players are also recognized and analyzed in the report. For each company, the report recognizes their manufacturing base, competitors, product type, application and specification, pricing, and gross margin. Some of the primary players of global oncology market are Roche, Novartis, Celgene, Bristol Myers Squibb, Johnson & Johnson, Pfizer, Eli Lilly, AstraZeneca, AbbVie, Incyte, Eisai, Sanofi and Merck & Co. among others.

Oncology Industry Background
1. Introduction
1.1. Market Scope
1.2. Market Segmentation
1.3. Methodology
1.4. Assumptions
2. Oncology Market Snapshot
3. Executive Summary: Oncology Market
4. Qualitative Analysis: Oncology Market
4.1. Introduction
4.1.1. Product Definition
4.1.2. Industry Development
4.2. Market Dynamics
4.2.1. Drivers
4.2.2. Restraints
4.2.3. Opportunities
4.3. Trends in Market
5. Global Oncology Market Analysis and Forecasts, 2018 – 2026
5.1. Overview
5.1.1. Global Market Revenue (US$ Mn) and Forecasts
5.2. Global Oncology Market Revenue (US$ Mn) and Forecasts, By
Therapeutic Treatment
5.2.1. Chemotherapy
5.2.1.1. Definition
5.2.1.2. Market Penetration
5.2.1.3. Market Revenue Expected to Increase by 2026
5.2.1.4. Compound Annual Growth Rate (CAGR)
5.2.2. Targeted therapy
5.2.2.1. Definition
5.2.2.2. Market Penetration
5.2.2.3. Market Revenue Expected to Increase by 2026
5.2.2.4. Compound Annual Growth Rate (CAGR)
5.2.3. Immunotherapy
5.2.3.1. Definition
5.2.3.2. Market Penetration
5.2.3.3. Market Revenue Expected to Increase by 2026
5.2.3.4. Compound Annual Growth Rate (CAGR)
5.2.4. Hormonal therapy
5.2.4.1. Definition
5.2.4.2. Market Penetration
5.2.4.3. Market Revenue Expected to Increase by 2026
5.2.4.4. Compound Annual Growth Rate (CAGR)
5.2.5. Radiation therapy
5.2.5.1. Definition
5.2.5.2. Market Penetration
5.2.5.3. Market Revenue Expected to Increase by 2026
5.2.5.4. Compound Annual Growth Rate (CAGR)
5.2.6. Others
5.2.6.1. Definition
5.2.6.2. Market Penetration
5.2.6.3. Market Revenue Expected to Increase by 2026
5.2.6.4. Compound Annual Growth Rate (CAGR)
5.3. Key Segment for Channeling Investments
5.3.1. By Therapeutic Treatment
6. Global Oncology Market Analysis and Forecasts, 2018 – 2026
6.1. Overview
6.2. Global Oncology Market Revenue (US$ Mn) and Forecasts, By
Cancer Types
6.2.1. Blood cancer
6.2.1.1. Definition
6.2.1.2. Market Penetration
6.2.1.3. Market Revenue Expected to Increase by 2026
6.2.1.4. Compound Annual Growth Rate (CAGR)
6.2.2. Breast cancer
6.2.2.1. Definition
6.2.2.2. Market Penetration
6.2.2.3. Market Revenue Expected to Increase by 2026
6.2.2.4. Compound Annual Growth Rate (CAGR)
6.2.3. Prostate cancer
6.2.3.1. Definition
6.2.3.2. Market Penetration
6.2.3.3. Market Revenue Expected to Increase by 2026
6.2.3.4. Compound Annual Growth Rate (CAGR)
6.2.4. Skin cancer
6.2.4.1. Definition
6.2.4.2. Market Penetration
6.2.4.3. Market Revenue Expected to Increase by 2026
6.2.4.4. Compound Annual Growth Rate (CAGR)
6.2.5. Lung cancer
6.2.5.1. Definition
6.2.5.2. Market Penetration
6.2.5.3. Market Revenue Expected to Increase by 2026
6.2.5.4. Compound Annual Growth Rate (CAGR)
6.2.6. Other cancers
6.2.6.1. Definition
6.2.6.2. Market Penetration
6.2.6.3. Market Revenue Expected to Increase by 2026
6.2.6.4. Compound Annual Growth Rate (CAGR)
6.3. Key Segment for Channeling Investments
6.3.1. By Cancer Types
7. North America Oncology Market Analysis and Forecasts, 2018 –
2026
7.1. Overview
7.1.1. North America Market Revenue (US$ Mn)
7.2. North America Oncology Market Revenue (US$ Mn) and Forecasts,
By Therapeutic Treatment
7.2.1. Chemotherapy
7.2.2. Targeted therapy
7.2.3. Immunotherapy
7.2.4. Hormonal therapy
7.2.5. Radiation therapy
7.2.6. Others
7.3. North America Oncology Market Revenue (US$ Mn) and Forecasts,
By Cancer Types
7.3.1. Blood cancer
7.3.2. Breast cancer
7.3.3. Prostate cancer
7.3.4. Skin cancer
7.3.5. Lung cancer
7.3.6. Other cancers
7.4. North America Oncology Market Revenue (US$ Mn) and Forecasts,
By Country
7.4.1. U.S.
7.4.1.1. U.S. Oncology Market Revenue (US$ Mn) and Forecasts, By
Therapeutic Treatment
7.4.1.1.1. Chemotherapy
7.4.1.1.2. Targeted therapy
7.4.1.1.3. Immunotherapy
7.4.1.1.4. Hormonal therapy
7.4.1.1.5. Radiation therapy
7.4.1.1.6. Others
7.4.1.2. U.S. Oncology Market Revenue (US$ Mn) and Forecasts, By Cancer
Types
7.4.1.2.1. Blood cancer
7.4.1.2.2. Breast cancer
7.4.1.2.3. Prostate cancer
7.4.1.2.4. Skin cancer
7.4.1.2.5. Lung cancer
7.4.1.2.6. Other cancers
7.4.2. Rest of North America
7.4.2.1. Rest of North America Oncology Market Revenue (US$ Mn) and
Forecasts, By Therapeutic Treatment
7.4.2.1.1. Chemotherapy
7.4.2.1.2. Targeted therapy
7.4.2.1.3. Immunotherapy
7.4.2.1.4. Hormonal therapy
7.4.2.1.5. Radiation therapy
7.4.2.1.6. Others
7.4.2.2. Rest of North America Oncology Market Revenue (US$ Mn) and
Forecasts, By Cancer Types
7.4.2.2.1. Blood cancer
7.4.2.2.2. Breast cancer
7.4.2.2.3. Prostate cancer
7.4.2.2.4. Skin cancer
7.4.2.2.5. Lung cancer
7.4.2.2.6. Other cancers
7.5. Key Segment for Channeling Investments
7.5.1. By Country
7.5.2. By Therapeutic Treatment
7.5.3. By Cancer Types
8. Europe Oncology Market Analysis and Forecasts, 2018 – 2026
8.1. Overview
8.1.1. Europe Market Revenue (US$ Mn)
8.2. Europe Oncology Market Revenue (US$ Mn) and Forecasts, By
Therapeutic Treatment
8.2.1. Chemotherapy
8.2.2. Targeted therapy
8.2.3. Immunotherapy
8.2.4. Hormonal therapy
8.2.5. Radiation therapy
8.2.6. Others
8.3. Europe Oncology Market Revenue (US$ Mn) and Forecasts, By
Cancer Types
8.3.1. Blood cancer
8.3.2. Breast cancer
8.3.3. Prostate cancer
8.3.4. Skin cancer
8.3.5. Lung cancer
8.3.6. Other cancers
8.4. Europe Oncology Market Revenue (US$ Mn) and Forecasts, By
Country
8.4.1. France
8.4.1.1. France Oncology Market Revenue (US$ Mn) and Forecasts, By
Therapeutic Treatment
8.4.1.1.1. Chemotherapy
8.4.1.1.2. Targeted therapy
8.4.1.1.3. Immunotherapy
8.4.1.1.4. Hormonal therapy
8.4.1.1.5. Radiation therapy
8.4.1.1.6. Others
8.4.1.2. France Oncology Market Revenue (US$ Mn) and Forecasts, By
Cancer Types
8.4.1.2.1. Blood cancer
8.4.1.2.2. Breast cancer
8.4.1.2.3. Prostate cancer
8.4.1.2.4. Skin cancer
8.4.1.2.5. Lung cancer
8.4.1.2.6. Other cancers
8.4.2. The UK
8.4.2.1. The UK Oncology Market Revenue (US$ Mn) and Forecasts, By
Therapeutic Treatment
8.4.2.1.1. Chemotherapy
8.4.2.1.2. Targeted therapy
8.4.2.1.3. Immunotherapy
8.4.2.1.4. Hormonal therapy
8.4.2.1.5. Radiation therapy
8.4.2.1.6. Others
8.4.2.2. The UK Oncology Market Revenue (US$ Mn) and Forecasts, By Cancer
Types
8.4.2.2.1. Blood cancer
8.4.2.2.2. Breast cancer
8.4.2.2.3. Prostate cancer
8.4.2.2.4. Skin cancer
8.4.2.2.5. Lung cancer
8.4.2.2.6. Other cancers
8.4.3. Spain
8.4.3.1. Spain Oncology Market Revenue (US$ Mn) and Forecasts, By
Therapeutic Treatment
8.4.3.1.1. Chemotherapy
8.4.3.1.2. Targeted therapy
8.4.3.1.3. Immunotherapy
8.4.3.1.4. Hormonal therapy
8.4.3.1.5. Radiation therapy
8.4.3.1.6. Others
8.4.3.2. Spain Oncology Market Revenue (US$ Mn) and Forecasts, By
Cancer Types
8.4.3.2.1. Blood cancer
8.4.3.2.2. Breast cancer
8.4.3.2.3. Prostate cancer
8.4.3.2.4. Skin cancer
8.4.3.2.5. Lung cancer
8.4.3.2.6. Other cancers
8.4.4. Germany
8.4.4.1. Germany Oncology Market Revenue (US$ Mn) and Forecasts, By
Therapeutic Treatment
8.4.4.1.1. Chemotherapy
8.4.4.1.2. Targeted therapy
8.4.4.1.3. Immunotherapy
8.4.4.1.4. Hormonal therapy
8.4.4.1.5. Radiation therapy
8.4.4.1.6. Others
8.4.4.2. Germany Oncology Market Revenue (US$ Mn) and Forecasts, By
Cancer Types
8.4.4.2.1. Blood cancer
8.4.4.2.2. Breast cancer
8.4.4.2.3. Prostate cancer
8.4.4.2.4. Skin cancer
8.4.4.2.5. Lung cancer
8.4.4.2.6. Other cancers
8.4.5. Italy
8.4.5.1. Italy Oncology Market Revenue (US$ Mn) and Forecasts, By
Therapeutic Treatment
8.4.5.1.1. Chemotherapy
8.4.5.1.2. Targeted therapy
8.4.5.1.3. Immunotherapy
8.4.5.1.4. Hormonal therapy
8.4.5.1.5. Radiation therapy
8.4.5.1.6. Others
8.4.5.2. Italy Oncology Market Revenue (US$ Mn) and Forecasts, By
Cancer Types
8.4.5.2.1. Blood cancer
8.4.5.2.2. Breast cancer
8.4.5.2.3. Prostate cancer
8.4.5.2.4. Skin cancer
8.4.5.2.5. Lung cancer
8.4.5.2.6. Other cancers
8.4.6. Rest of Europe
8.4.6.1. Rest of Europe Oncology Market Revenue (US$ Mn) and Forecasts,
By Therapeutic Treatment
8.4.6.1.1. Chemotherapy
8.4.6.1.2. Targeted therapy
8.4.6.1.3. Immunotherapy
8.4.6.1.4. Hormonal therapy
8.4.6.1.5. Radiation therapy
8.4.6.1.6. Others
8.4.6.2. Rest of Europe Oncology Market Revenue (US$ Mn) and Forecasts,
By Cancer Types
8.4.6.2.1. Blood cancer
8.4.6.2.2. Breast cancer
8.4.6.2.3. Prostate cancer
8.4.6.2.4. Skin cancer
8.4.6.2.5. Lung cancer
8.4.6.2.6. Other cancers
8.5. Key Segment for Channeling Investments
8.5.1. By Country
8.5.2. By Therapeutic Treatment
8.5.3. By Cancer Types
9. Asia Pacific Oncology
Market Analysis and Forecasts, 2018 – 2026
9.1. Overview
9.1.1. Asia Pacific Market Revenue (US$ Mn)
9.2. Asia Pacific Oncology Market Revenue (US$ Mn) and Forecasts,
By Therapeutic Treatment
9.2.1. Chemotherapy
9.2.2. Targeted therapy
9.2.3. Immunotherapy
9.2.4. Hormonal therapy
9.2.5. Radiation therapy
9.2.6. Others
9.3. Asia Pacific Oncology Market Revenue (US$ Mn) and Forecasts,
By Cancer Types
9.3.1. Blood cancer
9.3.2. Breast cancer
9.3.3. Prostate cancer
9.3.4. Skin cancer
9.3.5. Lung cancer
9.3.6. Other cancers
9.4. Asia Pacific Oncology Market Revenue (US$ Mn) and Forecasts,
By Country
9.4.1. China
9.4.1.1. China Oncology Market Revenue (US$ Mn) and Forecasts, By
Therapeutic Treatment
9.4.1.1.1. Chemotherapy
9.4.1.1.2. Targeted therapy
9.4.1.1.3. Immunotherapy
9.4.1.1.4. Hormonal therapy
9.4.1.1.5. Radiation therapy
9.4.1.1.6. Others
9.4.1.2. China Oncology Market Revenue (US$ Mn) and Forecasts, By
Cancer Types
9.4.1.2.1. Blood cancer
9.4.1.2.2. Breast cancer
9.4.1.2.3. Prostate cancer
9.4.1.2.4. Skin cancer
9.4.1.2.5. Lung cancer
9.4.1.2.6. Other cancers
9.4.2. Japan
9.4.2.1. Japan Oncology Market Revenue (US$ Mn) and Forecasts, By
Therapeutic Treatment
9.4.2.1.1. Chemotherapy
9.4.2.1.2. Targeted therapy
9.4.2.1.3. Immunotherapy
9.4.2.1.4. Hormonal therapy
9.4.2.1.5. Radiation therapy
9.4.2.1.6. Others
9.4.2.2. Japan Oncology Market Revenue (US$ Mn) and Forecasts, By
Cancer Types
9.4.2.2.1. Blood cancer
9.4.2.2.2. Breast cancer
9.4.2.2.3. Prostate cancer
9.4.2.2.4. Skin cancer
9.4.2.2.5. Lung cancer
9.4.2.2.6. Other cancers
9.4.3. India
9.4.3.1. India Oncology Market Revenue (US$ Mn) and Forecasts, By
Therapeutic Treatment
9.4.3.1.1. Chemotherapy
9.4.3.1.2. Targeted therapy
9.4.3.1.3. Immunotherapy
9.4.3.1.4. Hormonal therapy
9.4.3.1.5. Radiation therapy
9.4.3.1.6. Others
9.4.3.2. India Oncology Market Revenue (US$ Mn) and Forecasts, By
Cancer Types
9.4.3.2.1. Blood cancer
9.4.3.2.2. Breast cancer
9.4.3.2.3. Prostate cancer
9.4.3.2.4. Skin cancer
9.4.3.2.5. Lung cancer
9.4.3.2.6. Other cancers
9.4.4. Southeast Asia
9.4.4.1. Southeast Asia Oncology Market Revenue (US$ Mn) and Forecasts,
By Therapeutic Treatment
9.4.4.1.1. Chemotherapy
9.4.4.1.2. Targeted therapy
9.4.4.1.3. Immunotherapy
9.4.4.1.4. Hormonal therapy
9.4.4.1.5. Radiation therapy
9.4.4.1.6. Others
9.4.4.2. Southeast Asia Oncology Market Revenue (US$ Mn) and Forecasts,
By Cancer Types
9.4.4.2.1. Blood cancer
9.4.4.2.2. Breast cancer
9.4.4.2.3. Prostate cancer
9.4.4.2.4. Skin cancer
9.4.4.2.5. Lung cancer
9.4.4.2.6. Other cancers
9.4.5. Rest of Asia Pacific
9.4.5.1. Rest of Asia Pacific Oncology Market Revenue (US$ Mn) and
Forecasts, By Therapeutic Treatment
9.4.5.1.1. Chemotherapy
9.4.5.1.2. Targeted therapy
9.4.5.1.3. Immunotherapy
9.4.5.1.4. Hormonal therapy
9.4.5.1.5. Radiation therapy
9.4.5.1.6. Others
9.4.5.2. Rest of Asia Pacific Oncology Market Revenue (US$ Mn) and
Forecasts, By Cancer Types
9.4.5.2.1. Blood cancer
9.4.5.2.2. Breast cancer
9.4.5.2.3. Prostate cancer
9.4.5.2.4. Skin cancer
9.4.5.2.5. Lung cancer
9.4.5.2.6. Other cancers
9.5. Key Segment for Channeling Investments
9.5.1. By Country
9.5.2. By Therapeutic Treatment
9.5.3. By Cancer Types
10. Middle East and Africa
Oncology Market Analysis and Forecasts, 2018 – 2026
10.1. Overview
10.1.1. Middle East and Africa Market Revenue (US$ Mn)
10.2. Middle East and Africa Oncology Market Revenue (US$ Mn) and
Forecasts, By Therapeutic Treatment
10.2.1. Chemotherapy
10.2.2. Targeted therapy
10.2.3. Immunotherapy
10.2.4. Hormonal therapy
10.2.5. Radiation therapy
10.2.6. Others
10.3. Middle East and Africa Oncology Market Revenue (US$ Mn) and
Forecasts, By Cancer Types
10.3.1. Blood cancer
10.3.2. Breast cancer
10.3.3. Prostate cancer
10.3.4. Skin cancer
10.3.5. Lung cancer
10.3.6. Other cancers
10.4. Middle East and Africa Oncology Market Revenue (US$ Mn) and
Forecasts, By Country
10.4.1. GCC Countries
10.4.1.1. GCC Countries Oncology Market Revenue (US$ Mn) and Forecasts,
By Therapeutic Treatment
10.4.1.1.1. Chemotherapy
10.4.1.1.2. Targeted therapy
10.4.1.1.3. Immunotherapy
10.4.1.1.4. Hormonal therapy
10.4.1.1.5. Radiation therapy
10.4.1.1.6. Others
10.4.1.2. GCC Countries Oncology Market Revenue (US$ Mn) and Forecasts,
By Cancer Types
10.4.1.2.1. Blood cancer
10.4.1.2.2. Breast cancer
10.4.1.2.3. Prostate cancer
10.4.1.2.4. Skin cancer
10.4.1.2.5. Lung cancer
10.4.1.2.6. Other cancers
10.4.2. Southern Africa
10.4.2.1. Southern Africa Oncology Market Revenue (US$ Mn) and
Forecasts, By Therapeutic Treatment
10.4.2.1.1. Chemotherapy
10.4.2.1.2. Targeted therapy
10.4.2.1.3. Immunotherapy
10.4.2.1.4. Hormonal therapy
10.4.2.1.5. Radiation therapy
10.4.2.1.6. Others
10.4.2.2. Southern Africa Oncology Market Revenue (US$ Mn) and
Forecasts, By Cancer Types
10.4.2.2.1. Blood cancer
10.4.2.2.2. Breast cancer
10.4.2.2.3. Prostate cancer
10.4.2.2.4. Skin cancer
10.4.2.2.5. Lung cancer
10.4.2.2.6. Other cancers
10.4.3. Rest of MEA
10.4.3.1. Rest of MEA Oncology Market Revenue (US$ Mn) and Forecasts, By
Therapeutic Treatment
10.4.3.1.1. Chemotherapy
10.4.3.1.2. Targeted therapy
10.4.3.1.3. Immunotherapy
10.4.3.1.4. Hormonal therapy
10.4.3.1.5. Radiation therapy
10.4.3.1.6. Others
10.4.3.2. Rest of MEA Oncology Market Revenue (US$ Mn) and Forecasts, By
Cancer Types
10.4.3.2.1. Blood cancer
10.4.3.2.2. Breast cancer
10.4.3.2.3. Prostate cancer
10.4.3.2.4. Skin cancer
10.4.3.2.5. Lung cancer
10.4.3.2.6. Other cancers
10.5. Key Segment for Channeling Investments
10.5.1. By Country
10.5.2. By Therapeutic Treatment
10.5.3. By Cancer Types
11. Latin America Oncology Market Analysis and Forecasts, 2018 –
2026
11.1. Overview
11.1.1. Latin America Market Revenue (US$ Mn)
11.2. Latin America Oncology Market Revenue (US$ Mn) and Forecasts,
By Therapeutic Treatment
11.2.1. Chemotherapy
11.2.2. Targeted therapy
11.2.3. Immunotherapy
11.2.4. Hormonal therapy
11.2.5. Radiation therapy
11.2.6. Others
11.3. Latin America Oncology Market Revenue (US$ Mn) and Forecasts,
By Cancer Types
11.3.1. Blood cancer
11.3.2. Breast cancer
11.3.3. Prostate cancer
11.3.4. Skin cancer
11.3.5. Lung cancer
11.3.6. Other cancers
11.4. Latin America Oncology Market Revenue (US$ Mn) and Forecasts,
By Country
11.4.1. Brazil
11.4.1.1. Brazil Oncology Market Revenue (US$ Mn) and Forecasts, By
Therapeutic Treatment
11.4.1.1.1. Chemotherapy
11.4.1.1.2. Targeted therapy
11.4.1.1.3. Immunotherapy
11.4.1.1.4. Hormonal therapy
11.4.1.1.5. Radiation therapy
11.4.1.1.6. Others
11.4.1.2. Brazil Oncology Market Revenue (US$ Mn) and Forecasts, By
Cancer Types
11.4.1.2.1. Blood cancer
11.4.1.2.2. Breast cancer
11.4.1.2.3. Prostate cancer
11.4.1.2.4. Skin cancer
11.4.1.2.5. Lung cancer
11.4.1.2.6. Other cancers
11.4.2. Rest of Latin America
11.4.2.1. Rest of Latin America Oncology Market Revenue (US$ Mn) and
Forecasts, By Therapeutic Treatment
11.4.2.1.1. Chemotherapy
11.4.2.1.2. Targeted therapy
11.4.2.1.3. Immunotherapy
11.4.2.1.4. Hormonal therapy
11.4.2.1.5. Radiation therapy
11.4.2.1.6. Others
11.4.2.2. Rest of Latin America Oncology Market Revenue (US$ Mn) and Forecasts,
By Cancer Types
11.4.2.2.1. Blood cancer
11.4.2.2.2. Breast cancer
11.4.2.2.3. Prostate cancer
11.4.2.2.4. Skin cancer
11.4.2.2.5. Lung cancer
11.4.2.2.6. Other cancers
11.5. Key Segment for Channeling Investments
11.5.1. By Country
11.5.2. By Therapeutic Treatment
11.5.3. By Cancer Types
12. Competitive Benchmarking
12.1. Player Positioning Analysis
12.2. Global Presence and Growth Strategies
13. Player Profiles
13.1. AbbVie Inc.
13.1.1. Company Details
13.1.2. Company Overview
13.1.3. Product Offerings
13.1.4. Key Developments
13.1.5. Financial Analysis
13.1.6. SWOT Analysis
13.1.7. Business Strategies
13.2. AstraZeneca
13.2.1. Company Details
13.2.2. Company Overview
13.2.3. Product Offerings
13.2.4. Key Developments
13.2.5. Financial Analysis
13.2.6. SWOT Analysis
13.2.7. Business Strategies
13.3. Bristol-Myers Squibb Company
13.3.1. Company Details
13.3.2. Company Overview
13.3.3. Product Offerings
13.3.4. Key Developments
13.3.5. Financial Analysis
13.3.6. SWOT Analysis
13.3.7. Business Strategies
13.4. CELGENE CORPORATION
13.4.1. Company Details
13.4.2. Company Overview
13.4.3. Product Offerings
13.4.4. Key Developments
13.4.5. Financial Analysis
13.4.6. SWOT Analysis
13.4.7. Business Strategies
13.5. Eli Lilly and Company
13.5.1. Company Details
13.5.2. Company Overview
13.5.3. Product Offerings
13.5.4. Key Developments
13.5.5. Financial Analysis
13.5.6. SWOT Analysis
13.5.7. Business Strategies
13.6. F. Hoffmann-La Roche Ltd.
13.6.1. Company Details
13.6.2. Company Overview
13.6.3. Product Offerings
13.6.4. Key Developments
13.6.5. Financial Analysis
13.6.6. SWOT Analysis
13.6.7. Business Strategies
13.7. Johnson & Johnson Services, Inc.
13.7.1. Company Details
13.7.2. Company Overview
13.7.3. Product Offerings
13.7.4. Key Developments
13.7.5. Financial Analysis
13.7.6. SWOT Analysis
13.7.7. Business Strategies
13.8. Merck & Co., Inc.
13.8.1. Company Details
13.8.2. Company Overview
13.8.3. Product Offerings
13.8.4. Key Developments
13.8.5. Financial Analysis
13.8.6. SWOT Analysis
13.8.7. Business Strategies
13.9. Novartis AG
13.9.1. Company Details
13.9.2. Company Overview
13.9.3. Product Offerings
13.9.4. Key Developments
13.9.5. Financial Analysis
13.9.6. SWOT Analysis
13.9.7. Business Strategies
13.10. Pfizer Inc.
13.10.1. Company Details
13.10.2. Company Overview
13.10.3. Product Offerings
13.10.4. Key Developments
13.10.5. Financial Analysis
13.10.6. SWOT Analysis
13.10.7. Business Strategies
Note: This ToC is
tentative and can be changed according to the research study conducted during
the course of report completion.
At Absolute Markets Insights, we are engaged in building both global as well as country specific reports. As a result, the approach taken for deriving the estimation and forecast for a specific country is a bit unique and different in comparison to the global research studies. In this case, we not only study the concerned market factors & trends prevailing in a particular country (from secondary research) but we also tend to calculate the actual market size & forecast from the revenue generated from the market participants involved in manufacturing or distributing the any concerned product. These companies can also be service providers. For analyzing any country specifically, we do consider the growth factors prevailing under the states/cities/county for the same. For instance, if we are analyzing an industry specific to United States, we primarily need to study about the states present under the same(where the product/service has the highest growth). Similar analysis will be followed by other countries. Our scope of the report changes with different markets.
Our research study is mainly implement through a mix of both secondary and primary research. Various sources such as industry magazines, trade journals, and government websites and trade associations are reviewed for gathering precise data. Primary interviews are conducted to validate the market size derived from secondary research. Industry experts, major manufacturers and distributors are contacted for further validation purpose on the current market penetration and growth trends.
Prominent participants in our primary research process include:
- Key Opinion Leaders namely the CEOs, CSOs, VPs, purchasing managers, amongst others
- Research and development participants, distributors/suppliers and subject matter experts
Secondary Research includes data extracted from paid data sources:
- Reuters
- Factiva
- Bloomberg
- One Source
- Hoovers
Research Methodology

Key Inclusions


