
Green bond verification market By Services (Pre-Issuance Verification & Post-Issuance Verification Services, Advisory Services, Others), By Verticals (Banking, Financial Services and Insurance (BFSI), Real Estate, Energy & Utilities, Consumer Goods, Automotive, Others), By Country (U.S., Canada, Mexico, Rest of America) – North America Insights, Growth, Size, Comparative Analysis, Trends and Forecast, 2019 – 2027
Industry Trends
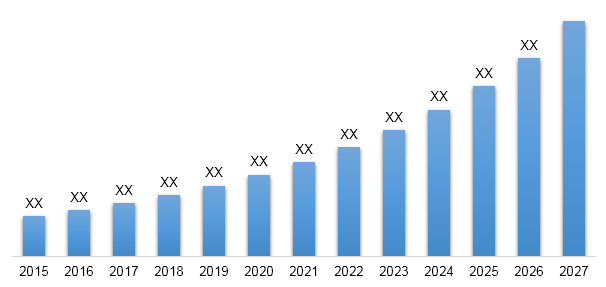
North America green bond verification market was valued at US$ 38.32 billion in 2018 and is expected to reach US$ 108.50 billion by 2027, growing at an estimated CAGR of 12.2% over the forecast period. Rampant growth of eco-friendly infrastructural projects has led to the growth of green bond verification market. Green Bonds are issued by organizations to raise funds for climate change solutions or projects. The green bond verifiers provide external review to organizations on different fronts who are looking to issue green bonds such as identifying the eligibility of assets for green bonds and giving them second party opinion. The growing need of sustainable green and clean infrastructure projects has also increased the needs of verifying agencies that help the organizations in raising funds through green bonds. According to the data of 2018, 89% of issued green bonds received at least one external review.
Repeat issuance of green bonds by the United States municipalities shows the growing Green bond verification market signs for green bond verifiers. Green bond verifiers provide end to end service to the customers’ right from pre-issuance to post-issuance of bonds. Climate change and the resulting natural disasters posed significant threats globally. Such a factor has primarily shifted the focus of the United States towards achieving a low-carbon economy.
The overall Green bond verification market in the United States has stalled owing to lack of promising regulations in the United States. The existing regulations on green bond issuance in the United States only exists in the form of nonbinding international guidelines. Such a factor is expected to critically impact the overall green bond verification market growth over the next eight years.
Green bonds are popular owing to the fact that they are often bundled together with certain tax benefits. They serve as a beneficial purpose to the socially conscious and have high investment grade ratings. Certain green bonds are coupled with tax incentive policies. Policy makers provide bond investors with tax credits rather than interest payments. This proves to be beneficial for both the bond issuers and investors creating a win-win situation for both parties.
Green bonds are gaining popularity in the United States nation. For example, MidAmerican Energy issued a total of USD 850 million of green bonds to investors to finance a portion of the Wind XI, Wind XII, and repowering projects. Apple Inc. has allocated USD 2.5 billion of green bond proceeds in less than 3 years which shows the company’s commitment towards planet. Appeal for green bond verifiers has also increased because green bonds are in demand due to its tax savings characteristics for investors.
Amongst the vertical, the energy and utility sector held the largest share in 2018 and is expected to continue the same trend over the forecast period. Utilities issued approximately $350 billion of green bonds without adversely affecting their credit ratings. This is meant to be a significant contribution towards achieving sustainability in the United States region. Various utilities have demonstrated the potential of green bonds as a powerful catalyst for finance at the scale climate solutions require.
North America Green Bond Verification Market Revenue & Forecast, (US$ Million), 2019 – 2027
Competitive Landscape
The report provides both, qualitative and quantitative research of green bond verification market, as well as provides comprehensive insights and favored development methods adopted by the key contenders. The report also offers extensive research on the key players in this market and details on the competitiveness of these players. Key business strategies such as mergers and acquisitions (M&A), affiliations, collaborations, and contracts adopted by these major market participants are also recognized and analyzed in the report. For each company, the report studies their global presence, competitors, service offerings, specification, pricing, and gross margin.
Some of the players operating in the green bond verification market are Carbon Trust, DNV GL, EY, First Environment Inc., Indufor Group, ISS Corporate Solutions Inc, Kestrel Verifiers, KPMG International Cooperative, SUSTAINANALYTICS, S & P Trucost Limited, TÜV NORD GROUP, Vigeo Eiris and other market participants.

Green Bond Verification market
- By Services
- Pre-Issuance Verification & Post-Issuance Verification Services
- Advisory Services
- Others
- By Verticals
- Banking, Financial Services and Insurance (BFSI)
- Real Estate
- Energy & Utilities
- Consumer Goods
- Automotive
- Others
- By Country
- North America
- U.S.
- Canada
- Mexico
- Rest of North America
- North America
Table of Contents
![]()
1. Market
Scope
1.1. Market
Segmentation
1.2. Years
Considered
1.2.1. Historic
Years: 2015 - 2017
1.2.2. Base
Year: 2018
1.2.3. Forecast
Years: 2019 – 2027
2. Key Target
Audiences
3. Research
Methodology
3.1. Primary
Research
3.1.1. Research
Questionnaire
3.1.2. North
America Percentage Breakdown
3.1.3. Primary
Interviews: Key Opinion Leaders (KOLs)
3.2. Secondary
Research
3.2.1. Paid
Databases
3.2.2. Secondary
Sources
3.3. Market
Size Estimates
3.3.1. Top-Down
Approach
3.3.2. Bottom-Up
Approach
3.4. Data
Triangulation Methodology
3.5. Research
Assumptions
4. Recommendations
and Insights from AMI’s Perspective**
5. Holistic
Overview of Green Bond Verification Market
6. Market
Synopsis: Green Bond Verification Market
7. Green Bond
Verification Market Analysis: Qualitative Perspective
7.1. Introduction
7.1.1. Product
Definition
7.1.2. Industry
Development
7.2. Market
Dynamics
7.2.1. Drivers
7.2.2. Restraints
7.2.3. Opportunities
7.3. Trends in
Green Bond Verification Market
7.4. Market
Determinants Radar Chart
7.5. Macro-Economic
and Micro-Economic Indicators: Green Bond Verification Market
7.6. Porter’s
Five Force Analysis
8. North
America Green Bond Verification Market Analysis and Forecasts, 2019 – 2027
8.1. Overview
8.1.1. North
America Green Bond Verification Market Revenue (US$ Mn)
8.2. North
America Green Bond Verification Market Revenue (US$ Mn) and Forecasts, By
Services
8.2.1. Pre-Issuance
Verification and Post-Issuance Verification Services
8.2.1.1. Definition
8.2.1.2. Market
Penetration, 2018
8.2.1.3. Market
Estimation, 2015 – 2018
8.2.1.4. Market
Forecast, 2019 – 2027
8.2.1.5. Compound
Annual Growth Rate (CAGR)
8.2.1.6. Regional
Bifurcation
8.2.1.6.1. U.S
8.2.1.6.1.1. Market
Estimation, 2015 – 2018
8.2.1.6.1.2. Market
Forecast, 2019 – 2027
8.2.1.6.2. Canada
8.2.1.6.2.1. Market
Estimation, 2015 – 2018
8.2.1.6.2.2. Market
Forecast, 2019 – 2027
8.2.1.6.3. Mexico
8.2.1.6.3.1. Market
Estimation, 2015 – 2018
8.2.1.6.3.2. Market
Forecast, 2019 – 2027
8.2.1.6.4. Rest
of North America
8.2.1.6.4.1. Market
Estimation, 2015 – 2018
8.2.1.6.4.2. Market
Forecast, 2019 – 2027
8.2.2. Advisory
Services
8.2.2.1. Definition
8.2.2.2. Market
Penetration, 2018
8.2.2.3. Market
Estimation, 2015 – 2018
8.2.2.4. Market
Forecast, 2019 – 2027
8.2.2.5. Compound
Annual Growth Rate (CAGR)
8.2.2.6. Regional
Bifurcation
8.2.2.6.1. U.S
8.2.2.6.1.1. Market
Estimation, 2015 – 2018
8.2.2.6.1.2. Market
Forecast, 2019 – 2027
8.2.2.6.2. Canada
8.2.2.6.2.1. Market
Estimation, 2015 – 2018
8.2.2.6.2.2. Market
Forecast, 2019 – 2027
8.2.2.6.3. Mexico
8.2.2.6.3.1. Market
Estimation, 2015 – 2018
8.2.2.6.3.2. Market
Forecast, 2019 – 2027
8.2.2.6.4. Rest
of North America
8.2.2.6.4.1. Market
Estimation, 2015 – 2018
8.2.2.6.4.2. Market
Forecast, 2019 – 2027
8.2.3. Others
8.2.3.1. Definition
8.2.3.2. Market
Penetration, 2018
8.2.3.3. Market
Estimation, 2015 – 2018
8.2.3.4. Market
Forecast, 2019 – 2027
8.2.3.5. Compound
Annual Growth Rate (CAGR)
8.2.3.6. Regional
Bifurcation
8.2.3.6.1. U.S
8.2.3.6.1.1. Market
Estimation, 2015 – 2018
8.2.3.6.1.2. Market
Forecast, 2019 – 2027
8.2.3.6.2. Canada
8.2.3.6.2.1. Market
Estimation, 2015 – 2018
8.2.3.6.2.2. Market
Forecast, 2019 – 2027
8.2.3.6.3. Mexico
8.2.3.6.3.1. Market
Estimation, 2015 – 2018
8.2.3.6.3.2. Market
Forecast, 2019 – 2027
8.2.3.6.4. Rest
of North America
8.2.3.6.4.1. Market
Estimation, 2015 – 2018
8.2.3.6.4.2. Market
Forecast, 2019 – 2027
8.3. Key
Segment for Channeling Investments
8.3.1. By
Services
9. North
America Green Bond Verification Market Analysis and Forecasts, 2019 – 2027
9.1. Overview
9.2. North
America Green Bond Verification Market Revenue (US$ Mn) and Forecasts, By
Verticals
9.2.1. Banking,
Financial Services and Insurance (BFSI) Software
9.2.1.1. Definition
9.2.1.2. Market
Penetration, 2018
9.2.1.3. Market
Estimation, 2015 – 2018
9.2.1.4. Market
Forecast, 2019 – 2027
9.2.1.5. Compound
Annual Growth Rate (CAGR)
9.2.1.6. Regional
Bifurcation
9.2.1.6.1. U.S
9.2.1.6.1.1. Market
Estimation, 2015 – 2018
9.2.1.6.1.2. Market
Forecast, 2019 – 2027
9.2.1.6.2. Canada
9.2.1.6.2.1. Market
Estimation, 2015 – 2018
9.2.1.6.2.2. Market
Forecast, 2019 – 2027
9.2.1.6.3. Mexico
9.2.1.6.3.1. Market
Estimation, 2015 – 2018
9.2.1.6.3.2. Market
Forecast, 2019 – 2027
9.2.1.6.4. Rest
of North America
9.2.1.6.4.1. Market
Estimation, 2015 – 2018
9.2.1.6.4.2. Market
Forecast, 2019 – 2027
9.2.2. Real
Estate Consulting
9.2.2.1. Definition
9.2.2.2. Market
Penetration, 2018
9.2.2.3. Market
Estimation, 2015 – 2018
9.2.2.4. Market
Forecast, 2019 – 2027
9.2.2.5. Compound
Annual Growth Rate (CAGR)
9.2.2.6. Regional
Bifurcation
9.2.2.6.1. U.S
9.2.2.6.1.1. Market
Estimation, 2015 – 2018
9.2.2.6.1.2. Market
Forecast, 2019 – 2027
9.2.2.6.2. Canada
9.2.2.6.2.1. Market
Estimation, 2015 – 2018
9.2.2.6.2.2. Market
Forecast, 2019 – 2027
9.2.2.6.3. Mexico
9.2.2.6.3.1. Market
Estimation, 2015 – 2018
9.2.2.6.3.2. Market
Forecast, 2019 – 2027
9.2.2.6.4. Rest
of North America
9.2.2.6.4.1. Market
Estimation, 2015 – 2018
9.2.2.6.4.2. Market
Forecast, 2019 – 2027
9.2.3. Energy
and Utilities
9.2.3.1. Definition
9.2.3.2. Market
Penetration, 2018
9.2.3.3. Market
Estimation, 2015 – 2018
9.2.3.4. Market
Forecast, 2019 – 2027
9.2.3.5. Compound
Annual Growth Rate (CAGR)
9.2.3.6. Regional
Bifurcation
9.2.3.6.1. U.S
9.2.3.6.1.1. Market
Estimation, 2015 – 2018
9.2.3.6.1.2. Market
Forecast, 2019 – 2027
9.2.3.6.2. Canada
9.2.3.6.2.1. Market
Estimation, 2015 – 2018
9.2.3.6.2.2. Market
Forecast, 2019 – 2027
9.2.3.6.3. Mexico
9.2.3.6.3.1. Market
Estimation, 2015 – 2018
9.2.3.6.3.2. Market
Forecast, 2019 – 2027
9.2.3.6.4. Rest
of North America
9.2.3.6.4.1. Market
Estimation, 2015 – 2018
9.2.3.6.4.2. Market
Forecast, 2019 – 2027
9.2.4. Consumer
Goods
9.2.4.1. Definition
9.2.4.2. Market
Penetration, 2018
9.2.4.3. Market
Estimation, 2015 – 2018
9.2.4.4. Market
Forecast, 2019 – 2027
9.2.4.5. Compound
Annual Growth Rate (CAGR)
9.2.4.6. Regional
Bifurcation
9.2.4.6.1. U.S
9.2.4.6.1.1. Market
Estimation, 2015 – 2018
9.2.4.6.1.2. Market
Forecast, 2019 – 2027
9.2.4.6.2. Canada
9.2.4.6.2.1. Market
Estimation, 2015 – 2018
9.2.4.6.2.2. Market
Forecast, 2019 – 2027
9.2.4.6.3. Mexico
9.2.4.6.3.1. Market
Estimation, 2015 – 2018
9.2.4.6.3.2. Market
Forecast, 2019 – 2027
9.2.4.6.4. Rest
of North America
9.2.4.6.4.1. Market
Estimation, 2015 – 2018
9.2.4.6.4.2. Market
Forecast, 2019 – 2027
9.2.5. Automotive
9.2.5.1. Definition
9.2.5.2. Market
Penetration, 2018
9.2.5.3. Market
Estimation, 2015 – 2018
9.2.5.4. Market
Forecast, 2019 – 2027
9.2.5.5. Compound
Annual Growth Rate (CAGR)
9.2.5.6. Regional
Bifurcation
9.2.5.6.1. U.S
9.2.5.6.1.1. Market
Estimation, 2015 – 2018
9.2.5.6.1.2. Market
Forecast, 2019 – 2027
9.2.5.6.2. Canada
9.2.5.6.2.1. Market
Estimation, 2015 – 2018
9.2.5.6.2.2. Market
Forecast, 2019 – 2027
9.2.5.6.3. Mexico
9.2.5.6.3.1. Market
Estimation, 2015 – 2018
9.2.5.6.3.2. Market
Forecast, 2019 – 2027
9.2.5.6.4. Rest
of North America
9.2.5.6.4.1. Market
Estimation, 2015 – 2018
9.2.5.6.4.2. Market
Forecast, 2019 – 2027
9.2.6. Others
9.2.6.1. Definition
9.2.6.2. Market
Penetration, 2018
9.2.6.3. Market
Estimation, 2015 – 2018
9.2.6.4. Market
Forecast, 2019 – 2027
9.2.6.5. Compound
Annual Growth Rate (CAGR)
9.2.6.6. Regional
Bifurcation
9.2.6.6.1. U.S
9.2.6.6.1.1. Market
Estimation, 2015 – 2018
9.2.6.6.1.2. Market
Forecast, 2019 – 2027
9.2.6.6.2. Canada
9.2.6.6.2.1. Market
Estimation, 2015 – 2018
9.2.6.6.2.2. Market
Forecast, 2019 – 2027
9.2.6.6.3. Mexico
9.2.6.6.3.1. Market
Estimation, 2015 – 2018
9.2.6.6.3.2. Market
Forecast, 2019 – 2027
9.2.6.6.4. Rest
of North America
9.2.6.6.4.1. Market
Estimation, 2015 – 2018
9.2.6.6.4.2. Market
Forecast, 2019 – 2027
9.3. Key
Segment for Channeling Investments
9.3.1. By
Verticals
10. North
America Green Bond Verification Market Analysis and Forecasts, 2019 - 2027
10.1. Overview
10.1.1. North
America Green Bond Verification Market Revenue (US$ Mn)
10.2. North
America Green Bond Verification Market Revenue (US$ Mn) and Forecasts, By
Services
10.2.1. Pre-Issuance
Verification and Post-Issuance Verification Services
10.2.2. Advisory
Services
10.2.3. Others
10.3. North
America Green Bond Verification Market Revenue (US$ Mn) and Forecasts, By
Verticals
10.3.1. Banking,
Financial Services and Insurance (BFSI) Software
10.3.2. Real
Estate Consulting
10.3.3. Energy
and Utilities
10.3.4. Consumer
Goods
10.3.5. Automotive
10.3.6. Others
10.4. North
America Green Bond Verification Market Revenue (US$ Mn), By Country
10.4.1. U.S
10.4.1.1. U.S
Green Bond Verification Market Revenue (US$ Mn) and Forecasts, By Services
10.4.1.1.1. Pre-Issuance
Verification and Post-Issuance Verification Services
10.4.1.1.2. Advisory
Services
10.4.1.1.3. Others
10.4.1.2. U.S
Green Bond Verification Market Revenue (US$ Mn) and Forecasts, By Verticals
10.4.1.2.1. Banking,
Financial Services and Insurance (BFSI) Software
10.4.1.2.2. Real
Estate Consulting
10.4.1.2.3. Energy
and Utilities
10.4.1.2.4. Consumer
Goods
10.4.1.2.5. Automotive
10.4.1.2.6. Others
10.4.2. Canada
10.4.2.1. Canada
Green Bond Verification Market Revenue (US$ Mn) and Forecasts, By Services
10.4.2.1.1. Pre-Issuance
Verification and Post-Issuance Verification Services
10.4.2.1.2. Advisory
Services
10.4.2.1.3. Others
10.4.2.2. Canada
Green Bond Verification Market Revenue (US$ Mn) and Forecasts, By Verticals
10.4.2.2.1. Banking,
Financial Services and Insurance (BFSI) Software
10.4.2.2.2. Real
Estate Consulting
10.4.2.2.3. Energy
and Utilities
10.4.2.2.4. Consumer
Goods
10.4.2.2.5. Automotive
10.4.2.2.6. Others
10.4.3. Mexico
10.4.3.1. Mexico
Green Bond Verification Market Revenue (US$ Mn) and Forecasts, By Services
10.4.3.1.1. Pre-Issuance
Verification and Post-Issuance Verification Services
10.4.3.1.2. Advisory
Services
10.4.3.1.3. Others
10.4.3.2. Mexico
Green Bond Verification Market Revenue (US$ Mn) and Forecasts, By Verticals
10.4.3.2.1. Banking,
Financial Services and Insurance (BFSI) Software
10.4.3.2.2. Real
Estate Consulting
10.4.3.2.3. Energy
and Utilities
10.4.3.2.4. Consumer
Goods
10.4.3.2.5. Automotive
10.4.3.2.6. Others
10.4.4. Rest of
North America
10.4.4.1. Rest
of North America Green Bond Verification Market Revenue (US$ Mn) and Forecasts,
By Services
10.4.4.1.1. Pre-Issuance
Verification and Post-Issuance Verification Services
10.4.4.1.2. Advisory
Services
10.4.4.1.3. Others
10.4.4.2. Rest
of North America Green Bond Verification Market Revenue (US$ Mn) and Forecasts,
By Verticals
10.4.4.2.1. Banking,
Financial Services and Insurance (BFSI) Software
10.4.4.2.2. Real
Estate Consulting
10.4.4.2.3. Energy
and Utilities
10.4.4.2.4. Consumer
Goods
10.4.4.2.5. Automotive
10.4.4.2.6. Others
10.5. Key
Segment for Channeling Investments
10.5.1. By
Country
10.5.2. By
Services
10.5.3. By
Verticals
11. Competitive
Benchmarking
11.1. Market
Share Analysis, 2018
11.2. North
America Presence and Growth Strategies
11.2.1. Mergers
and Acquisitions
11.2.2. Product
Launches
11.2.3. Investments
Trends
11.2.4. R&D
Initiatives
12. Player
Profiles
12.1. Carbon
trust
12.1.1. Company
Details
12.1.2. Company
Overview
12.1.3. Product
Offerings
12.1.4. Key
Developments
12.1.5. Financial
Analysis
12.1.6. SWOT
Analysis
12.1.7. Business
Strategies
12.2. DNV GL
12.2.1. Company
Details
12.2.2. Company
Overview
12.2.3. Product
Offerings
12.2.4. Key
Developments
12.2.5. Financial
Analysis
12.2.6. SWOT
Analysis
12.2.7. Business
Strategies
12.3. EY
12.3.1. Company
Details
12.3.2. Company
Overview
12.3.3. Product
Offerings
12.3.4. Key Developments
12.3.5. Financial
Analysis
12.3.6. SWOT
Analysis
12.3.7. Business
Strategies
12.4. First
Environment Inc.
12.4.1. Company
Details
12.4.2. Company
Overview
12.4.3. Product
Offerings
12.4.4. Key
Developments
12.4.5. Financial
Analysis
12.4.6. SWOT
Analysis
12.4.7. Business
Strategies
12.5. Indufor
Group
12.5.1. Company
Details
12.5.2. Company
Overview
12.5.3. Product
Offerings
12.5.4. Key
Developments
12.5.5. Financial
Analysis
12.5.6. SWOT
Analysis
12.5.7. Business
Strategies
12.6. ISS
Corporate Solutions Inc
12.6.1. Company
Details
12.6.2. Company
Overview
12.6.3. Product
Offerings
12.6.4. Key
Developments
12.6.5. Financial
Analysis
12.6.6. SWOT
Analysis
12.6.7. Business
Strategies
12.7. Kestrel
Verifiers
12.7.1. Company
Details
12.7.2. Company
Overview
12.7.3. Product
Offerings
12.7.4. Key
Developments
12.7.5. Financial
Analysis
12.7.6. SWOT
Analysis
12.7.7. Business
Strategies
12.8. KPMG
International Cooperative
12.8.1. Company
Details
12.8.2. Company
Overview
12.8.3. Product
Offerings
12.8.4. Key
Developments
12.8.5. Financial
Analysis
12.8.6. SWOT
Analysis
12.8.7. Business
Strategies
12.9. SUSTAINANALYTICS
12.9.1. Company
Details
12.9.2. Company
Overview
12.9.3. Product
Offerings
12.9.4. Key
Developments
12.9.5. Financial
Analysis
12.9.6. SWOT
Analysis
12.9.7. Business
Strategies
12.10. S &
P Trucost Limited
12.10.1. Company
Details
12.10.2. Company
Overview
12.10.3. Product
Offerings
12.10.4. Key
Developments
12.10.5. Financial
Analysis
12.10.6. SWOT
Analysis
12.10.7. Business
Strategies
12.11. TÜV NORD
GROUP
12.11.1. Company
Details
12.11.2. Company
Overview
12.11.3. Product
Offerings
12.11.4. Key
Developments
12.11.5. Financial
Analysis
12.11.6. SWOT
Analysis
12.11.7. Business
Strategies
12.12. Vigeo
Eiris
12.12.1. Company
Details
12.12.2. Company
Overview
12.12.3. Product
Offerings
12.12.4. Key Developments
12.12.5. Financial
Analysis
12.12.6. SWOT
Analysis
12.12.7. Business Strategies
12.13. Other
Market Participants
13. Key
Findings
Note: This ToC is tentative
and can be changed according to the research study conducted during the course
of report completion.
**Exclusive for Multi-User and
Enterprise User.
At Absolute Markets Insights, we are engaged in building both global as well as country specific reports. As a result, the approach taken for deriving the estimation and forecast for a specific country is a bit unique and different in comparison to the global research studies. In this case, we not only study the concerned market factors & trends prevailing in a particular country (from secondary research) but we also tend to calculate the actual market size & forecast from the revenue generated from the market participants involved in manufacturing or distributing the any concerned product. These companies can also be service providers. For analyzing any country specifically, we do consider the growth factors prevailing under the states/cities/county for the same. For instance, if we are analyzing an industry specific to United States, we primarily need to study about the states present under the same(where the product/service has the highest growth). Similar analysis will be followed by other countries. Our scope of the report changes with different markets.
Our research study is mainly implement through a mix of both secondary and primary research. Various sources such as industry magazines, trade journals, and government websites and trade associations are reviewed for gathering precise data. Primary interviews are conducted to validate the market size derived from secondary research. Industry experts, major manufacturers and distributors are contacted for further validation purpose on the current market penetration and growth trends.
Prominent participants in our primary research process include:
- Key Opinion Leaders namely the CEOs, CSOs, VPs, purchasing managers, amongst others
- Research and development participants, distributors/suppliers and subject matter experts
Secondary Research includes data extracted from paid data sources:
- Reuters
- Factiva
- Bloomberg
- One Source
- Hoovers
Research Methodology

Key Inclusions


