
Internet of things (IoT) Insurance Market, by Offering (Solutions and Services), by Application (Connected Car, Connected Home, Connected Health, Connected Industrials, Connected Supply Chains, and Others), by Region (United States, Canada, Mexico, France, The UK, Spain, Germany, Italy, Nordic Countries, Benelux Union, Rest of Europe, China, Japan, India, New Zealand, Australia, South Korea, Southeast Asia, Rest of Asia Pacific, Brazil, Argentina, Rest of Latin America, Saudi Arabia, UAE, Egypt, Kuwait, South Africa, Rest of Middle East & Africa) — Global Insights, Growth, Size, Comparative Analysis, Trends and Forecast, 2019–2027
Market Overview/Industry Trends
Internet of things is a concept of interconnecting devices to the internet to achieve valuable information. The objects and devices having built in sensors are connected to the internet of things platform, which helps to integrate the data from various devices and it allows to share valuable information with the applications built for addressing the specific needs. The Internet of things (IoT) platform is able to determine the exact information that is important and which can be ignored. For example, if an apparel manufacturer wants to know the buying pattern of the customers, internet of things technology with the help of sensors is installed in the store as connected devices, which help to find the information about the popular areas in the store where the customer spends the most time and also about the highest sold products. This information helps in making smart data driven decisions based on real-time information. This is now increasingly adopted by the insurers significantly rising the Internet of things (IoT) insurance market.
Insurance providers are currently looking into the adoption of internet of things-based models and services wherein they will render digital networking platform through internet of things wherein, they interact with the customers to get the insights about the existing products and services. This is anticipated to help the insurance providers to develop new products and services which harness the internet of things technologies. Earlier, the insurance providers mainly used the internet of things technology to support the interactions with the customers and to simplify the claims processing. However, now the devices which are networked on the internet of things also allow the insurers to interact with the customers more frequently and offer new services based on the data collected by the devices. For instance, Progressive, a US car insurance provider, is using the usage-based insurance telematics programme in order to monitor, how the car insurance customers drive. An open database device is installed in the vehicle. This device records the driving pattern and various other parameters that indicate about the driver’s performance. Through the open database (ODB) device and machine learning, the insurance provider is able to determine the performance of the driver on each journey. This helps them to price the premiums more accurately on individual basis, i.e., charge with reduced premiums for the safe drivers and higher premiums for the unsafe drivers. Progressive has partnered with Zubie, which is the manufacturer of open database devices, that helped to plug the device in the customer’s car. Progressive’s agreement with Zubie, allows the Zubie customers to track their driving patterns and based on that they are able to know how much premium Progressive would charge. Internet of things also enables the insurance companies to determine the risks more precisely. The auto insurers earlier had to rely on indirect indicators, such as age, creditworthiness, while deciding premiums. However, now they receive credible information about the behaviour of the driver and use of the vehicle. Application of internet of things technology is helping insurers to assess their services portfolios more efficiently, considering real-time data. In contrast, concerns regarding the lack of good network condition, which is essential for the smooth functioning of the Internet of things (IoT) connected devices is anticipated to hamper the Internet of things (IoT) insurance market growth over the forecast years.
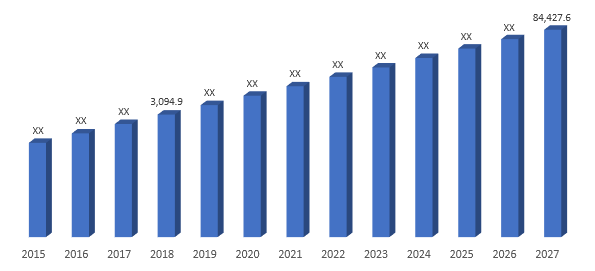
In terms of revenue, the global internet of things insurance market was estimated to be US$ 3,094.9 Mn in 2018 and is expected to reach US$ 84,427.6 Mn by 2027 growing at a CAGR of 44.7% over the forecast period. The study analyses the market in terms of revenue across all major regions, which has been further bifurcated into countries.
Global Internet of things (IoT) Insurance Market Revenue & Forecast, (US$ Million), 2015–2027
Offering Outlook:
The solution segment accounted for a large share in the Internet of things (IoT) insurance market in 2018 with the development of innovative technologies for integration of internet of things with insurance. For instance, In June 2015, Liberty Mutual Insurance, a U.S-based insurance company, which partnered with Nest Technologies (an information technology company based in the U.S.), in order to provide the customers with an internet of things technology, which is connecting the smoke alarms with a sensor to detect smoke, carbon monoxide, or other fire causing gases. This provides alerts on the customer’s phone indicating the fire hazard. They provided installation of these sensors free of cost, for which, later the company will charge up to 5% off of the customer’s insurance premiums for the device already installed. This is helping in reducing the risk of increasing claims because of safety measures obtained by incorporation of internet of things technology.
Application Outlook:
The connected car accounted for the largest revenue generating segment during 2018 in the Internet of things (IoT) insurance market, and is expected to continue the dominance over the forecast period. Internet of things has wide application across the connected car segment with incorporation of internet of things in the development of insurance policies. For instance, Metromile, an auto insurance company in United States, developed their first pay-per-mile car insurance policy named, Metromile Pulse, using telematics. It offers open database port ODB2 in order to transfer data to their smart driving app. The app helps the drivers to access information about their personalized driving trends to provide an informed and connected experience. The advent of Google and Amazon, has made the smart home devices affordable and accessible to the customers. Connected home segment includes connecting the smart home devices to the Internet of things (IoT) platform. This will help the insurance providers to record the information regarding the safety and security of the customers. Insurance providers have started providing add-on services like home security and convenience services to the individuals using smart home devices.
Similarly, connected health segment involves the use of connected devices by customers in order to receive real-time information about the health and wellness of the individual. For instance, in December 2014, a health insurance start-up, Oscar has partnered with a consumer electronics company, Misfit, in order to provide the customers with wearable trackers to obtain real time information about the individual’s health. The connected supply chain segment is expected to register the fastest CAGR in the Internet of things (IoT) insurance market over the forecast years. This segment involves connecting supply chain processes to Internet of things (IoT) platform in order to achieve information regarding the goods. Internet of things (IoT) connected supply chain helps to obtain information about the location of goods, monitor the storage conditions of the products via global positioning system (GPS) and other technologies. This helps the insurance providers to track and obtain data about the product flow to the customers and distribution channels.
Regional Outlook:
North America accounted for the largest revenue in 2018, owing to the adoption of smart devices to achieve real time information, which helps the insurance providers to develop innovative insurance solutions like customized premiums. For instance, in June 2019, State Farm, a United States insurance provider, introduced their drive safe and save telematics programme, wherein the insurer detects information via a smartphone about the customer’s driving pattern. This information is achieved from the customer’s mobile device or the communications service provider. The incorporation of the internet of things technology helps the customers to save up to 50 percent on their annual policy. Europe accounted for the second highest share in the Internet of things (IoT) insurance market and is expected to increase over the forecast years. A German software company, SAP SE, developed a new enterprise resource planning (ERP) software which is a software that helps to manage business and automate back office functions. SAP developed an ERP named SAP S/4HANA is integrated with internet of things technology and connect it to a network. The integration of this ERP software with internet of things helps in easier and fast access of the data related to insurance claims, processing, and premiums among others. This ERP system was specially developed for the insurance industry.
Competitive Landscape
The report provides both qualitative and quantitative research of internet of things insurance market as well as provides comprehensive insights and development methods adopted by the prominent market players. Major market players are increasingly adopting the internet of things based models for their businesses to develop new insurance policies and to develop easier claim processes in order to improve their products, processes and overall business models. Some of the key market participants in the Internet of things (IoT) Insurance Market are Accenture, Allianz, American Family Insurance, AXA, Capgemini, Cognizant, Hippo Insurance, IBM Corporation, Lemonade Insurance Agency, LexisNexis, Liberty Mutual Insurance, Oracle Corporation, Oscar Insurance Corporation, Progressive Casualty Insurance Company, Inc., SAP SE, State Farm. For each company, the report studies their global presence, competitors, and product offerings, among others.

Global Internet of things (IoT) Insurance Market:
- By Offering
- Solutions
- Applications and Platforms
- Middleware
- Infrastructure and Protocols
- Services
- Solutions
- By Application
- Connected Car
- Connected Home
- Connected Health
- Connected Industrials
- Connected Supply Chain
- Others
- By Region
- North America
- United States
- Canada
- Mexico
- Europe
- France
- The UK
- Spain
- Germany
- Italy
- Nordic Countries
- Denmark
- Finland
- Iceland
- Sweden
- Norway
- Benelux Union
- Belgium
- The Netherlands
- Luxembourg
- Rest of Europe
- Asia Pacific
- China
- Japan
- India
- New Zealand
- Australia
- South Korea
- Southeast Asia
- Indonesia
- Thailand
- Malaysia
- Singapore
- Rest of Southeast Asia
- Rest of Asia Pacific
- Latin America
- Brazil
- Argentina
- Rest of Latin America
- Middle East and Africa
- Saudi Arabia
- UAE
- Egypt
- Kuwait
- South Africa
- Rest of Middle East & Africa
- North America
Table of Contents
![]()
1. Market
Scope
1.1. Market
Segmentation
1.2. Years
Considered
1.2.1. Historic
Years: 2013 - 2017
1.2.2. Base
Year: 2018
1.2.3. Forecast
Years: 2019 – 2027
2. Key Target
Audiences
3. Research
Methodology
3.1. Primary
Research
3.1.1. Research
Questionnaire
3.1.2. Global
Percentage Breakdown
3.1.3. Primary
Interviews: Key Opinion Leaders (KOLs)
3.2. Secondary
Research
3.2.1. Paid
Databases
3.2.2. Secondary
Sources
3.3. Market
Size Estimates
3.3.1. Top-Down
Approach
3.3.2. Bottom-Up
Approach
3.4. Data
Triangulation Methodology
3.5. Research
Assumptions
4. Recommendations
and Insights from AMI’s Perspective**
5. Holistic
Overview of IoT Insurance Market
6. Market
Synopsis: IoT Insurance Market
7. IoT
Insurance Market Analysis: Qualitative Perspective
7.1. Introduction
7.1.1. Product
Definition
7.1.2. Industry
Development
7.2. Market
Dynamics
7.2.1. Drivers
7.2.2. Restraints
7.2.3. Opportunities
7.3. Trends in
IoT Insurance Market
7.4. Market
Determinants Radar Chart
7.5. Macro-Economic
and Micro-Economic Indicators: IoT Insurance Market
7.6. Porter’s
Five Force Analysis
8. Global IoT
Insurance Market Analysis and Forecasts, 2019 – 2027
8.1. Overview
8.1.1. Global
IoT Insurance Market Revenue (US$ Mn)
8.2. Global IoT
Insurance Market Revenue (US$ Mn) and Forecasts, By Offering
8.2.1. Solutions
(Definition, Market Estimation and Penetration, 2013 – 2018, Market Estimation
(2013 – 2018), Market Forecast (2019 – 2027), Compound Annual Growth Rate
(CAGR), Regional Bifurcation (North America, Europe, Asia Pacific, Middle East
and Africa, Latin America) and Information on Applications and Platforms,
Middleware, Infrastructure and Protocols)
8.2.1.1. Applications
and Platforms
8.2.1.2. Middleware
8.2.1.3. Infrastructure
and Protocols
8.2.2. Services
8.2.2.1. Definition
8.2.2.2. Market
Estimation and Penetration, 2013 – 2018
8.2.2.3. Market
Forecast, 2019 – 2027
8.2.2.4. Compound
Annual Growth Rate (CAGR)
8.2.2.5. Regional
Bifurcation
8.2.2.5.1. North
America
8.2.2.5.1.1. Market
Estimation, 2013 – 2018
8.2.2.5.1.2. Market
Forecast, 2019 – 2027
8.2.2.5.2. Europe
8.2.2.5.2.1. Market
Estimation, 2013 – 2018
8.2.2.5.2.2. Market
Forecast, 2019 – 2027
8.2.2.5.3. Asia
Pacific
8.2.2.5.3.1. Market
Estimation, 2013 – 2018
8.2.2.5.3.2. Market
Forecast, 2019 – 2027
8.2.2.5.4. Middle
East and Africa
8.2.2.5.4.1. Market
Estimation, 2013 – 2018
8.2.2.5.4.2. Market
Forecast, 2019 – 2027
8.2.2.5.5. Latin
America
8.2.2.5.5.1. Market
Estimation, 2013 – 2018
8.2.2.5.5.2. Market
Forecast, 2019 – 2027
8.3. Key
Segment for Channeling Investments
8.3.1. By
Offering
9. Global IoT
Insurance Market Analysis and Forecasts, 2019 – 2027
9.1. Overview
9.2. Global IoT
Insurance Market Revenue (US$ Mn) and Forecasts, By Application
9.2.1. Connected
Car
9.2.1.1. Definition
9.2.1.2. Market
Estimation and Penetration, 2013 – 2018
9.2.1.3. Market
Forecast, 2019 – 2027
9.2.1.4. Compound
Annual Growth Rate (CAGR)
9.2.1.5. Regional
Bifurcation
9.2.1.5.1. North
America
9.2.1.5.1.1. Market
Estimation, 2013 – 2018
9.2.1.5.1.2. Market
Forecast, 2019 – 2027
9.2.1.5.2. Europe
9.2.1.5.2.1. Market
Estimation, 2013 – 2018
9.2.1.5.2.2. Market
Forecast, 2019 – 2027
9.2.1.5.3. Asia
Pacific
9.2.1.5.3.1. Market
Estimation, 2013 – 2018
9.2.1.5.3.2. Market
Forecast, 2019 – 2027
9.2.1.5.4. Middle
East and Africa
9.2.1.5.4.1. Market
Estimation, 2013 – 2018
9.2.1.5.4.2. Market
Forecast, 2019 – 2027
9.2.1.5.5. Latin
America
9.2.1.5.5.1. Market
Estimation, 2013 – 2018
9.2.1.5.5.2. Market
Forecast, 2019 – 2027
9.2.2. Connected
Home
9.2.2.1. Definition
9.2.2.2. Market
Estimation and Penetration, 2013 – 2018
9.2.2.3. Market
Forecast, 2019 – 2027
9.2.2.4. Compound
Annual Growth Rate (CAGR)
9.2.2.5. Regional
Bifurcation
9.2.2.5.1. North
America
9.2.2.5.1.1. Market
Estimation, 2013 – 2018
9.2.2.5.1.2. Market
Forecast, 2019 – 2027
9.2.2.5.2. Europe
9.2.2.5.2.1. Market
Estimation, 2013 – 2018
9.2.2.5.2.2. Market
Forecast, 2019 – 2027
9.2.2.5.3. Asia
Pacific
9.2.2.5.3.1. Market
Estimation, 2013 – 2018
9.2.2.5.3.2. Market
Forecast, 2019 – 2027
9.2.2.5.4. Middle
East and Africa
9.2.2.5.4.1. Market
Estimation, 2013 – 2018
9.2.2.5.4.2. Market
Forecast, 2019 – 2027
9.2.2.5.5. Latin
America
9.2.2.5.5.1. Market
Estimation, 2013 – 2018
9.2.2.5.5.2. Market
Forecast, 2019 – 2027
9.2.3. Connected
Health
9.2.3.1. Definition
9.2.3.2. Market
Estimation and Penetration, 2013 – 2018
9.2.3.3. Market
Forecast, 2019 – 2027
9.2.3.4. Compound
Annual Growth Rate (CAGR)
9.2.3.5. Regional
Bifurcation
9.2.3.5.1. North
America
9.2.3.5.1.1. Market
Estimation, 2013 – 2018
9.2.3.5.1.2. Market
Forecast, 2019 – 2027
9.2.3.5.2. Europe
9.2.3.5.2.1. Market
Estimation, 2013 – 2018
9.2.3.5.2.2. Market
Forecast, 2019 – 2027
9.2.3.5.3. Asia
Pacific
9.2.3.5.3.1. Market
Estimation, 2013 – 2018
9.2.3.5.3.2. Market
Forecast, 2019 – 2027
9.2.3.5.4. Middle
East and Africa
9.2.3.5.4.1. Market
Estimation, 2013 – 2018
9.2.3.5.4.2. Market
Forecast, 2019 – 2027
9.2.3.5.5. Latin
America
9.2.3.5.5.1. Market
Estimation, 2013 – 2018
9.2.3.5.5.2. Market
Forecast, 2019 – 2027
9.2.4. Connected
Industrials
9.2.4.1. Definition
9.2.4.2. Market
Estimation and Penetration, 2013 – 2018
9.2.4.3. Market
Forecast, 2019 – 2027
9.2.4.4. Compound
Annual Growth Rate (CAGR)
9.2.4.5. Regional
Bifurcation
9.2.4.5.1. North
America
9.2.4.5.1.1. Market
Estimation, 2013 – 2018
9.2.4.5.1.2. Market
Forecast, 2019 – 2027
9.2.4.5.2. Europe
9.2.4.5.2.1. Market
Estimation, 2013 – 2018
9.2.4.5.2.2. Market
Forecast, 2019 – 2027
9.2.4.5.3. Asia
Pacific
9.2.4.5.3.1. Market
Estimation, 2013 – 2018
9.2.4.5.3.2. Market
Forecast, 2019 – 2027
9.2.4.5.4. Middle
East and Africa
9.2.4.5.4.1. Market
Estimation, 2013 – 2018
9.2.4.5.4.2. Market
Forecast, 2019 – 2027
9.2.4.5.5. Latin
America
9.2.4.5.5.1. Market
Estimation, 2013 – 2018
9.2.4.5.5.2. Market
Forecast, 2019 – 2027
9.2.5. Connected
Supply Chain
9.2.5.1. Definition
9.2.5.2. Market
Estimation and Penetration, 2013 – 2018
9.2.5.3. Market
Forecast, 2019 – 2027
9.2.5.4. Compound
Annual Growth Rate (CAGR)
9.2.5.5. Regional
Bifurcation
9.2.5.5.1. North
America
9.2.5.5.1.1. Market
Estimation, 2013 – 2018
9.2.5.5.1.2. Market
Forecast, 2019 – 2027
9.2.5.5.2. Europe
9.2.5.5.2.1. Market
Estimation, 2013 – 2018
9.2.5.5.2.2. Market
Forecast, 2019 – 2027
9.2.5.5.3. Asia
Pacific
9.2.5.5.3.1. Market
Estimation, 2013 – 2018
9.2.5.5.3.2. Market
Forecast, 2019 – 2027
9.2.5.5.4. Middle
East and Africa
9.2.5.5.4.1. Market
Estimation, 2013 – 2018
9.2.5.5.4.2. Market
Forecast, 2019 – 2027
9.2.5.5.5. Latin
America
9.2.5.5.5.1. Market
Estimation, 2013 – 2018
9.2.5.5.5.2. Market
Forecast, 2019 – 2027
9.2.6. Others
9.2.6.1. Definition
9.2.6.2. Market
Estimation and Penetration, 2013 – 2018
9.2.6.3. Market
Forecast, 2019 – 2027
9.2.6.4. Compound
Annual Growth Rate (CAGR)
9.2.6.5. Regional
Bifurcation
9.2.6.5.1. North
America
9.2.6.5.1.1. Market
Estimation, 2013 – 2018
9.2.6.5.1.2. Market
Forecast, 2019 – 2027
9.2.6.5.2. Europe
9.2.6.5.2.1. Market
Estimation, 2013 – 2018
9.2.6.5.2.2. Market
Forecast, 2019 – 2027
9.2.6.5.3. Asia
Pacific
9.2.6.5.3.1. Market
Estimation, 2013 – 2018
9.2.6.5.3.2. Market
Forecast, 2019 – 2027
9.2.6.5.4. Middle
East and Africa
9.2.6.5.4.1. Market
Estimation, 2013 – 2018
9.2.6.5.4.2. Market
Forecast, 2019 – 2027
9.2.6.5.5. Latin
America
9.2.6.5.5.1. Market
Estimation, 2013 – 2018
9.2.6.5.5.2. Market
Forecast, 2019 – 2027
9.3. Key
Segment for Channeling Investments
9.3.1. By
Application
10. North
America IoT Insurance Market Analysis and Forecasts, 2019 - 2027
10.1. Overview
10.1.1. North
America IoT Insurance Market Revenue (US$ Mn)
10.2. North
America IoT Insurance Market Revenue (US$ Mn) and Forecasts, By Offering
10.2.1. Solutions
10.2.1.1. Applications
and Platforms
10.2.1.2. Middleware
10.2.1.3. Infrastructure
and Protocols
10.2.2. Services
10.3. North
America IoT Insurance Market Revenue (US$ Mn) and Forecasts, By Application
10.3.1. Connected
Car
10.3.2. Connected
Home
10.3.3. Connected
Health
10.3.4. Connected
Industrials
10.3.5. Connected
Supply Chain
10.3.6. Others
10.4. North
America IoT Insurance Market Revenue (US$ Mn) and Forecasts, By Country
10.4.1. U.S
10.4.1.1. U.S
IoT Insurance Market Revenue (US$ Mn) and Forecasts, By Offering
10.4.1.1.1. Solutions
10.4.1.1.1.1. Applications
and Platforms
10.4.1.1.1.2. Middleware
10.4.1.1.1.3. Infrastructure
and Protocols
10.4.1.1.2. Services
10.4.1.2. U.S
IoT Insurance Market Revenue (US$ Mn) and Forecasts, By Application
10.4.1.2.1. Connected
Car
10.4.1.2.2. Connected
Home
10.4.1.2.3. Connected
Health
10.4.1.2.4. Connected
Industrials
10.4.1.2.5. Connected
Supply Chain
10.4.1.2.6. Others
10.4.2. Canada
10.4.2.1. Canada
IoT Insurance Market Revenue (US$ Mn) and Forecasts, By Offering
10.4.2.1.1. Solutions
10.4.2.1.1.1. Applications
and Platforms
10.4.2.1.1.2. Middleware
10.4.2.1.1.3. Infrastructure
and Protocols
10.4.2.1.2. Services
10.4.2.2. Canada
IoT Insurance Market Revenue (US$ Mn) and Forecasts, By Application
10.4.2.2.1. Connected
Car
10.4.2.2.2. Connected
Home
10.4.2.2.3. Connected
Health
10.4.2.2.4. Connected
Industrials
10.4.2.2.5. Connected
Supply Chain
10.4.2.2.6. Others
10.4.3. Mexico
10.4.3.1. Mexico
IoT Insurance Market Revenue (US$ Mn) and Forecasts, By Offering
10.4.3.1.1. Solutions
10.4.3.1.1.1. Applications
and Platforms
10.4.3.1.1.2. Middleware
10.4.3.1.1.3. Infrastructure
and Protocols
10.4.3.1.2. Services
10.4.3.2. Mexico
IoT Insurance Market Revenue (US$ Mn) and Forecasts, By Application
10.4.3.2.1. Connected
Car
10.4.3.2.2. Connected
Home
10.4.3.2.3. Connected
Health
10.4.3.2.4. Connected
Industrials
10.4.3.2.5. Connected
Supply Chain
10.4.3.2.6. Others
10.4.4. Rest of
North America
10.4.4.1. Rest
of North America IoT Insurance Market Revenue (US$ Mn) and Forecasts, By
Offering
10.4.4.1.1. Solutions
10.4.4.1.1.1. Applications
and Platforms
10.4.4.1.1.2. Middleware
10.4.4.1.1.3. Infrastructure
and Protocols
10.4.4.1.2. Services
10.4.4.2. Rest
of North America IoT Insurance Market Revenue (US$ Mn) and Forecasts, By
Application
10.4.4.2.1. Connected
Car
10.4.4.2.2. Connected
Home
10.4.4.2.3. Connected
Health
10.4.4.2.4. Connected
Industrials
10.4.4.2.5. Connected
Supply Chain
10.4.4.2.6. Others
10.5. Key
Segment for Channeling Investments
10.5.1. By
Country
10.5.2. By
Offering
10.5.3. By
Application
11. Europe IoT
Insurance Market Analysis and Forecasts, 2019 - 2027
11.1. Overview
11.1.1. Europe
IoT Insurance Market Revenue (US$ Mn)
11.2. Europe
IoT Insurance Market Revenue (US$ Mn) and Forecasts, By Offering
11.2.1. Solutions
11.2.1.1. Applications
and Platforms
11.2.1.2. Middleware
11.2.1.3. Infrastructure
and Protocols
11.2.2. Services
11.3. Europe
IoT Insurance Market Revenue (US$ Mn) and Forecasts, By Application
11.3.1. Connected
Car
11.3.2. Connected
Home
11.3.3. Connected
Health
11.3.4. Connected
Industrials
11.3.5. Connected
Supply Chain
11.3.6. Others
11.4. Europe
IoT Insurance Market Revenue (US$ Mn) and Forecasts, By Country
11.4.1. France
11.4.1.1. France
IoT Insurance Market Revenue (US$ Mn) and Forecasts, By Offering
11.4.1.1.1. Solutions
11.4.1.1.1.1. Applications
and Platforms
11.4.1.1.1.2. Middleware
11.4.1.1.1.3. Infrastructure
and Protocols
11.4.1.1.2. Services
11.4.1.2. France
IoT Insurance Market Revenue (US$ Mn) and Forecasts, By Application
11.4.1.2.1. Connected
Car
11.4.1.2.2. Connected
Home
11.4.1.2.3. Connected
Health
11.4.1.2.4. Connected
Industrials
11.4.1.2.5. Connected
Supply Chain
11.4.1.2.6. Others
11.4.2. The UK
11.4.2.1. The
UK IoT Insurance Market Revenue (US$ Mn) and Forecasts, By Offering
11.4.2.1.1. Solutions
11.4.2.1.1.1. Applications
and Platforms
11.4.2.1.1.2. Middleware
11.4.2.1.1.3. Infrastructure
and Protocols
11.4.2.1.2. Services
11.4.2.2. The
UK IoT Insurance Market Revenue (US$ Mn) and Forecasts, By Application
11.4.2.2.1. Connected
Car
11.4.2.2.2. Connected
Home
11.4.2.2.3. Connected
Health
11.4.2.2.4. Connected
Industrials
11.4.2.2.5. Connected
Supply Chain
11.4.2.2.6. Others
11.4.3. Spain
11.4.3.1. Spain
IoT Insurance Market Revenue (US$ Mn) and Forecasts, By Offering
11.4.3.1.1. Solutions
11.4.3.1.1.1. Applications
and Platforms
11.4.3.1.1.2. Middleware
11.4.3.1.1.3. Infrastructure
and Protocols
11.4.3.1.2. Services
11.4.3.2. Spain
IoT Insurance Market Revenue (US$ Mn) and Forecasts, By Application
11.4.3.2.1. Connected
Car
11.4.3.2.2. Connected
Home
11.4.3.2.3. Connected
Health
11.4.3.2.4. Connected
Industrials
11.4.3.2.5. Connected
Supply Chain
11.4.3.2.6. Others
11.4.4. Germany
11.4.4.1. Germany
IoT Insurance Market Revenue (US$ Mn) and Forecasts, By Offering
11.4.4.1.1. Solutions
11.4.4.1.1.1. Applications
and Platforms
11.4.4.1.1.2. Middleware
11.4.4.1.1.3. Infrastructure
and Protocols
11.4.4.1.2. Services
11.4.4.2. Germany
IoT Insurance Market Revenue (US$ Mn) and Forecasts, By Application
11.4.4.2.1. Connected
Car
11.4.4.2.2. Connected
Home
11.4.4.2.3. Connected
Health
11.4.4.2.4. Connected
Industrials
11.4.4.2.5. Connected
Supply Chain
11.4.4.2.6. Others
11.4.5. Italy
11.4.5.1. Italy
IoT Insurance Market Revenue (US$ Mn) and Forecasts, By Offering
11.4.5.1.1. Solutions
11.4.5.1.1.1. Applications
and Platforms
11.4.5.1.1.2. Middleware
11.4.5.1.1.3. Infrastructure
and Protocols
11.4.5.1.2. Services
11.4.5.2. Italy
IoT Insurance Market Revenue (US$ Mn) and Forecasts, By Application
11.4.5.2.1. Connected
Car
11.4.5.2.2. Connected
Home
11.4.5.2.3. Connected
Health
11.4.5.2.4. Connected
Industrials
11.4.5.2.5. Connected
Supply Chain
11.4.5.2.6. Others
11.4.6. Nordic
Countries
11.4.6.1. Nordic
Countries IoT Insurance Market Revenue (US$ Mn) and Forecasts, By Offering
11.4.6.1.1. Solutions
11.4.6.1.1.1. Applications
and Platforms
11.4.6.1.1.2. Middleware
11.4.6.1.1.3. Infrastructure
and Protocols
11.4.6.1.2. Services
11.4.6.2. Nordic
Countries IoT Insurance Market Revenue (US$ Mn) and Forecasts, By Application
11.4.6.2.1. Connected
Car
11.4.6.2.2. Connected
Home
11.4.6.2.3. Connected
Health
11.4.6.2.4. Connected
Industrials
11.4.6.2.5. Connected
Supply Chain
11.4.6.2.6. Others
11.4.6.3. Nordic
Countries IoT Insurance Market Revenue (US$ Mn) and Forecasts, By Country
11.4.6.3.1. Denmark
11.4.6.3.2. Finland
11.4.6.3.3. Iceland
11.4.6.3.4. Sweden
11.4.6.3.5. Norway
11.4.7. Benelux
Union
11.4.7.1. Benelux
Union IoT Insurance Market Revenue (US$ Mn) and Forecasts, By Offering
11.4.7.1.1. Solutions
11.4.7.1.1.1. Applications
and Platforms
11.4.7.1.1.2. Middleware
11.4.7.1.1.3. Infrastructure
and Protocols
11.4.7.1.2. Services
11.4.7.2. Benelux
Union IoT Insurance Market Revenue (US$ Mn) and Forecasts, By Application
11.4.7.2.1. Connected
Car
11.4.7.2.2. Connected
Home
11.4.7.2.3. Connected
Health
11.4.7.2.4. Connected
Industrials
11.4.7.2.5. Connected
Supply Chain
11.4.7.2.6. Others
11.4.7.3. Benelux
Union IoT Insurance Market Revenue (US$ Mn) and Forecasts, By Country
11.4.7.3.1. Belgium
11.4.7.3.2. The
Netherlands
11.4.7.3.3. Luxembourg
11.4.8. Rest of
Europe
11.4.8.1. Rest
of Europe IoT Insurance Market Revenue (US$ Mn) and Forecasts, By Offering
11.4.8.1.1. Solutions
11.4.8.1.1.1. Applications
and Platforms
11.4.8.1.1.2. Middleware
11.4.8.1.1.3. Infrastructure
and Protocols
11.4.8.1.2. Services
11.4.8.2. Rest
of Europe IoT Insurance Market Revenue (US$ Mn) and Forecasts, By Application
11.4.8.2.1. Connected
Car
11.4.8.2.2. Connected
Home
11.4.8.2.3. Connected
Health
11.4.8.2.4. Connected
Industrials
11.4.8.2.5. Connected
Supply Chain
11.4.8.2.6. Others
11.5. Key
Segment for Channeling Investments
11.5.1. By
Country
11.5.2. By
Offering
11.5.3. By
Application
12. Asia
Pacific IoT Insurance Market Analysis and Forecasts, 2019 - 2027
12.1. Overview
12.1.1. Asia
Pacific IoT Insurance Market Revenue (US$ Mn)
12.2. Asia
Pacific IoT Insurance Market Revenue (US$ Mn) and Forecasts, By Offering
12.2.1. Solutions
12.2.1.1. Applications
and Platforms
12.2.1.2. Middleware
12.2.1.3. Infrastructure
and Protocols
12.2.2. Services
12.3. Asia
Pacific IoT Insurance Market Revenue (US$ Mn) and Forecasts, By Application
12.3.1. Connected
Car
12.3.2. Connected
Home
12.3.3. Connected
Health
12.3.4. Connected
Industrials
12.3.5. Connected
Supply Chain
12.3.6. Others
12.4. Asia
Pacific IoT Insurance Market Revenue (US$ Mn) and Forecasts, By Country
12.4.1. China
12.4.1.1. China
IoT Insurance Market Revenue (US$ Mn) and Forecasts, By Offering
12.4.1.1.1. Solutions
12.4.1.1.1.1. Applications
and Platforms
12.4.1.1.1.2. Middleware
12.4.1.1.1.3. Infrastructure
and Protocols
12.4.1.1.2. Services
12.4.1.2. China
IoT Insurance Market Revenue (US$ Mn) and Forecasts, By Application
12.4.1.2.1. Connected
Car
12.4.1.2.2. Connected
Home
12.4.1.2.3. Connected
Health
12.4.1.2.4. Connected
Industrials
12.4.1.2.5. Connected
Supply Chain
12.4.1.2.6. Others
12.4.2. Japan
12.4.2.1. Japan
IoT Insurance Market Revenue (US$ Mn) and Forecasts, By Offering
12.4.2.1.1. Solutions
12.4.2.1.1.1. Applications
and Platforms
12.4.2.1.1.2. Middleware
12.4.2.1.1.3. Infrastructure
and Protocols
12.4.2.1.2. Services
12.4.2.2. Japan
IoT Insurance Market Revenue (US$ Mn) and Forecasts, By Application
12.4.2.2.1. Connected
Car
12.4.2.2.2. Connected
Home
12.4.2.2.3. Connected
Health
12.4.2.2.4. Connected
Industrials
12.4.2.2.5. Connected
Supply Chain
12.4.2.2.6. Others
12.4.3. India
12.4.3.1. India
IoT Insurance Market Revenue (US$ Mn) and Forecasts, By Offering
12.4.3.1.1. Solutions
12.4.3.1.1.1. Applications
and Platforms
12.4.3.1.1.2. Middleware
12.4.3.1.1.3. Infrastructure
and Protocols
12.4.3.1.2. Services
12.4.3.2. India
IoT Insurance Market Revenue (US$ Mn) and Forecasts, By Application
12.4.3.2.1. Connected
Car
12.4.3.2.2. Connected
Home
12.4.3.2.3. Connected
Health
12.4.3.2.4. Connected
Industrials
12.4.3.2.5. Connected
Supply Chain
12.4.3.2.6. Others
12.4.4. New
Zealand
12.4.4.1. New
Zealand IoT Insurance Market Revenue (US$ Mn) and Forecasts, By Offering
12.4.4.1.1. Solutions
12.4.4.1.1.1. Applications
and Platforms
12.4.4.1.1.2. Middleware
12.4.4.1.1.3. Infrastructure
and Protocols
12.4.4.1.2. Services
12.4.4.2. New
Zealand IoT Insurance Market Revenue (US$ Mn) and Forecasts, By Application
12.4.4.2.1. Connected
Car
12.4.4.2.2. Connected
Home
12.4.4.2.3. Connected
Health
12.4.4.2.4. Connected
Industrials
12.4.4.2.5. Connected
Supply Chain
12.4.4.2.6. Others
12.4.5. Australia
12.4.5.1. Australia
IoT Insurance Market Revenue (US$ Mn) and Forecasts, By Offering
12.4.5.1.1. Solutions
12.4.5.1.1.1. Applications
and Platforms
12.4.5.1.1.2. Middleware
12.4.5.1.1.3. Infrastructure
and Protocols
12.4.5.1.2. Services
12.4.5.2. Australia
IoT Insurance Market Revenue (US$ Mn) and Forecasts, By Application
12.4.5.2.1. Connected
Car
12.4.5.2.2. Connected
Home
12.4.5.2.3. Connected
Health
12.4.5.2.4. Connected
Industrials
12.4.5.2.5. Connected
Supply Chain
12.4.5.2.6. Others
12.4.6. South
Korea
12.4.6.1. South
Korea IoT Insurance Market Revenue (US$ Mn) and Forecasts, By Offering
12.4.6.1.1. Solutions
12.4.6.1.1.1. Applications
and Platforms
12.4.6.1.1.2. Middleware
12.4.6.1.1.3. Infrastructure
and Protocols
12.4.6.1.2. Services
12.4.6.2. South
Korea IoT Insurance Market Revenue (US$ Mn) and Forecasts, By Application
12.4.6.2.1. Connected
Car
12.4.6.2.2. Connected
Home
12.4.6.2.3. Connected
Health
12.4.6.2.4. Connected
Industrials
12.4.6.2.5. Connected
Supply Chain
12.4.6.2.6. Others
12.4.7. Southeast
Asia
12.4.7.1. Southeast
Asia IoT Insurance Market Revenue (US$ Mn) and Forecasts, By Offering
12.4.7.1.1. Solutions
12.4.7.1.1.1. Applications
and Platforms
12.4.7.1.1.2. Middleware
12.4.7.1.1.3. Infrastructure
and Protocols
12.4.7.1.2. Services
12.4.7.2. Southeast
Asia IoT Insurance Market Revenue (US$ Mn) and Forecasts, By Application
12.4.7.2.1. Connected
Car
12.4.7.2.2. Connected
Home
12.4.7.2.3. Connected
Health
12.4.7.2.4. Connected
Industrials
12.4.7.2.5. Connected
Supply Chain
12.4.7.2.6. Others
12.4.7.3. Southeast
Asia IoT Insurance Market Revenue (US$ Mn) and Forecasts, By Country
12.4.7.3.1. Indonesia
12.4.7.3.2. Thailand
12.4.7.3.3. Malaysia
12.4.7.3.4. Singapore
12.4.7.3.5. Rest
of Southeast Asia
12.4.8. Rest of
Asia Pacific
12.4.8.1. Rest
of Asia Pacific IoT Insurance Market Revenue (US$ Mn) and Forecasts, By
Offering
12.4.8.1.1. Solutions
12.4.8.1.1.1. Applications
and Platforms
12.4.8.1.1.2. Middleware
12.4.8.1.1.3. Infrastructure
and Protocols
12.4.8.1.2. Services
12.4.8.2. Rest
of Asia Pacific IoT Insurance Market Revenue (US$ Mn) and Forecasts, By
Application
12.4.8.2.1. Connected
Car
12.4.8.2.2. Connected
Home
12.4.8.2.3. Connected
Health
12.4.8.2.4. Connected
Industrials
12.4.8.2.5. Connected
Supply Chain
12.4.8.2.6. Others
12.5. Key
Segment for Channeling Investments
12.5.1. By
Country
12.5.2. By
Offering
12.5.3. By
Application
13. Middle
East and Africa IoT Insurance Market Analysis and Forecasts, 2019 - 2027
13.1. Overview
13.1.1. Middle
East and Africa IoT Insurance Market Revenue (US$ Mn)
13.2. Middle
East and Africa IoT Insurance Market Revenue (US$ Mn) and Forecasts, By
Offering
13.2.1. Solutions
13.2.1.1. Applications
and Platforms
13.2.1.2. Middleware
13.2.1.3. Infrastructure
and Protocols
13.2.2. Services
13.3. Middle
East and Africa IoT Insurance Market Revenue (US$ Mn) and Forecasts, By
Application
13.3.1. Connected
Car
13.3.2. Connected
Home
13.3.3. Connected
Health
13.3.4. Connected
Industrials
13.3.5. Connected
Supply Chain
13.3.6. Others
13.4. Middle
East and Africa IoT Insurance Market Revenue (US$ Mn) and Forecasts, By Country
13.4.1. Saudi
Arabia
13.4.1.1. Saudi
Arabia IoT Insurance Market Revenue (US$ Mn) and Forecasts, By Offering
13.4.1.1.1. Solutions
13.4.1.1.1.1. Applications
and Platforms
13.4.1.1.1.2. Middleware
13.4.1.1.1.3. Infrastructure
and Protocols
13.4.1.1.2. Services
13.4.1.2. Saudi
Arabia IoT Insurance Market Revenue (US$ Mn) and Forecasts, By Application
13.4.1.2.1. Connected
Car
13.4.1.2.2. Connected
Home
13.4.1.2.3. Connected
Health
13.4.1.2.4. Connected
Industrials
13.4.1.2.5. Connected
Supply Chain
13.4.1.2.6. Others
13.4.2. UAE
13.4.2.1. UAE
IoT Insurance Market Revenue (US$ Mn) and Forecasts, By Offering
13.4.2.1.1. Solutions
13.4.2.1.1.1. Applications
and Platforms
13.4.2.1.1.2. Middleware
13.4.2.1.1.3. Infrastructure
and Protocols
13.4.2.1.2. Services
13.4.2.2. UAE
IoT Insurance Market Revenue (US$ Mn) and Forecasts, By Application
13.4.2.2.1. Connected
Car
13.4.2.2.2. Connected
Home
13.4.2.2.3. Connected
Health
13.4.2.2.4. Connected
Industrials
13.4.2.2.5. Connected
Supply Chain
13.4.2.2.6. Others
13.4.3. Egypt
13.4.3.1. Egypt
IoT Insurance Market Revenue (US$ Mn) and Forecasts, By Offering
13.4.3.1.1. Solutions
13.4.3.1.1.1. Applications
and Platforms
13.4.3.1.1.2. Middleware
13.4.3.1.1.3. Infrastructure
and Protocols
13.4.3.1.2. Services
13.4.3.2. Egypt
IoT Insurance Market Revenue (US$ Mn) and Forecasts, By Application
13.4.3.2.1. Connected
Car
13.4.3.2.2. Connected
Home
13.4.3.2.3. Connected
Health
13.4.3.2.4. Connected
Industrials
13.4.3.2.5. Connected
Supply Chain
13.4.3.2.6. Others
13.4.4. Kuwait
13.4.4.1. Kuwait
IoT Insurance Market Revenue (US$ Mn) and Forecasts, By Offering
13.4.4.1.1. Solutions
13.4.4.1.1.1. Applications
and Platforms
13.4.4.1.1.2. Middleware
13.4.4.1.1.3. Infrastructure
and Protocols
13.4.4.1.2. Services
13.4.4.2. Kuwait
IoT Insurance Market Revenue (US$ Mn) and Forecasts, By Application
13.4.4.2.1. Connected
Car
13.4.4.2.2. Connected
Home
13.4.4.2.3. Connected
Health
13.4.4.2.4. Connected
Industrials
13.4.4.2.5. Connected
Supply Chain
13.4.4.2.6. Others
13.4.5. South
Africa
13.4.5.1. South
Africa IoT Insurance Market Revenue (US$ Mn) and Forecasts, By Offering
13.4.5.1.1. Solutions
13.4.5.1.1.1. Applications
and Platforms
13.4.5.1.1.2. Middleware
13.4.5.1.1.3. Infrastructure
and Protocols
13.4.5.1.2. Services
13.4.5.2. South
Africa IoT Insurance Market Revenue (US$ Mn) and Forecasts, By Application
13.4.5.2.1. Connected
Car
13.4.5.2.2. Connected
Home
13.4.5.2.3. Connected
Health
13.4.5.2.4. Connected
Industrials
13.4.5.2.5. Connected
Supply Chain
13.4.5.2.6. Others
13.4.6. Rest of
Middle East & Africa
13.4.6.1. Rest
of Middle East & Africa IoT Insurance Market Revenue (US$ Mn) and
Forecasts, By Offering
13.4.6.1.1. Solutions
13.4.6.1.1.1. Applications
and Platforms
13.4.6.1.1.2. Middleware
13.4.6.1.1.3. Infrastructure
and Protocols
13.4.6.1.2. Services
13.4.6.2. Rest
of Middle East & Africa IoT Insurance Market Revenue (US$ Mn) and
Forecasts, By Application
13.4.6.2.1. Connected
Car
13.4.6.2.2. Connected
Home
13.4.6.2.3. Connected
Health
13.4.6.2.4. Connected
Industrials
13.4.6.2.5. Connected
Supply Chain
13.4.6.2.6. Others
13.5. Key
Segment for Channeling Investments
13.5.1. By
Country
13.5.2. By
Offering
13.5.3. By
Application
14. Latin
America IoT Insurance Market Analysis and Forecasts, 2019 - 2027
14.1. Overview
14.1.1. Latin
America IoT Insurance Market Revenue (US$ Mn)
14.2. Latin
America IoT Insurance Market Revenue (US$ Mn) and Forecasts, By Offering
14.2.1. Solutions
14.2.1.1. Applications
and Platforms
14.2.1.2. Middleware
14.2.1.3. Infrastructure
and Protocols
14.2.2. Services
14.3. Latin
America IoT Insurance Market Revenue (US$ Mn) and Forecasts, By Application
14.3.1. Connected
Car
14.3.2. Connected
Home
14.3.3. Connected
Health
14.3.4. Connected
Industrials
14.3.5. Connected
Supply Chain
14.3.6. Others
14.4. Latin
America IoT Insurance Market Revenue (US$ Mn) and Forecasts, By Country
14.4.1. Brazil
14.4.1.1. Brazil
IoT Insurance Market Revenue (US$ Mn) and Forecasts, By Offering
14.4.1.1.1. Solutions
14.4.1.1.1.1. Applications
and Platforms
14.4.1.1.1.2. Middleware
14.4.1.1.1.3. Infrastructure
and Protocols
14.4.1.1.2. Services
14.4.1.2. Brazil
IoT Insurance Market Revenue (US$ Mn) and Forecasts, By Application
14.4.1.2.1. Connected
Car
14.4.1.2.2. Connected
Home
14.4.1.2.3. Connected
Health
14.4.1.2.4. Connected
Industrials
14.4.1.2.5. Connected
Supply Chain
14.4.1.2.6. Others
14.4.2. Argentina
14.4.2.1. Argentina
IoT Insurance Market Revenue (US$ Mn) and Forecasts, By Offering
14.4.2.1.1. Solutions
14.4.2.1.1.1. Applications
and Platforms
14.4.2.1.1.2. Middleware
14.4.2.1.1.3. Infrastructure
and Protocols
14.4.2.1.2. Services
14.4.2.2. Argentina
IoT Insurance Market Revenue (US$ Mn) and Forecasts, By Application
14.4.2.2.1. Connected
Car
14.4.2.2.2. Connected
Home
14.4.2.2.3. Connected
Health
14.4.2.2.4. Connected
Industrials
14.4.2.2.5. Connected
Supply Chain
14.4.2.2.6. Others
14.4.3. Rest of
Latin America
14.4.3.1. Rest
of Latin America IoT Insurance Market Revenue (US$ Mn) and Forecasts, By
Offering
14.4.3.1.1. Solutions
14.4.3.1.1.1. Applications
and Platforms
14.4.3.1.1.2. Middleware
14.4.3.1.1.3. Infrastructure
and Protocols
14.4.3.1.2. Services
14.4.3.2. Rest
of Latin America IoT Insurance Market Revenue (US$ Mn) and Forecasts, By
Application
14.4.3.2.1. Connected
Car
14.4.3.2.2. Connected
Home
14.4.3.2.3. Connected
Health
14.4.3.2.4. Connected
Industrials
14.4.3.2.5. Connected
Supply Chain
14.4.3.2.6. Others
14.5. Key
Segment for Channeling Investments
14.5.1. By
Country
14.5.2. By Offering
14.5.3. By
Application
15. Competitive
Benchmarking
15.1. Market
Share Analysis, 2018
15.2. Global
Presence and Growth Strategies
15.2.1. Mergers
and Acquisitions
15.2.2. Product
Launches
15.2.3. Investments
Trends
15.2.4. R&D
Initiatives
16. Player
Profiles
16.1. Accenture
16.1.1. Company
Details
16.1.2. Company
Overview
16.1.3. Product
Offerings
16.1.4. Key
Developments
16.1.5. Financial
Analysis
16.1.6. SWOT
Analysis
16.1.7. Business
Strategies
16.2. Allianz
16.2.1. Company
Details
16.2.2. Company
Overview
16.2.3. Product
Offerings
16.2.4. Key
Developments
16.2.5. Financial
Analysis
16.2.6. SWOT
Analysis
16.2.7. Business
Strategies
16.3. American
Family Insurance
16.3.1. Company
Details
16.3.2. Company
Overview
16.3.3. Product
Offerings
16.3.4. Key
Developments
16.3.5. Financial
Analysis
16.3.6. SWOT
Analysis
16.3.7. Business
Strategies
16.4. AXA
16.4.1. Company
Details
16.4.2. Company
Overview
16.4.3. Product
Offerings
16.4.4. Key
Developments
16.4.5. Financial
Analysis
16.4.6. SWOT
Analysis
16.4.7. Business
Strategies
16.5. Capgemini
16.5.1. Company
Details
16.5.2. Company
Overview
16.5.3. Product
Offerings
16.5.4. Key
Developments
16.5.5. Financial
Analysis
16.5.6. SWOT
Analysis
16.5.7. Business
Strategies
16.6. Cognizant
16.6.1. Company
Details
16.6.2. Company
Overview
16.6.3. Product
Offerings
16.6.4. Key
Developments
16.6.5. Financial
Analysis
16.6.6. SWOT
Analysis
16.6.7. Business
Strategies
16.7. Hippo
Insurance
16.7.1. Company
Details
16.7.2. Company
Overview
16.7.3. Product
Offerings
16.7.4. Key
Developments
16.7.5. Financial
Analysis
16.7.6. SWOT
Analysis
16.7.7. Business
Strategies
16.8. IBM
Corporation
16.8.1. Company
Details
16.8.2. Company
Overview
16.8.3. Product
Offerings
16.8.4. Key
Developments
16.8.5. Financial
Analysis
16.8.6. SWOT
Analysis
16.8.7. Business
Strategies
16.9. Lemonade
Insurance Agency
16.9.1. Company
Details
16.9.2. Company
Overview
16.9.3. Product
Offerings
16.9.4. Key
Developments
16.9.5. Financial
Analysis
16.9.6. SWOT
Analysis
16.9.7. Business
Strategies
16.10. LexisNexis
16.10.1. Company
Details
16.10.2. Company
Overview
16.10.3. Product
Offerings
16.10.4. Key
Developments
16.10.5. Financial
Analysis
16.10.6. SWOT
Analysis
16.10.7. Business
Strategies
16.11. Liberty
Mutual Insurance
16.11.1. Company
Details
16.11.2. Company
Overview
16.11.3. Product
Offerings
16.11.4. Key
Developments
16.11.5. Financial
Analysis
16.11.6. SWOT
Analysis
16.11.7. Business
Strategies
16.12. Oracle
Corporation
16.12.1. Company
Details
16.12.2. Company
Overview
16.12.3. Product
Offerings
16.12.4. Key Developments
16.12.5. Financial
Analysis
16.12.6. SWOT
Analysis
16.12.7. Business
Strategies
16.13. Oscar
Insurance Corporation
16.13.1. Company
Details
16.13.2. Company
Overview
16.13.3. Product
Offerings
16.13.4. Key
Developments
16.13.5. Financial
Analysis
16.13.6. SWOT
Analysis
16.13.7. Business
Strategies
16.14. Progressive
Casualty Insurance Company, Inc.
16.14.1. Company
Details
16.14.2. Company
Overview
16.14.3. Product
Offerings
16.14.4. Key
Developments
16.14.5. Financial
Analysis
16.14.6. SWOT
Analysis
16.14.7. Business
Strategies
16.15. SAP SE
16.15.1. Company
Details
16.15.2. Company
Overview
16.15.3. Product
Offerings
16.15.4. Key
Developments
16.15.5. Financial
Analysis
16.15.6. SWOT
Analysis
16.15.7. Business
Strategies
16.16. State
Farm.
16.16.1. Company
Details
16.16.2. Company
Overview
16.16.3. Product
Offerings
16.16.4. Key
Developments
16.16.5. Financial
Analysis
16.16.6. SWOT
Analysis
16.16.7. Business
Strategies
16.17. Other
Market Participants
17. Key
Findings
Note: This ToC is tentative
and can be changed according to the research study conducted during the course
of report completion.
**Exclusive for Multi-User and
Enterprise User.
At Absolute Markets Insights, we are engaged in building both global as well as country specific reports. As a result, the approach taken for deriving the estimation and forecast for a specific country is a bit unique and different in comparison to the global research studies. In this case, we not only study the concerned market factors & trends prevailing in a particular country (from secondary research) but we also tend to calculate the actual market size & forecast from the revenue generated from the market participants involved in manufacturing or distributing the any concerned product. These companies can also be service providers. For analyzing any country specifically, we do consider the growth factors prevailing under the states/cities/county for the same. For instance, if we are analyzing an industry specific to United States, we primarily need to study about the states present under the same(where the product/service has the highest growth). Similar analysis will be followed by other countries. Our scope of the report changes with different markets.
Our research study is mainly implement through a mix of both secondary and primary research. Various sources such as industry magazines, trade journals, and government websites and trade associations are reviewed for gathering precise data. Primary interviews are conducted to validate the market size derived from secondary research. Industry experts, major manufacturers and distributors are contacted for further validation purpose on the current market penetration and growth trends.
Prominent participants in our primary research process include:
- Key Opinion Leaders namely the CEOs, CSOs, VPs, purchasing managers, amongst others
- Research and development participants, distributors/suppliers and subject matter experts
Secondary Research includes data extracted from paid data sources:
- Reuters
- Factiva
- Bloomberg
- One Source
- Hoovers
Research Methodology

Key Inclusions


