
Kids Tablet Market By Connectivity (Wi-Fi Enabled, Sim Enabled),By RAM Size (Less than 1 GB, 1 GB and Above), By End-User (Less than 5 Years,5 to 10 Years,10 to 16 years), By Region (U.S., Canada, Mexico, France, UK, Germany, Spain, Italy, Nordic Countries, Benelux Union, Rest of Europe, China, Japan, India, New Zealand, Australia, South Korea, Southeast Asia, Rest of Asia Pacific, Saudi Arabia, UAE, Egypt, Kuwait, South Africa, Rest of MEA, Brazil, Argentina, Rest of Latin America) – Global Insights, Growth, Size, Comparative Analysis, Trends and Forecast, 2019 – 2027
Industry Trends
Global Kids Tablet market was valued at US$ 9.54 billion in 2018 and is expected to reach US$ 36.89 billion by 2027, growing at an estimated CAGR of 16.2% over the forecast period. Increased use of educational and gaming apps will boost the global kids tablet market. It has been reported that 70% of families who have children under age 12 stated that their kids use tablets, where 77% use for gaming purpose and 57% use it for education purpose. Low cost, portability, ease of learning are the primary factors why parents prefer to purchase tablets for their kids. By end user, children within age group (10 years-16 years) accounted for 52% of revenue share in 2018 and is expected to register a CAGR of 16% from 2019 to 2027.
Another important factor driving the global kids tablet market is the level of internet penetration. Almost every household has internet connectivity, due to which one can access to e-books, interactive apps, games etc., hence the demand for Wi-Fi enabled tablets is on the rise. By connectivity, Wi-Fi enabled tablets accounted for 72% of revenue share in 2018 and is expected to register a CAGR of 16.2% by 2027.
The American academy of pediatrics has warned that extensive use of tablets might impact the mental health of the child. This could be a factor for slowdown of the kids tablet market. However, companies such as Lenovo, SAMSUNG are providing tablets which are safe and can be used by kids. Such devices also includes camera and timer. Increasing demand for digital literacy will duly assist the market growth of countries such as India, China, Mexico, and South Africa.
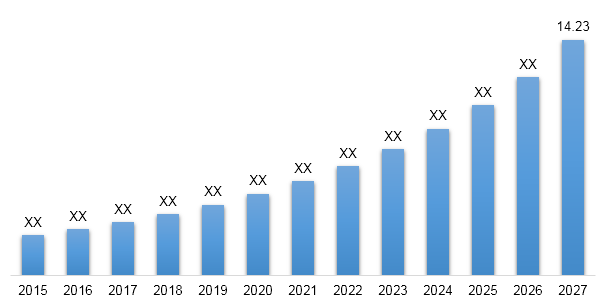
North America kids tablet market held the largest market share in 2018, due to increased use of tablets for educational purposes by children within the age group of 10 years to 16 years. However, due to increase in internet penetration and use of learning apps, the markets in emerging countries such as India and China are projected to grow at a higher rate and hence the Asia Pacific region is projected to exhibit the highest growth rate during the forecast period.
North America Kids Tablet Market Revenue & Forecast, (US$ Billion), 2015 – 2027
Competitive Landscape
The report provides both, qualitative and quantitative research of Kids Tablet market, as well as provides comprehensive insights and favored development methods adopted by the key contenders. The report also offers extensive research on the key players in this market and details on the competitiveness of these players. Key business strategies such as mergers and acquisitions (M&A), affiliations, collaborations, and contracts adopted by these major market participants are also recognized and analyzed in the report. For each company, the report studies their global presence, competitors, service offerings, specification, pricing, and gross margin.
Some of the players operating in the kids tablet market are Lenovo Group Limited, Amazon.com, Inc., SAMSUNG, LeapFrog Enterprises, Inc., Apple Inc. Zee Learn Ltd. ASUSTeK Computer, Inc. Micromax Informatics Limited, Sungworld, CONTIXO, dragontouch.com, Mattel, Kurio & KD Interactive, ConveGenius amongst others.

Global Kids Tablet Market:
- By Connectivity
- Wi-FI Enabled
- Sim Enabled
- By RAM Size
- Less than 1 GB
- 1 GB and Above
- By End User
- Less than 5 Years
- (5 to 10) Years
- (10 to 16) Years
- By Geography
- North America
- U.S.
- Canada
- Mexico
- Europe
- France
- The UK
- Spain
- Germany
- Italy
- Nordic Countries
- Denmark
- Finland
- Iceland
- Norway
- Sweden
- Benelux Union
- Belgium
- The Netherlands
- Luxemburg
- Rest of Europe
- Asia Pacific
- China
- Japan
- India
- New Zealand
- Australia
- South Korea
- Southeast Asia
- Indonesia
- Thailand
- Malaysia
- Singapore
- Rest of Southeast Asia
- Rest of Asia Pacific
- Middle East & Africa
- Saudi Arabia
- UAE
- Egypt
- Kuwait
- South Africa
- Rest of Middle East & Africa
- Latin America
- Brazil
- Argentina
- Rest of Latin America
- North America
Table of Contents
![]()
1. Market
Scope
1.1. Market
Segmentation
1.2. Years
Considered
1.2.1. Historic
Years: 2015 - 2017
1.2.2. Base
Year: 2018
1.2.3. Forecast
Years: 2019 – 2027
2. Key Target
Audiences
3. Research
Methodology
3.1. Primary
Research
3.1.1. Research
Questionnaire
3.1.2. Global
Percentage Breakdown
3.1.3. Primary
Interviews: Key Opinion Leaders (KOLs)
3.2. Secondary
Research
3.2.1. Paid
Databases
3.2.2. Secondary
Sources
3.3. Market
Size Estimates
3.3.1. Top-Down
Approach
3.3.2. Bottom-Up
Approach
3.4. Data
Triangulation Methodology
3.5. Research
Assumptions
4. Recommendations
and Insights from AMI’s Perspective**
5. Holistic
Overview of Kids Tablet Market
6. Market
Synopsis: Kids Tablet Market
7. Kids Tablet
Market Analysis: Qualitative Perspective
7.1. Introduction
7.1.1. Product
Definition
7.1.2. Industry
Development
7.2. Market
Dynamics
7.2.1. Drivers
7.2.2. Restraints
7.2.3. Opportunities
7.3. Trends in Kids
Tablet Market
7.4. Market
Determinants Radar Chart
7.5. Macro-Economic
and Micro-Economic Indicators: Kids Tablet Market
7.6. Porter’s
Five Force Analysis
8. Global Kids
Tablet Market Analysis and Forecasts, 2019 – 2027
8.1. Overview
8.1.1. Global
Kids Tablet Market Revenue (US$ Mn)
8.2. Global
Kids Tablet Market Revenue (US$ Mn) and Forecasts, By Connectivity
8.2.1. Wi-Fi
Enabled
8.2.1.1. Definition
8.2.1.2. Market
Estimation and Penetration, 2015 – 2018
8.2.1.3. Market
Forecast, 2019 – 2027
8.2.1.4. Compound
Annual Growth Rate (CAGR)
8.2.1.5. Regional
Bifurcation
8.2.1.5.1. North
America
8.2.1.5.1.1. Market
Estimation, 2015 – 2018
8.2.1.5.1.2. Market
Forecast, 2019 – 2027
8.2.1.5.2. Europe
8.2.1.5.2.1. Market
Estimation, 2015 – 2018
8.2.1.5.2.2. Market
Forecast, 2019 – 2027
8.2.1.5.3. Asia
Pacific
8.2.1.5.3.1. Market
Estimation, 2015 – 2018
8.2.1.5.3.2. Market
Forecast, 2019 – 2027
8.2.1.5.4. Middle
East and Africa
8.2.1.5.4.1. Market
Estimation, 2015 – 2018
8.2.1.5.4.2. Market
Forecast, 2019 – 2027
8.2.1.5.5. Latin
America
8.2.1.5.5.1. Market
Estimation, 2015 – 2018
8.2.1.5.5.2. Market
Forecast, 2019 – 2027
8.2.2. Sim
Enabled
8.2.2.1. Definition
8.2.2.2. Market
Estimation and Penetration, 2015 – 2018
8.2.2.3. Market
Forecast, 2019 – 2027
8.2.2.4. Compound
Annual Growth Rate (CAGR)
8.2.2.5. Regional
Bifurcation
8.2.2.5.1. North
America
8.2.2.5.1.1. Market
Estimation, 2015 – 2018
8.2.2.5.1.2. Market
Forecast, 2019 – 2027
8.2.2.5.2. Europe
8.2.2.5.2.1. Market
Estimation, 2015 – 2018
8.2.2.5.2.2. Market
Forecast, 2019 – 2027
8.2.2.5.3. Asia
Pacific
8.2.2.5.3.1. Market
Estimation, 2015 – 2018
8.2.2.5.3.2. Market
Forecast, 2019 – 2027
8.2.2.5.4. Middle
East and Africa
8.2.2.5.4.1. Market
Estimation, 2015 – 2018
8.2.2.5.4.2. Market
Forecast, 2019 – 2027
8.2.2.5.5. Latin
America
8.2.2.5.5.1. Market
Estimation, 2015 – 2018
8.2.2.5.5.2. Market
Forecast, 2019 – 2027
8.3. Key
Segment for Channeling Investments
8.3.1. By
Connectivity
9. Global Kids
Tablet Market Analysis and Forecasts, 2019 – 2027
9.1. Overview
9.2. Global
Kids Tablet Market Revenue (US$ Mn) and Forecasts, By RAM Size
9.2.1. Less
than 1 GB
9.2.1.1. Definition
9.2.1.2. Market
Estimation and Penetration, 2015 – 2018
9.2.1.3. Market
Forecast, 2019 – 2027
9.2.1.4. Compound
Annual Growth Rate (CAGR)
9.2.1.5. Regional
Bifurcation
9.2.1.5.1. North
America
9.2.1.5.1.1. Market
Estimation, 2015 – 2018
9.2.1.5.1.2. Market
Forecast, 2019 – 2027
9.2.1.5.2. Europe
9.2.1.5.2.1. Market
Estimation, 2015 – 2018
9.2.1.5.2.2. Market
Forecast, 2019 – 2027
9.2.1.5.3. Asia
Pacific
9.2.1.5.3.1. Market
Estimation, 2015 – 2018
9.2.1.5.3.2. Market
Forecast, 2019 – 2027
9.2.1.5.4. Middle
East and Africa
9.2.1.5.4.1. Market
Estimation, 2015 – 2018
9.2.1.5.4.2. Market
Forecast, 2019 – 2027
9.2.1.5.5. Latin
America
9.2.1.5.5.1. Market
Estimation, 2015 – 2018
9.2.1.5.5.2. Market
Forecast, 2019 – 2027
9.2.2. 1 GB and
Above
9.2.2.1. Definition
9.2.2.2. Market
Estimation and Penetration, 2015 – 2018
9.2.2.3. Market
Forecast, 2019 – 2027
9.2.2.4. Compound
Annual Growth Rate (CAGR)
9.2.2.5. Regional
Bifurcation
9.2.2.5.1. North
America
9.2.2.5.1.1. Market
Estimation, 2015 – 2018
9.2.2.5.1.2. Market
Forecast, 2019 – 2027
9.2.2.5.2. Europe
9.2.2.5.2.1. Market
Estimation, 2015 – 2018
9.2.2.5.2.2. Market
Forecast, 2019 – 2027
9.2.2.5.3. Asia
Pacific
9.2.2.5.3.1. Market
Estimation, 2015 – 2018
9.2.2.5.3.2. Market
Forecast, 2019 – 2027
9.2.2.5.4. Middle
East and Africa
9.2.2.5.4.1. Market
Estimation, 2015 – 2018
9.2.2.5.4.2. Market
Forecast, 2019 – 2027
9.2.2.5.5. Latin
America
9.2.2.5.5.1. Market
Estimation, 2015 – 2018
9.2.2.5.5.2. Market
Forecast, 2019 – 2027
9.3. Key
Segment for Channeling Investments
9.3.1. By RAM
Size
10. Global
Kids Tablet Market Analysis and Forecasts, 2019 – 2027
10.1. Overview
10.2. Global
Kids Tablet Market Revenue (US$ Mn) and Forecasts, By End User
10.2.1. Less
than 5 Years
10.2.1.1. Definition
10.2.1.2. Market
Estimation and Penetration, 2015 – 2018
10.2.1.3. Market
Forecast, 2019 – 2027
10.2.1.4. Compound
Annual Growth Rate (CAGR)
10.2.1.5. Regional
Bifurcation
10.2.1.5.1. North
America
10.2.1.5.1.1. Market
Estimation, 2015 – 2018
10.2.1.5.1.2. Market
Forecast, 2019 – 2027
10.2.1.5.2. Europe
10.2.1.5.2.1. Market
Estimation, 2015 – 2018
10.2.1.5.2.2. Market
Forecast, 2019 – 2027
10.2.1.5.3. Asia
Pacific
10.2.1.5.3.1. Market
Estimation, 2015 – 2018
10.2.1.5.3.2. Market
Forecast, 2019 – 2027
10.2.1.5.4. Middle
East and Africa
10.2.1.5.4.1. Market
Estimation, 2015 – 2018
10.2.1.5.4.2. Market
Forecast, 2019 – 2027
10.2.1.5.5. Latin
America
10.2.1.5.5.1. Market
Estimation, 2015 – 2018
10.2.1.5.5.2. Market
Forecast, 2019 – 2027
10.2.2. (5 to
10) Years
10.2.2.1. Definition
10.2.2.2. Market
Estimation and Penetration, 2015 – 2018
10.2.2.3. Market
Forecast, 2019 – 2027
10.2.2.4. Compound
Annual Growth Rate (CAGR)
10.2.2.5. Regional
Bifurcation
10.2.2.5.1. North
America
10.2.2.5.1.1. Market
Estimation, 2015 – 2018
10.2.2.5.1.2. Market
Forecast, 2019 – 2027
10.2.2.5.2. Europe
10.2.2.5.2.1. Market
Estimation, 2015 – 2018
10.2.2.5.2.2. Market
Forecast, 2019 – 2027
10.2.2.5.3. Asia
Pacific
10.2.2.5.3.1. Market
Estimation, 2015 – 2018
10.2.2.5.3.2. Market
Forecast, 2019 – 2027
10.2.2.5.4. Middle
East and Africa
10.2.2.5.4.1. Market
Estimation, 2015 – 2018
10.2.2.5.4.2. Market
Forecast, 2019 – 2027
10.2.2.5.5. Latin
America
10.2.2.5.5.1. Market
Estimation, 2015 – 2018
10.2.2.5.5.2. Market
Forecast, 2019 – 2027
10.2.3. (10 to
16) Years
10.2.3.1. Definition
10.2.3.2. Market
Estimation and Penetration, 2015 – 2018
10.2.3.3. Market
Forecast, 2019 – 2027
10.2.3.4. Compound
Annual Growth Rate (CAGR)
10.2.3.5. Regional
Bifurcation
10.2.3.5.1. North
America
10.2.3.5.1.1. Market
Estimation, 2015 – 2018
10.2.3.5.1.2. Market
Forecast, 2019 – 2027
10.2.3.5.2. Europe
10.2.3.5.2.1. Market
Estimation, 2015 – 2018
10.2.3.5.2.2. Market
Forecast, 2019 – 2027
10.2.3.5.3. Asia
Pacific
10.2.3.5.3.1. Market
Estimation, 2015 – 2018
10.2.3.5.3.2. Market
Forecast, 2019 – 2027
10.2.3.5.4. Middle
East and Africa
10.2.3.5.4.1. Market
Estimation, 2015 – 2018
10.2.3.5.4.2. Market
Forecast, 2019 – 2027
10.2.3.5.5. Latin
America
10.2.3.5.5.1. Market
Estimation, 2015 – 2018
10.2.3.5.5.2. Market
Forecast, 2019 – 2027
10.3. Key
Segment for Channeling Investments
10.3.1. By End
User
11. North
America Kids Tablet Market Analysis and Forecasts, 2019 - 2027
11.1. Overview
11.1.1. North
America Kids Tablet Market Revenue (US$ Mn)
11.2. North
America Kids Tablet Market Revenue (US$ Mn) and Forecasts, By Connectivity
11.2.1. Wi-Fi
Enabled
11.2.2. Sim
Enabled
11.3. North
America Kids Tablet Market Revenue (US$ Mn) and Forecasts, By RAM Size
11.3.1. Less
than 1 GB
11.3.2. 1 GB
and Above
11.4. North
America Kids Tablet Market Revenue (US$ Mn) and Forecasts, By End User
11.4.1. Less
than 5 Years
11.4.2. (5 to
10) Years
11.4.3. (10 to
16) Years
11.5. North
America Kids Tablet Market Revenue (US$ Mn) and Forecasts, By Country
11.5.1. U.S
11.5.1.1. U.S
Kids Tablet Market Revenue (US$ Mn) and Forecasts, By Connectivity
11.5.1.1.1. Wi-Fi
Enabled
11.5.1.1.2. Sim
Enabled
11.5.1.2. U.S
Kids Tablet Market Revenue (US$ Mn) and Forecasts, By RAM Size
11.5.1.2.1. Less
than 1 GB
11.5.1.2.2. 1
GB and Above
11.5.1.3. U.S
Kids Tablet Market Revenue (US$ Mn) and Forecasts, By End User
11.5.1.3.1. Less
than 5 Years
11.5.1.3.2. (5
to 10) Years
11.5.1.3.3. (10
to 16) Years
11.5.2. Canada
11.5.2.1. Canada
Kids Tablet Market Revenue (US$ Mn) and Forecasts, By Connectivity
11.5.2.1.1. Wi-Fi
Enabled
11.5.2.1.2. Sim
Enabled
11.5.2.2. Canada
Kids Tablet Market Revenue (US$ Mn) and Forecasts, By RAM Size
11.5.2.2.1. Less
than 1 GB
11.5.2.2.2. 1
GB and Above
11.5.2.3. Canada
Kids Tablet Market Revenue (US$ Mn) and Forecasts, By End User
11.5.2.3.1. Less
than 5 Years
11.5.2.3.2. (5
to 10) Years
11.5.2.3.3. (10
to 16) Years
11.5.3. Mexico
11.5.3.1. Mexico
Kids Tablet Market Revenue (US$ Mn) and Forecasts, By Connectivity
11.5.3.1.1. Wi-Fi
Enabled
11.5.3.1.2. Sim
Enabled
11.5.3.2. Mexico
Kids Tablet Market Revenue (US$ Mn) and Forecasts, By RAM Size
11.5.3.2.1. Less
than 1 GB
11.5.3.2.2. 1
GB and Above
11.5.3.3. Mexico
Kids Tablet Market Revenue (US$ Mn) and Forecasts, By End User
11.5.3.3.1. Less
than 5 Years
11.5.3.3.2. (5
to 10) Years
11.5.3.3.3. (10
to 16) Years
11.5.4. Rest of
North America
11.5.4.1. Rest
of North America Kids Tablet Market Revenue (US$ Mn) and Forecasts, By
Connectivity
11.5.4.1.1. Wi-Fi
Enabled
11.5.4.1.2. Sim
Enabled
11.5.4.2. Rest
of North America Kids Tablet Market Revenue (US$ Mn) and Forecasts, By RAM Size
11.5.4.2.1. Less
than 1 GB
11.5.4.2.2. 1
GB and Above
11.5.4.3. Rest
of North America Kids Tablet Market Revenue (US$ Mn) and Forecasts, By End User
11.5.4.3.1. Less
than 5 Years
11.5.4.3.2. (5
to 10) Years
11.5.4.3.3. (10
to 16) Years
11.6. Key
Segment for Channeling Investments
11.6.1. By
Country
11.6.2. By
Connectivity
11.6.3. By RAM
Size
11.6.4. By End
User
12. Europe
Kids Tablet Market Analysis and Forecasts, 2019 - 2027
12.1. Overview
12.1.1. Europe
Kids Tablet Market Revenue (US$ Mn)
12.2. Europe
Kids Tablet Market Revenue (US$ Mn) and Forecasts, By Connectivity
12.2.1. Wi-Fi
Enabled
12.2.2. Sim
Enabled
12.3. Europe
Kids Tablet Market Revenue (US$ Mn) and Forecasts, By RAM Size
12.3.1. Less
than 1 GB
12.3.2. 1 GB
and Above
12.4. Europe
Kids Tablet Market Revenue (US$ Mn) and Forecasts, By End User
12.4.1. Less
than 5 Years
12.4.2. (5 to
10) Years
12.4.3. (10 to
16) Years
12.5. Europe
Kids Tablet Market Revenue (US$ Mn) and Forecasts, By Country
12.5.1. France
12.5.1.1. France
Kids Tablet Market Revenue (US$ Mn) and Forecasts, By Connectivity
12.5.1.1.1. Wi-Fi
Enabled
12.5.1.1.2. Sim
Enabled
12.5.1.2. France
Kids Tablet Market Revenue (US$ Mn) and Forecasts, By RAM Size
12.5.1.2.1. Less
than 1 GB
12.5.1.2.2. 1
GB and Above
12.5.1.3. France
Kids Tablet Market Revenue (US$ Mn) and Forecasts, By End User
12.5.1.3.1. Less
than 5 Years
12.5.1.3.2. (5
to 10) Years
12.5.1.3.3. (10
to 16) Years
12.5.2. The UK
12.5.2.1. The
UK Kids Tablet Market Revenue (US$ Mn) and Forecasts, By Connectivity
12.5.2.1.1. Wi-Fi
Enabled
12.5.2.1.2. Sim
Enabled
12.5.2.2. The
UK Kids Tablet Market Revenue (US$ Mn) and Forecasts, By RAM Size
12.5.2.2.1. Less
than 1 GB
12.5.2.2.2. 1 GB
and Above
12.5.2.3. The
UK Kids Tablet Market Revenue (US$ Mn) and Forecasts, By End User
12.5.2.3.1. Less
than 5 Years
12.5.2.3.2. (5
to 10) Years
12.5.2.3.3. (10
to 16) Years
12.5.3. Spain
12.5.3.1. Spain
Kids Tablet Market Revenue (US$ Mn) and Forecasts, By Connectivity
12.5.3.1.1. Wi-Fi
Enabled
12.5.3.1.2. Sim
Enabled
12.5.3.2. Spain
Kids Tablet Market Revenue (US$ Mn) and Forecasts, By RAM Size
12.5.3.2.1. Less
than 1 GB
12.5.3.2.2. 1
GB and Above
12.5.3.3. Spain
Kids Tablet Market Revenue (US$ Mn) and Forecasts, By End User
12.5.3.3.1. Less
than 5 Years
12.5.3.3.2. (5
to 10) Years
12.5.3.3.3. (10
to 16) Years
12.5.4. Germany
12.5.4.1. Germany
Kids Tablet Market Revenue (US$ Mn) and Forecasts, By Connectivity
12.5.4.1.1. Wi-Fi
Enabled
12.5.4.1.2. Sim
Enabled
12.5.4.2. Germany
Kids Tablet Market Revenue (US$ Mn) and Forecasts, By RAM Size
12.5.4.2.1. Less
than 1 GB
12.5.4.2.2. 1
GB and Above
12.5.4.3. Germany
Kids Tablet Market Revenue (US$ Mn) and Forecasts, By End User
12.5.4.3.1. Less
than 5 Years
12.5.4.3.2. (5 to
10) Years
12.5.4.3.3. (10
to 16) Years
12.5.5. Italy
12.5.5.1. Italy
Kids Tablet Market Revenue (US$ Mn) and Forecasts, By Connectivity
12.5.5.1.1. Wi-Fi
Enabled
12.5.5.1.2. Sim
Enabled
12.5.5.2. Italy
Kids Tablet Market Revenue (US$ Mn) and Forecasts, By RAM Size
12.5.5.2.1. Less
than 1 GB
12.5.5.2.2. 1
GB and Above
12.5.5.3. Italy
Kids Tablet Market Revenue (US$ Mn) and Forecasts, By End User
12.5.5.3.1. Less
than 5 Years
12.5.5.3.2. (5
to 10) Years
12.5.5.3.3. (10
to 16) Years
12.5.6. Nordic
Countries
12.5.6.1. Nordic
Countries Kids Tablet Market Revenue (US$ Mn) and Forecasts, By Connectivity
12.5.6.1.1. Wi-Fi
Enabled
12.5.6.1.2. Sim
Enabled
12.5.6.2. Nordic
Countries Kids Tablet Market Revenue (US$ Mn) and Forecasts, By RAM Size
12.5.6.2.1. Less
than 1 GB
12.5.6.2.2. 1
GB and Above
12.5.6.3. Nordic
Countries Kids Tablet Market Revenue (US$ Mn) and Forecasts, By End User
12.5.6.3.1. Less
than 5 Years
12.5.6.3.2. (5
to 10) Years
12.5.6.3.3. (10
to 16) Years
12.5.6.4. Nordic
Countries Kids Tablet Market Revenue (US$ Mn) and Forecasts, By Country
12.5.6.4.1. Denmark
12.5.6.4.2. Finland
12.5.6.4.3. Iceland
12.5.6.4.4. Sweden
12.5.6.4.5. Norway
12.5.7. Benelux
Union
12.5.7.1. Benelux
Union Kids Tablet Market Revenue (US$ Mn) and Forecasts, By Connectivity
12.5.7.1.1. Wi-Fi
Enabled
12.5.7.1.2. Sim
Enabled
12.5.7.2. Benelux
Union Kids Tablet Market Revenue (US$ Mn) and Forecasts, By RAM Size
12.5.7.2.1. Less
than 1 GB
12.5.7.2.2. 1
GB and Above
12.5.7.3. Benelux
Union Kids Tablet Market Revenue (US$ Mn) and Forecasts, By End User
12.5.7.3.1. Less
than 5 Years
12.5.7.3.2. (5
to 10) Years
12.5.7.3.3. (10
to 16) Years
12.5.7.4. Benelux
Union Kids Tablet Market Revenue (US$ Mn) and Forecasts, By Country
12.5.7.4.1. Belgium
12.5.7.4.2. The
Netherlands
12.5.7.4.3. Luxembourg
12.5.8. Rest of
Europe
12.5.8.1. Rest
of Europe Kids Tablet Market Revenue (US$ Mn) and Forecasts, By Connectivity
12.5.8.1.1. Wi-Fi
Enabled
12.5.8.1.2. Sim
Enabled
12.5.8.2. Rest
of Europe Kids Tablet Market Revenue (US$ Mn) and Forecasts, By RAM Size
12.5.8.2.1. Less
than 1 GB
12.5.8.2.2. 1
GB and Above
12.5.8.3. Rest
of Europe Kids Tablet Market Revenue (US$ Mn) and Forecasts, By End User
12.5.8.3.1. Less
than 5 Years
12.5.8.3.2. (5
to 10) Years
12.5.8.3.3. (10
to 16) Years
12.6. Key
Segment for Channeling Investments
12.6.1. By
Country
12.6.2. By
Connectivity
12.6.3. By RAM
Size
12.6.4. By End
User
13. Asia
Pacific Kids Tablet Market Analysis and Forecasts, 2019 - 2027
13.1. Overview
13.1.1. Asia
Pacific Kids Tablet Market Revenue (US$ Mn)
13.2. Asia
Pacific Kids Tablet Market Revenue (US$ Mn) and Forecasts, By Connectivity
13.2.1. Wi-Fi
Enabled
13.2.2. Sim
Enabled
13.3. Asia
Pacific Kids Tablet Market Revenue (US$ Mn) and Forecasts, By RAM Size
13.3.1. Less
than 1 GB
13.3.2. 1 GB
and Above
13.4. Asia
Pacific Kids Tablet Market Revenue (US$ Mn) and Forecasts, By End User
13.4.1. Less
than 5 Years
13.4.2. (5 to
10) Years
13.4.3. (10 to
16) Years
13.5. Asia
Pacific Kids Tablet Market Revenue (US$ Mn) and Forecasts, By Country
13.5.1. China
13.5.1.1. China
Kids Tablet Market Revenue (US$ Mn) and Forecasts, By Connectivity
13.5.1.1.1. Wi-Fi
Enabled
13.5.1.1.2. Sim
Enabled
13.5.1.2. China
Kids Tablet Market Revenue (US$ Mn) and Forecasts, By RAM Size
13.5.1.2.1. Less
than 1 GB
13.5.1.2.2. 1
GB and Above
13.5.1.3. China
Kids Tablet Market Revenue (US$ Mn) and Forecasts, By End User
13.5.1.3.1. Less
than 5 Years
13.5.1.3.2. (5
to 10) Years
13.5.1.3.3. (10
to 16) Years
13.5.2. Japan
13.5.2.1. Japan
Kids Tablet Market Revenue (US$ Mn) and Forecasts, By Connectivity
13.5.2.1.1. Wi-Fi
Enabled
13.5.2.1.2. Sim
Enabled
13.5.2.2. Japan
Kids Tablet Market Revenue (US$ Mn) and Forecasts, By RAM Size
13.5.2.2.1. Less
than 1 GB
13.5.2.2.2. 1
GB and Above
13.5.2.3. Japan
Kids Tablet Market Revenue (US$ Mn) and Forecasts, By End User
13.5.2.3.1. Less
than 5 Years
13.5.2.3.2. (5
to 10) Years
13.5.2.3.3. (10
to 16) Years
13.5.3. India
13.5.3.1. India
Kids Tablet Market Revenue (US$ Mn) and Forecasts, By Connectivity
13.5.3.1.1. Wi-Fi
Enabled
13.5.3.1.2. Sim
Enabled
13.5.3.2. India
Kids Tablet Market Revenue (US$ Mn) and Forecasts, By RAM Size
13.5.3.2.1. Less
than 1 GB
13.5.3.2.2. 1
GB and Above
13.5.3.3. India
Kids Tablet Market Revenue (US$ Mn) and Forecasts, By End User
13.5.3.3.1. Less
than 5 Years
13.5.3.3.2. (5
to 10) Years
13.5.3.3.3. (10
to 16) Years
13.5.4. New
Zealand
13.5.4.1. New
Zealand Kids Tablet Market Revenue (US$ Mn) and Forecasts, By Connectivity
13.5.4.1.1. Wi-Fi
Enabled
13.5.4.1.2. Sim
Enabled
13.5.4.2. New
Zealand Kids Tablet Market Revenue (US$ Mn) and Forecasts, By RAM Size
13.5.4.2.1. Less
than 1 GB
13.5.4.2.2. 1
GB and Above
13.5.4.3. New
Zealand Kids Tablet Market Revenue (US$ Mn) and Forecasts, By End User
13.5.4.3.1. Less
than 5 Years
13.5.4.3.2. (5
to 10) Years
13.5.4.3.3. (10
to 16) Years
13.5.5. Australia
13.5.5.1. Australia
Kids Tablet Market Revenue (US$ Mn) and Forecasts, By Connectivity
13.5.5.1.1. Wi-Fi
Enabled
13.5.5.1.2. Sim
Enabled
13.5.5.2. Australia
Kids Tablet Market Revenue (US$ Mn) and Forecasts, By RAM Size
13.5.5.2.1. Less
than 1 GB
13.5.5.2.2. 1
GB and Above
13.5.5.3. Australia
Kids Tablet Market Revenue (US$ Mn) and Forecasts, By End User
13.5.5.3.1. Less
than 5 Years
13.5.5.3.2. (5
to 10) Years
13.5.5.3.3. (10
to 16) Years
13.5.6. South
Korea
13.5.6.1. South
Korea Kids Tablet Market Revenue (US$ Mn) and Forecasts, By Connectivity
13.5.6.1.1. Wi-Fi
Enabled
13.5.6.1.2. Sim
Enabled
13.5.6.2. South
Korea Kids Tablet Market Revenue (US$ Mn) and Forecasts, By RAM Size
13.5.6.2.1. Less
than 1 GB
13.5.6.2.2. 1
GB and Above
13.5.6.3. South
Korea Kids Tablet Market Revenue (US$ Mn) and Forecasts, By End User
13.5.6.3.1. Less
than 5 Years
13.5.6.3.2. (5
to 10) Years
13.5.6.3.3. (10
to 16) Years
13.5.7. Southeast
Asia
13.5.7.1. Southeast
Asia Kids Tablet Market Revenue (US$ Mn) and Forecasts, By Connectivity
13.5.7.1.1. Wi-Fi
Enabled
13.5.7.1.2. Sim
Enabled
13.5.7.2. Southeast
Asia Kids Tablet Market Revenue (US$ Mn) and Forecasts, By RAM Size
13.5.7.2.1. Less
than 1 GB
13.5.7.2.2. 1
GB and Above
13.5.7.3. Southeast
Asia Kids Tablet Market Revenue (US$ Mn) and Forecasts, By End User
13.5.7.3.1. Less
than 5 Years
13.5.7.3.2. (5
to 10) Years
13.5.7.3.3. (10
to 16) Years
13.5.7.4. Southeast
Asia Kids Tablet Market Revenue (US$ Mn) and Forecasts, By Country
13.5.7.4.1. Indonesia
13.5.7.4.2. Thailand
13.5.7.4.3. Malaysia
13.5.7.4.4. Singapore
13.5.7.4.5. Rest
of Southeast Asia
13.5.8. Rest of
Asia Pacific
13.5.8.1. Rest
of Asia Pacific Kids Tablet Market Revenue (US$ Mn) and Forecasts, By
Connectivity
13.5.8.1.1. Wi-Fi
Enabled
13.5.8.1.2. Sim
Enabled
13.5.8.2. Rest
of Asia Pacific Kids Tablet Market Revenue (US$ Mn) and Forecasts, By RAM Size
13.5.8.2.1. Less
than 1 GB
13.5.8.2.2. 1
GB and Above
13.5.8.3. Rest
of Asia Pacific Kids Tablet Market Revenue (US$ Mn) and Forecasts, By End User
13.5.8.3.1. Less
than 5 Years
13.5.8.3.2. (5
to 10) Years
13.5.8.3.3. (10
to 16) Years
13.6. Key
Segment for Channeling Investments
13.6.1. By
Country
13.6.2. By
Connectivity
13.6.3. By RAM
Size
13.6.4. By End
User
14. Middle
East and Africa Kids Tablet Market Analysis and Forecasts, 2019 - 2027
14.1. Overview
14.1.1. Middle
East and Africa Kids Tablet Market Revenue (US$ Mn)
14.2. Middle
East and Africa Kids Tablet Market Revenue (US$ Mn) and Forecasts, By
Connectivity
14.2.1. Wi-Fi
Enabled
14.2.2. Sim
Enabled
14.3. Middle
East and Africa Kids Tablet Market Revenue (US$ Mn) and Forecasts, By RAM Size
14.3.1. Less
than 1 GB
14.3.2. 1 GB
and Above
14.4. Middle
East and Africa Kids Tablet Market Revenue (US$ Mn) and Forecasts, By End User
14.4.1. Less
than 5 Years
14.4.2. (5 to
10) Years
14.4.3. (10 to
16) Years
14.5. Middle
East and Africa Kids Tablet Market Revenue (US$ Mn) and Forecasts, By Country
14.5.1. Saudi
Arabia
14.5.1.1. Saudi
Arabia Kids Tablet Market Revenue (US$ Mn) and Forecasts, By Connectivity
14.5.1.1.1. Wi-Fi
Enabled
14.5.1.1.2. Sim
Enabled
14.5.1.2. Saudi
Arabia Kids Tablet Market Revenue (US$ Mn) and Forecasts, By RAM Size
14.5.1.2.1. Less
than 1 GB
14.5.1.2.2. 1
GB and Above
14.5.1.3. Saudi
Arabia Kids Tablet Market Revenue (US$ Mn) and Forecasts, By End User
14.5.1.3.1. Less
than 5 Years
14.5.1.3.2. (5
to 10) Years
14.5.1.3.3. (10
to 16) Years
14.5.2. UAE
14.5.2.1. UAE
Kids Tablet Market Revenue (US$ Mn) and Forecasts, By Connectivity
14.5.2.1.1. Wi-Fi
Enabled
14.5.2.1.2. Sim
Enabled
14.5.2.2. UAE
Kids Tablet Market Revenue (US$ Mn) and Forecasts, By RAM Size
14.5.2.2.1. Less
than 1 GB
14.5.2.2.2. 1
GB and Above
14.5.2.3. UAE
Kids Tablet Market Revenue (US$ Mn) and Forecasts, By End User
14.5.2.3.1. Less
than 5 Years
14.5.2.3.2. (5
to 10) Years
14.5.2.3.3. (10
to 16) Years
14.5.3. Egypt
14.5.3.1. Egypt
Kids Tablet Market Revenue (US$ Mn) and Forecasts, By Connectivity
14.5.3.1.1. Wi-Fi
Enabled
14.5.3.1.2. Sim
Enabled
14.5.3.2. Egypt
Kids Tablet Market Revenue (US$ Mn) and Forecasts, By RAM Size
14.5.3.2.1. Less
than 1 GB
14.5.3.2.2. 1
GB and Above
14.5.3.3. Egypt
Kids Tablet Market Revenue (US$ Mn) and Forecasts, By End User
14.5.3.3.1. Less
than 5 Years
14.5.3.3.2. (5
to 10) Years
14.5.3.3.3. (10
to 16) Years
14.5.4. Kuwait
14.5.4.1. Kuwait
Kids Tablet Market Revenue (US$ Mn) and Forecasts, By Connectivity
14.5.4.1.1. Wi-Fi
Enabled
14.5.4.1.2. Sim
Enabled
14.5.4.2. Kuwait
Kids Tablet Market Revenue (US$ Mn) and Forecasts, By RAM Size
14.5.4.2.1. Less
than 1 GB
14.5.4.2.2. 1
GB and Above
14.5.4.3. Kuwait
Kids Tablet Market Revenue (US$ Mn) and Forecasts, By End User
14.5.4.3.1. Less
than 5 Years
14.5.4.3.2. (5
to 10) Years
14.5.4.3.3. (10
to 16) Years
14.5.5. South
Africa
14.5.5.1. South
Africa Kids Tablet Market Revenue (US$ Mn) and Forecasts, By Connectivity
14.5.5.1.1. Wi-Fi
Enabled
14.5.5.1.2. Sim
Enabled
14.5.5.2. South
Africa Kids Tablet Market Revenue (US$ Mn) and Forecasts, By RAM Size
14.5.5.2.1. Less
than 1 GB
14.5.5.2.2. 1
GB and Above
14.5.5.3. South
Africa Kids Tablet Market Revenue (US$ Mn) and Forecasts, By End User
14.5.5.3.1. Less
than 5 Years
14.5.5.3.2. (5
to 10) Years
14.5.5.3.3. (10
to 16) Years
14.5.6. Rest of
Middle East & Africa
14.5.6.1. Rest
of Middle East & Africa Kids Tablet Market Revenue (US$ Mn) and Forecasts,
By Connectivity
14.5.6.1.1. Wi-Fi
Enabled
14.5.6.1.2. Sim
Enabled
14.5.6.2. Rest
of Middle East & Africa Kids Tablet Market Revenue (US$ Mn) and Forecasts,
By RAM Size
14.5.6.2.1. Less
than 1 GB
14.5.6.2.2. 1
GB and Above
14.5.6.3. Rest
of Middle East & Africa Kids Tablet Market Revenue (US$ Mn) and Forecasts,
By End User
14.5.6.3.1. Less
than 5 Years
14.5.6.3.2. (5
to 10) Years
14.5.6.3.3. (10
to 16) Years
14.6. Key
Segment for Channeling Investments
14.6.1. By
Country
14.6.2. By
Connectivity
14.6.3. By RAM
Size
14.6.4. By End
User
15. Latin
America Kids Tablet Market Analysis and Forecasts, 2019 - 2027
15.1. Overview
15.1.1. Latin
America Kids Tablet Market Revenue (US$ Mn)
15.2. Latin
America Kids Tablet Market Revenue (US$ Mn) and Forecasts, By Connectivity
15.2.1. Wi-Fi
Enabled
15.2.2. Sim
Enabled
15.3. Latin
America Kids Tablet Market Revenue (US$ Mn) and Forecasts, By RAM Size
15.3.1. Less than
1 GB
15.3.2. 1 GB
and Above
15.4. Latin
America Kids Tablet Market Revenue (US$ Mn) and Forecasts, By End User
15.4.1. Less
than 5 Years
15.4.2. (5 to
10) Years
15.4.3. (10 to
16) Years
15.5. Latin
America Kids Tablet Market Revenue (US$ Mn) and Forecasts, By Country
15.5.1. Brazil
15.5.1.1. Brazil
Kids Tablet Market Revenue (US$ Mn) and Forecasts, By Connectivity
15.5.1.1.1. Wi-Fi
Enabled
15.5.1.1.2. Sim
Enabled
15.5.1.2. Brazil
Kids Tablet Market Revenue (US$ Mn) and Forecasts, By RAM Size
15.5.1.2.1. Less
than 1 GB
15.5.1.2.2. 1
GB and Above
15.5.1.3. Brazil
Kids Tablet Market Revenue (US$ Mn) and Forecasts, By End User
15.5.1.3.1. Less
than 5 Years
15.5.1.3.2. (5
to 10) Years
15.5.1.3.3. (10
to 16) Years
15.5.2. Argentina
15.5.2.1. Argentina
Kids Tablet Market Revenue (US$ Mn) and Forecasts, By Connectivity
15.5.2.1.1. Wi-Fi
Enabled
15.5.2.1.2. Sim
Enabled
15.5.2.2. Argentina
Kids Tablet Market Revenue (US$ Mn) and Forecasts, By RAM Size
15.5.2.2.1. Less
than 1 GB
15.5.2.2.2. 1
GB and Above
15.5.2.3. Argentina
Kids Tablet Market Revenue (US$ Mn) and Forecasts, By End User
15.5.2.3.1. Less
than 5 Years
15.5.2.3.2. (5
to 10) Years
15.5.2.3.3. (10
to 16) Years
15.5.3. Rest of
Latin America
15.5.3.1. Rest
of Latin America Kids Tablet Market Revenue (US$ Mn) and Forecasts, By
Connectivity
15.5.3.1.1. Wi-Fi
Enabled
15.5.3.1.2. Sim
Enabled
15.5.3.2. Rest
of Latin America Kids Tablet Market Revenue (US$ Mn) and Forecasts, By RAM Size
15.5.3.2.1. Less
than 1 GB
15.5.3.2.2. 1
GB and Above
15.5.3.3. Rest
of Latin America Kids Tablet Market Revenue (US$ Mn) and Forecasts, By End User
15.5.3.3.1. Less
than 5 Years
15.5.3.3.2. (5
to 10) Years
15.5.3.3.3. (10
to 16) Years
15.6. Key
Segment for Channeling Investments
15.6.1. By
Country
15.6.2. By
Connectivity
15.6.3. By RAM
Size
15.6.4. By End
User
16. Competitive
Benchmarking
16.1. Market
Share Analysis, 2018
16.2. Global
Presence and Growth Strategies
16.2.1. Mergers
and Acquisitions
16.2.2. Product
Launches
16.2.3. Investments
Trends
16.2.4. R&D
Initiatives
17. Player
Profiles
17.1. Amazon.com,
Inc.
17.1.1. Company
Details
17.1.2. Company
Overview
17.1.3. Product
Offerings
17.1.4. Key
Developments
17.1.5. Financial
Analysis
17.1.6. SWOT
Analysis
17.1.7. Business
Strategies
17.2. Apple
Inc.
17.2.1. Company
Details
17.2.2. Company
Overview
17.2.3. Product
Offerings
17.2.4. Key Developments
17.2.5. Financial
Analysis
17.2.6. SWOT
Analysis
17.2.7. Business
Strategies
17.3. ASUSTeK
Computer Inc.
17.3.1. Company
Details
17.3.2. Company
Overview
17.3.3. Product
Offerings
17.3.4. Key
Developments
17.3.5. Financial
Analysis
17.3.6. SWOT
Analysis
17.3.7. Business
Strategies
17.4. CONTIXO
17.4.1. Company
Details
17.4.2. Company
Overview
17.4.3. Product
Offerings
17.4.4. Key
Developments
17.4.5. Financial
Analysis
17.4.6. SWOT
Analysis
17.4.7. Business
Strategies
17.5. ConveGeniusGlobal.com
17.5.1. Company
Details
17.5.2. Company
Overview
17.5.3. Product
Offerings
17.5.4. Key
Developments
17.5.5. Financial
Analysis
17.5.6. SWOT
Analysis
17.5.7. Business
Strategies
17.6. dragontouch.com.
17.6.1. Company
Details
17.6.2. Company
Overview
17.6.3. Product
Offerings
17.6.4. Key
Developments
17.6.5. Financial
Analysis
17.6.6. SWOT
Analysis
17.6.7. Business
Strategies
17.7. Kurio
& KD Interactive
17.7.1. Company
Details
17.7.2. Company
Overview
17.7.3. Product
Offerings
17.7.4. Key
Developments
17.7.5. Financial
Analysis
17.7.6. SWOT
Analysis
17.7.7. Business
Strategies
17.8. LeapFrog
Enterprises, Inc.
17.8.1. Company
Details
17.8.2. Company
Overview
17.8.3. Product
Offerings
17.8.4. Key
Developments
17.8.5. Financial
Analysis
17.8.6. SWOT
Analysis
17.8.7. Business
Strategies
17.9. Lenovo
17.9.1. Company
Details
17.9.2. Company
Overview
17.9.3. Product
Offerings
17.9.4. Key
Developments
17.9.5. Financial
Analysis
17.9.6. SWOT
Analysis
17.9.7. Business
Strategies
17.10. Mattel
17.10.1. Company
Details
17.10.2. Company
Overview
17.10.3. Product
Offerings
17.10.4. Key
Developments
17.10.5. Financial
Analysis
17.10.6. SWOT
Analysis
17.10.7. Business
Strategies
17.11. Metis
17.11.1. Company
Details
17.11.2. Company
Overview
17.11.3. Product
Offerings
17.11.4. Key
Developments
17.11.5. Financial
Analysis
17.11.6. SWOT
Analysis
17.11.7. Business
Strategies
17.12. Micromax
17.12.1. Company
Details
17.12.2. Company
Overview
17.12.3. Product
Offerings
17.12.4. Key
Developments
17.12.5. Financial
Analysis
17.12.6. SWOT
Analysis
17.12.7. Business
Strategies
17.13. SAMSUNG
17.13.1. Company
Details
17.13.2. Company
Overview
17.13.3. Product
Offerings
17.13.4. Key
Developments
17.13.5. Financial
Analysis
17.13.6. SWOT
Analysis
17.13.7. Business Strategies
17.14. Sungworld
17.14.1. Company
Details
17.14.2. Company
Overview
17.14.3. Product
Offerings
17.14.4. Key
Developments
17.14.5. Financial
Analysis
17.14.6. SWOT
Analysis
17.14.7. Business
Strategies
17.15. Zee
Learn Ltd.
17.15.1. Company
Details
17.15.2. Company
Overview
17.15.3. Product
Offerings
17.15.4. Key
Developments
17.15.5. Financial
Analysis
17.15.6. SWOT
Analysis
17.15.7. Business
Strategies
17.16. Other
Market Participants
18. Key
Findings
Note: This ToC is tentative
and can be changed according to the research study conducted during the course
of report completion.
**Exclusive for Multi-User and
Enterprise User.
At Absolute Markets Insights, we are engaged in building both global as well as country specific reports. As a result, the approach taken for deriving the estimation and forecast for a specific country is a bit unique and different in comparison to the global research studies. In this case, we not only study the concerned market factors & trends prevailing in a particular country (from secondary research) but we also tend to calculate the actual market size & forecast from the revenue generated from the market participants involved in manufacturing or distributing the any concerned product. These companies can also be service providers. For analyzing any country specifically, we do consider the growth factors prevailing under the states/cities/county for the same. For instance, if we are analyzing an industry specific to United States, we primarily need to study about the states present under the same(where the product/service has the highest growth). Similar analysis will be followed by other countries. Our scope of the report changes with different markets.
Our research study is mainly implement through a mix of both secondary and primary research. Various sources such as industry magazines, trade journals, and government websites and trade associations are reviewed for gathering precise data. Primary interviews are conducted to validate the market size derived from secondary research. Industry experts, major manufacturers and distributors are contacted for further validation purpose on the current market penetration and growth trends.
Prominent participants in our primary research process include:
- Key Opinion Leaders namely the CEOs, CSOs, VPs, purchasing managers, amongst others
- Research and development participants, distributors/suppliers and subject matter experts
Secondary Research includes data extracted from paid data sources:
- Reuters
- Factiva
- Bloomberg
- One Source
- Hoovers
Research Methodology

Key Inclusions


