
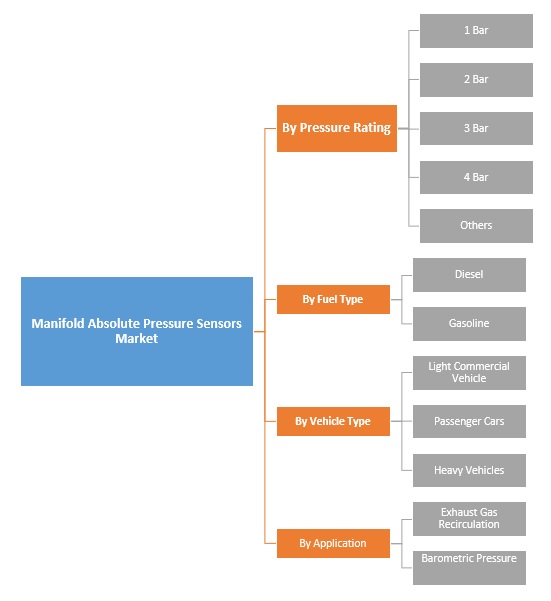
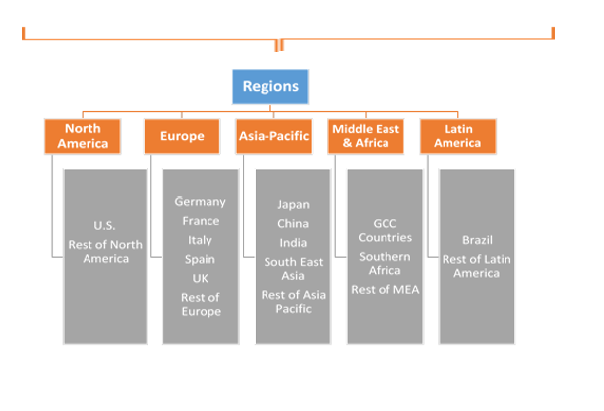
Manifold Absolute Pressure Sensors Market by Pressure Rating (1 Bar, 2 Bar, 3 Bar, 4 Bar and others); by Fuel Type (Diesel and Gasoline); by Vehicle Type (Light Commercial Vehicle, Passenger Cars and Heavy Vehicles); by Applications (Exhaust Gas Recirculation and Barometric Pressure); by Regional Outlook (U.S., Rest of North America, France, UK, Germany, Spain, Italy, Rest of Europe, China, Japan, India, Southeast Asia, Rest of Asia Pacific, GCC Countries, Southern Africa, Rest of MEA, Brazil, Rest of Latin America) – Global Insights, Growth, Size, Comparative Analysis, Trends and Forecast, 2018 - 2026’
Industry Trends
Manifold absolute pressure (MAP) sensor is one of the sensors that are utilized in an internal ignition engines electronic management system. These sensors perform two major tasks in the engine control system, which include measurement of barometric pressure at key on and reporting motor load to the powertrain control module. The powertrain module makes use of information for proper fuel/air mixture control under all operating altitude conditions and load. The global manifold absolute pressure sensors market, in terms of revenue, was valued at US$ 389.5 Mn in 2017 and is expected to reach US$ 559.8 Mn by 2022.
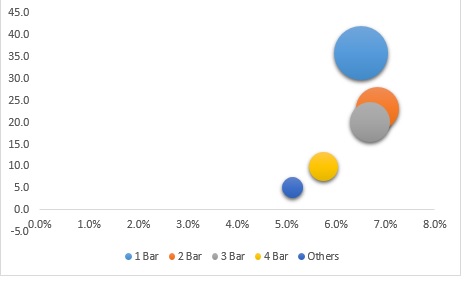
Global Manifold Absolute Pressure Sensors Market (USD Million), By Pressure Rating, 2018 - 2026
MAP sensors deliver instant manifold pressure evidence to the engines control unit (ECU). This data which is sent to the ECU is used to calculate air density and determine the engine’s air mass flow rate. This in turn regulates the essential fuel metering for optimum combustion and influence the retard or advance of ignition timing. Brand loyalty, changes in mobility, and technological advances are the major factors responsible for the growth of automotive industry worldwide. Growing automotive industry has therefore led to high demand for MAP sensors in the global market.
There are various issues related to MAP sensors such as excessive fuel consumption, lack of power and failed emission test. Furthermore, potential growth from emerging economies such as China, Brazil and India can provide substantial growth opportunity to this market.
Manifold Absolute Pressure Sensors Market, By Pressure Rating
1bar pressure rating accounted to hold the largest market share at present as these type of sensors reports barometric pressure times one, which is approximately 14.7 psi or 30in/Hg (inches of mercury). For instance, a typical three wire MAP sensor has 5 volts and ground to power the circuit. Additionally, this type of sensor is usually designed for an aspirated engine to read a negative pressure, or vacuum, at a typical barometric pressure. These are few of the major factors driving the growth of this segment.
Manifold Absolute Pressure Sensors Market, By Region
On the basis of geographical segmentation, Asia Pacific is expected to hold the largest market share owing to the growing demand for the automotive industry. Asia-Pacific is one of the leading markets for several industries which include automobiles, consumer goods and electronic devices, and healthcare among others. Moreover, Asia-Pacific region is one of the potential markets for the commercial and industrial verticals as countries such as India, China, and Australia among others are vigorously trying to strengthen the sensors platform.
Competitive Landscape
The manifold absolute pressure sensors market report provides both, subjective and quantitative research of the market, as well as integrates worthy insights into the rational scenario and favored development methods adopted by the key contenders. The report also offers extensive research on the key players in this market and detailed insights on the competitiveness of these players. The key business strategies such as M&A (Mergers & Acquisitions), affiliations, collaborations, and contracts adopted by the major players are also recognized and analyzed in the report. For each company, the report recognizes their corporate headquarter, competitors, product/service type, application and specification, pricing, and gross margin.
Some of the primary players of global manifold absolute pressure sensors market are Airtex Vehicle Electronics, Robert Bosch GmbH, Continental AG, Delphi Automotive LLP, Denso Corporation, ERA SPA, Facet Srl, Francisco Albero S.A.U., NXP Semiconductors, HELLA KGaA Hueck & Co., Infineon Technologies AG, Magneti Marelli S.p.A., Meat&Doria S.r.l., Mitsubishi Electric Corporation, Pierburg s.r.o., Siemens AG, Silicon Microstructures, Inc. and TE Connectivity Corporation amongst others.

Global Manifold Absolute Pressure Sensors Market Industry Background
1.
Introduction
1.1. Market Scope
1.2. Market Segmentation
1.3. Methodology
1.4. Assumptions
2.
Manifold Absolute Pressure
(MAP) Sensor Market Snapshot
3.
Executive Summary: Manifold
Absolute Pressure (MAP) Sensor Market
4.
Qualitative Analysis:
Manifold Absolute Pressure (MAP) Sensor Market
4.1. Introduction
4.1.1. Product Definition
4.1.2. Industry Development
4.2. Market Dynamics
4.2.1. Drivers
4.2.2. Restraints
4.2.3. Opportunities
4.3. Trends in Market
5.
Global Manifold Absolute
Pressure (MAP) Sensor Market Analysis and Forecasts, 2018 – 2026
5.1. Overview
5.1.1. Global Market Revenue (US$ Mn) and Forecasts
5.2. Global Manifold Absolute Pressure (MAP) Sensor Market Revenue
(US$ Mn) and Forecasts, By Pressure Rating
5.2.1. 1 Bar
5.2.1.1. Definition
5.2.1.2. Market Penetration
5.2.1.3. Market Revenue Expected to Increase by 2026
5.2.1.4. Compound Annual Growth Rate (CAGR)
5.2.2. 2 Bar
5.2.2.1. Definition
5.2.2.2. Market Penetration
5.2.2.3. Market Revenue Expected to Increase by 2026
5.2.2.4. Compound Annual Growth Rate (CAGR)
5.2.3. 3 Bar
5.2.3.1. Definition
5.2.3.2. Market Penetration
5.2.3.3. Market Revenue Expected to Increase by 2026
5.2.3.4. Compound Annual Growth Rate (CAGR)
5.2.4. 4 Bar
5.2.4.1. Definition
5.2.4.2. Market Penetration
5.2.4.3. Market Revenue Expected to Increase by 2026
5.2.4.4. Compound Annual Growth Rate (CAGR)
5.2.5. Others
5.3. Key Segment for Channeling Investments
5.3.1. By Pressure Rating
6.
Global Manifold Absolute
Pressure (MAP) Sensor Market Analysis and Forecasts, 2018 – 2026
6.1. Overview
6.2. Global Manifold Absolute Pressure (MAP) Sensor Market Revenue
(US$ Mn) and Forecasts, By Fuel Type
6.2.1. Diesel
6.2.1.1. Definition
6.2.1.2. Market Penetration
6.2.1.3. Market Revenue Expected to Increase by 2026
6.2.1.4. Compound Annual Growth Rate (CAGR)
6.2.2. Gasoline
6.2.2.1. Definition
6.2.2.2. Market Penetration
6.2.2.3. Market Revenue Expected to Increase by 2026
6.2.2.4. Compound Annual Growth Rate (CAGR)
6.3. Key Segment for Channeling Investments
6.3.1. By Fuel Type
7.
Global Manifold Absolute
Pressure (MAP) Sensor Market Analysis and Forecasts, 2018 – 2026
7.1. Overview
7.2. Global Manifold Absolute Pressure (MAP) Sensor Market Revenue
(US$ Mn) and Forecasts, By Vehicle Type
7.2.1. Light Commercial Vehicle
7.2.1.1. Definition
7.2.1.2. Market Penetration
7.2.1.3. Market Revenue Expected to Increase by 2026
7.2.1.4. Compound Annual Growth Rate (CAGR)
7.2.2. Passenger Cars
7.2.2.1. Definition
7.2.2.2. Market Penetration
7.2.2.3. Market Revenue Expected to Increase by 2026
7.2.2.4. Compound Annual Growth Rate (CAGR)
7.2.3. Heavy Vehicles
7.2.3.1. Definition
7.2.3.2. Market Penetration
7.2.3.3. Market Revenue Expected to Increase by 2026
7.2.3.4. Compound Annual Growth Rate (CAGR)
7.3. Key Segment for Channeling Investments
7.3.1. By Vehicle Type
8.
Global Manifold Absolute
Pressure (MAP) Sensor Market Analysis and Forecasts, 2018 – 2026
8.1. Overview
8.2. Global Manifold Absolute Pressure (MAP) Sensor Market Revenue
(US$ Mn) and Forecasts, By Application
8.2.1. Exhaust Gas Recirculation (EGR)
8.2.1.1. Definition
8.2.1.2. Market Penetration
8.2.1.3. Market Revenue Expected to Increase by 2026
8.2.1.4. Compound Annual Growth Rate (CAGR)
8.2.2. Barometric Pressure
8.2.2.1. Definition
8.2.2.2. Market Penetration
8.2.2.3. Market Revenue Expected to Increase by 2026
8.2.2.4. Compound Annual Growth Rate (CAGR)
8.3. Key Segment for Channeling Investments
8.3.1. By Application
9.
North America Manifold
Absolute Pressure (MAP) Sensor Market Analysis and Forecasts, 2018 – 2026
9.1. Overview
9.1.1. North America Market Revenue (US$ Mn)
9.2. North America Manifold Absolute Pressure (MAP) Sensor Market
Revenue (US$ Mn) and Forecasts, By Pressure Rating
9.2.1. 1 Bar
9.2.2. 2 Bar
9.2.3. 3 Bar
9.2.4. 4 Bar
9.2.5. Others
9.3. North America Market Revenue (US$ Mn) and Forecasts, By Fuel
Type
9.3.1. Diesel
9.3.2. Gasoline
9.4. North America Manifold Absolute Pressure (MAP) Sensor Market
Revenue (US$ Mn) and Forecasts, By Vehicle Type
9.4.1. Light Commercial Vehicle
9.4.2. Passenger Cars
9.4.3. Heavy Vehicles
9.5. North America Market Revenue (US$ Mn) and Forecasts, By
Application
9.5.1. Exhaust Gas Recirculation (EGR)
9.5.2. Barometric Pressure
9.6. North America Manifold Absolute Pressure (MAP) Sensor Market
Revenue (US$ Mn) and Forecasts, By Country
9.6.1. U.S.
9.6.1.1. U.S. Manifold Absolute Pressure (MAP) Sensor Market Revenue
(US$ Mn) and Forecasts, By Pressure Rating
9.6.1.1.1. 1 Bar
9.6.1.1.2. 2 Bar
9.6.1.1.3. 3 Bar
9.6.1.1.4. 4 Bar
9.6.1.1.5. Others
9.6.1.2. U.S. Market Revenue (US$ Mn) and Forecasts, By Fuel Type
9.6.1.2.1. Diesel
9.6.1.2.2. Gasoline
9.6.1.3. U.S. Manifold Absolute Pressure (MAP) Sensor Market Revenue
(US$ Mn) and Forecasts, By Vehicle Type
9.6.1.3.1. Light Commercial Vehicle
9.6.1.3.2. Passenger Cars
9.6.1.3.3. Heavy Vehicles
9.6.1.4. U.S. Market Revenue (US$ Mn) and Forecasts, By Application
9.6.1.4.1. Exhaust Gas Recirculation (EGR)
9.6.1.4.2. Barometric Pressure
9.6.2. Rest of North America
9.6.2.1. Rest of North America Manifold Absolute Pressure (MAP) Sensor
Market Revenue (US$ Mn) and Forecasts, By Pressure Rating
9.6.2.1.1. 1 Bar
9.6.2.1.2. 2 Bar
9.6.2.1.3. 3 Bar
9.6.2.1.4. 4 Bar
9.6.2.1.5. Others
9.6.2.2. Rest of North America Manifold Absolute Pressure (MAP) Sensor
Market Revenue (US$ Mn) and Forecasts, By Fuel Type
9.6.2.2.1. Diesel
9.6.2.2.2. Gasoline
9.6.2.3. Rest of North America Market Revenue (US$ Mn) and Forecasts,
By Vehicle Type
9.6.2.3.1. Light Commercial Vehicle
9.6.2.3.2. Passenger Cars
9.6.2.3.3. Heavy Vehicles
9.6.2.4. Rest of North America Manifold Absolute Pressure (MAP) Sensor
Market Revenue (US$ Mn) and Forecasts, By Application
9.6.2.4.1. Exhaust Gas Recirculation (EGR)
9.6.2.4.2. Barometric Pressure
9.7. Key Segment for Channeling Investments
9.7.1. By Country
9.7.2. By Pressure Rating
9.7.3. By Fuel Type
9.7.4. By Vehicle Type
9.7.5. By Application
10.
Europe Manifold Absolute
Pressure (MAP) Sensor Market Analysis and Forecasts, 2018 – 2026
10.1. Overview
10.1.1. Europe Market Revenue (US$ Mn)
10.2. Europe Manifold Absolute Pressure (MAP) Sensor Market Revenue
(US$ Mn) and Forecasts, By Pressure Rating
10.2.1. 1 Bar
10.2.2. 2 Bar
10.2.3. 3 Bar
10.2.4. 4 Bar
10.2.5. Others
10.3. Europe Market Revenue (US$ Mn) and Forecasts, By Fuel Type
10.3.1. Diesel
10.3.2. Gasoline
10.4. Europe Manifold Absolute Pressure (MAP) Sensor Market Revenue
(US$ Mn) and Forecasts, By Vehicle Type
10.4.1. Light Commercial Vehicle
10.4.2. Passenger Cars
10.4.3. Heavy Vehicles
10.5. Europe Manifold Absolute Pressure (MAP) Sensor Market Revenue
(US$ Mn) and Forecasts, By Application
10.5.1. Exhaust Gas Recirculation (EGR)
10.5.2. Barometric Pressure
10.6. Europe Market Revenue (US$ Mn) and Forecasts, By Country
10.6.1. France
10.6.1.1. France Manifold Absolute Pressure (MAP) Sensor Market Revenue
(US$ Mn) and Forecasts, By Pressure Rating
10.6.1.1.1. 1 Bar
10.6.1.1.2. 2 Bar
10.6.1.1.3. 3 Bar
10.6.1.1.4. 4 Bar
10.6.1.1.5. Others
10.6.1.2. France Market Revenue (US$ Mn) and Forecasts, By Fuel Type
10.6.1.2.1. Diesel
10.6.1.2.2. Gasoline
10.6.1.3. France Manifold Absolute Pressure (MAP) Sensor Market Revenue
(US$ Mn) and Forecasts, By Vehicle Type
10.6.1.3.1. Light Commercial Vehicle
10.6.1.3.2. Passenger Cars
10.6.1.3.3. Heavy Vehicles
10.6.1.4. France Market Revenue (US$ Mn) and Forecasts, By Application
10.6.1.4.1. Exhaust Gas Recirculation (EGR)
10.6.1.4.2. Barometric Pressure
10.6.2. The UK
10.6.2.1. The UK Manifold Absolute Pressure (MAP) Sensor Market Revenue
(US$ Mn) and Forecasts, By Pressure Rating
10.6.2.1.1. 1 Bar
10.6.2.1.2. 2 Bar
10.6.2.1.3. 3 Bar
10.6.2.1.4. 4 Bar
10.6.2.1.5. Others
10.6.2.2. The UK Manifold Absolute Pressure (MAP) Sensor Market Revenue
(US$ Mn) and Forecasts, By Fuel Type
10.6.2.2.1. Diesel
10.6.2.2.2. Gasoline
10.6.2.3. The UK Manifold Absolute Pressure (MAP) Sensor Market Revenue
(US$ Mn) and Forecasts, By Vehicle Type
10.6.2.3.1. Light Commercial Vehicle
10.6.2.3.2. Passenger Cars
10.6.2.3.3. Heavy Vehicles
10.6.2.4. The UK Market Revenue (US$ Mn) and Forecasts, By Application
10.6.2.4.1. Exhaust Gas Recirculation (EGR)
10.6.2.4.2. Barometric Pressure
10.6.3. Spain
10.6.3.1. Spain Manifold Absolute Pressure (MAP) Sensor Market Revenue
(US$ Mn) and Forecasts, By Pressure Rating
10.6.3.1.1. 1 Bar
10.6.3.1.2. 2 Bar
10.6.3.1.3. 3 Bar
10.6.3.1.4. 4 Bar
10.6.3.1.5. Others
10.6.3.2. Spain Market Revenue (US$ Mn) and Forecasts, By Fuel Type
10.6.3.2.1. Diesel
10.6.3.2.2. Gasoline
10.6.3.3. Spain Manifold Absolute Pressure (MAP) Sensor Market Revenue
(US$ Mn) and Forecasts, By Vehicle Type
10.6.3.3.1. Light Commercial Vehicle
10.6.3.3.2. Passenger Cars
10.6.3.3.3. Heavy Vehicles
10.6.3.4. Spain Market Revenue (US$ Mn) and Forecasts, By Application
10.6.3.4.1. Exhaust Gas Recirculation (EGR)
10.6.3.4.2. Barometric Pressure
10.6.4. Germany
10.6.4.1. Germany Manifold Absolute Pressure (MAP) Sensor Market Revenue
(US$ Mn) and Forecasts, By Pressure Rating
10.6.4.1.1. 1 Bar
10.6.4.1.2. 2 Bar
10.6.4.1.3. 3 Bar
10.6.4.1.4. 4 Bar
10.6.4.1.5. Others
10.6.4.2. Germany Manifold Absolute Pressure (MAP) Sensor Market Revenue
(US$ Mn) and Forecasts, By Fuel Type
10.6.4.2.1. Diesel
10.6.4.2.2. Gasoline
10.6.4.3. Germany Market Revenue (US$ Mn) and Forecasts, By Vehicle Type
10.6.4.3.1. Light Commercial Vehicle
10.6.4.3.2. Passenger Cars
10.6.4.3.3. Heavy Vehicles
10.6.4.4. Germany Manifold Absolute Pressure (MAP) Sensor Market Revenue
(US$ Mn) and Forecasts, By Application
10.6.4.4.1. Exhaust Gas Recirculation (EGR)
10.6.4.4.2. Barometric Pressure
10.6.5. Italy
10.6.5.1. Italy Manifold Absolute Pressure (MAP) Sensor Market Revenue
(US$ Mn) and Forecasts, By Pressure Rating
10.6.5.1.1. 1 Bar
10.6.5.1.2. 2 Bar
10.6.5.1.3. 3 Bar
10.6.5.1.4. 4 Bar
10.6.5.1.5. Others
10.6.5.2. Italy Market Revenue (US$ Mn) and Forecasts, By Fuel Type
10.6.5.2.1. Diesel
10.6.5.2.2. Gasoline
10.6.5.3. Italy Manifold Absolute Pressure (MAP) Sensor Market Revenue
(US$ Mn) and Forecasts, By Vehicle Type
10.6.5.3.1. Light Commercial Vehicle
10.6.5.3.2. Passenger Cars
10.6.5.3.3. Heavy Vehicles
10.6.5.4. Italy Market Revenue (US$ Mn) and Forecasts, By Application
10.6.5.4.1. Exhaust Gas Recirculation (EGR)
10.6.5.4.2. Barometric Pressure
10.6.6. Rest of Europe
10.6.6.1. Rest of Europe Manifold Absolute Pressure (MAP) Sensor Market
Revenue (US$ Mn) and Forecasts, By Pressure Rating
10.6.6.1.1. 1 Bar
10.6.6.1.2. 2 Bar
10.6.6.1.3. 3 Bar
10.6.6.1.4. 4 Bar
10.6.6.1.5. Others
10.6.6.2. Rest of Europe Manifold Absolute Pressure (MAP) Sensor Market
Revenue (US$ Mn) and Forecasts, By Fuel Type
10.6.6.2.1. Diesel
10.6.6.2.2. Gasoline
10.6.6.3. Rest of Europe Market Revenue (US$ Mn) and Forecasts, By
Vehicle Type
10.6.6.3.1. Light Commercial Vehicle
10.6.6.3.2. Passenger Cars
10.6.6.3.3. Heavy Vehicles
10.6.6.4. Rest of Europe Manifold Absolute Pressure (MAP) Sensor Market
Revenue (US$ Mn) and Forecasts, By Application
10.6.6.4.1. Exhaust Gas Recirculation (EGR)
10.6.6.4.2. Barometric Pressure
10.7. Key Segment for Channeling Investments
10.7.1. By Country
10.7.2. By Pressure Rating
10.7.3. By Fuel Type
10.7.4. By Vehicle Type
10.7.5. By Application
11.
Asia Pacific Manifold
Absolute Pressure (MAP) Sensor Market Analysis and Forecasts, 2018 – 2026
11.1. Overview
11.1.1. Asia Pacific Market Revenue (US$ Mn)
11.2. Asia Pacific Manifold Absolute Pressure (MAP) Sensor Market
Revenue (US$ Mn) and Forecasts, By Pressure Rating
11.2.1. 1 Bar
11.2.2. 2 Bar
11.2.3. 3 Bar
11.2.4. 4 Bar
11.2.5. Others
11.3. Asia Pacific Market Revenue (US$ Mn) and Forecasts, By Fuel
Type
11.3.1. Diesel
11.3.2. Gasoline
11.4. Asia Pacific Manifold Absolute Pressure (MAP) Sensor Market
Revenue (US$ Mn) and Forecasts, By Vehicle Type
11.4.1. Light Commercial Vehicle
11.4.2. Passenger Cars
11.4.3. Heavy Vehicles
11.5. Asia Pacific Manifold Absolute Pressure (MAP) Sensor Market
Revenue (US$ Mn) and Forecasts, By Application
11.5.1. Exhaust Gas Recirculation (EGR)
11.5.2. Barometric Pressure
11.6. Asia PacificMarket Revenue (US$ Mn) and Forecasts, By Country
11.6.1. China
11.6.1.1. China Manifold Absolute Pressure (MAP) Sensor Market Revenue
(US$ Mn) and Forecasts, By Pressure Rating
11.6.1.1.1. 1 Bar
11.6.1.1.2. 2 Bar
11.6.1.1.3. 3 Bar
11.6.1.1.4. 4 Bar
11.6.1.1.5. Others
11.6.1.2. China Market Revenue (US$ Mn) and Forecasts, By Fuel Type
11.6.1.2.1. Diesel
11.6.1.2.2. Gasoline
11.6.1.3. China Manifold Absolute Pressure (MAP) Sensor Market Revenue
(US$ Mn) and Forecasts, By Vehicle Type
11.6.1.3.1. Light Commercial Vehicle
11.6.1.3.2. Passenger Cars
11.6.1.3.3. Heavy Vehicles
11.6.1.4. China Market Revenue (US$ Mn) and Forecasts, By Application
11.6.1.4.1. Exhaust Gas Recirculation (EGR)
11.6.1.4.2. Barometric Pressure
11.6.2. Japan
11.6.2.1. Japan Manifold Absolute Pressure (MAP) Sensor Market Revenue
(US$ Mn) and Forecasts, By Pressure Rating
11.6.2.1.1. 1 Bar
11.6.2.1.2. 2 Bar
11.6.2.1.3. 3 Bar
11.6.2.1.4. 4 Bar
11.6.2.1.5. Others
11.6.2.2. Japan Market Revenue (US$ Mn) and Forecasts, By Fuel Type
11.6.2.2.1. Diesel
11.6.2.2.2. Gasoline
11.6.2.3. Japan Manifold Absolute Pressure (MAP) Sensor Market Revenue
(US$ Mn) and Forecasts, By Vehicle Type
11.6.2.3.1. Light Commercial Vehicle
11.6.2.3.2. Passenger Cars
11.6.2.3.3. Heavy Vehicles
11.6.2.4. Japan Market Revenue (US$ Mn) and Forecasts, By Application
11.6.2.4.1. Exhaust Gas Recirculation (EGR)
11.6.2.4.2. Barometric Pressure
11.6.3. India
11.6.3.1. India Manifold Absolute Pressure (MAP) Sensor Market Revenue
(US$ Mn) and Forecasts, By Pressure Rating
11.6.3.1.1. 1 Bar
11.6.3.1.2. 2 Bar
11.6.3.1.3. 3 Bar
11.6.3.1.4. 4 Bar
11.6.3.1.5. Others
11.6.3.2. India Market Revenue (US$ Mn) and Forecasts, By Fuel Type
11.6.3.2.1. Diesel
11.6.3.2.2. Gasoline
11.6.3.3. India Manifold Absolute Pressure (MAP) Sensor Market Revenue
(US$ Mn) and Forecasts, By Vehicle Type
11.6.3.3.1. Light Commercial Vehicle
11.6.3.3.2. Passenger Cars
11.6.3.3.3. Heavy Vehicles
11.6.3.4. India Market Revenue (US$ Mn) and Forecasts, By Application
11.6.3.4.1. Exhaust Gas Recirculation (EGR)
11.6.3.4.2. Barometric Pressure
11.6.4. Southeast Asia
11.6.4.1. Southeast Asia Manifold Absolute Pressure (MAP) Sensor Market Revenue
(US$ Mn) and Forecasts, By Pressure Rating
11.6.4.1.1. 1 Bar
11.6.4.1.2. 2 Bar
11.6.4.1.3. 3 Bar
11.6.4.1.4. 4 Bar
11.6.4.1.5. Others
11.6.4.2. Southeast Asia Market Revenue (US$ Mn) and Forecasts, By Fuel
Type
11.6.4.2.1. Diesel
11.6.4.2.2. Gasoline
11.6.4.3. Southeast Asia Manifold Absolute Pressure (MAP) Sensor Market
Revenue (US$ Mn) and Forecasts, By Vehicle Type
11.6.4.3.1. Light Commercial Vehicle
11.6.4.3.2. Passenger Cars
11.6.4.3.3. Heavy Vehicles
11.6.4.4. Southeast Asia Market Revenue (US$ Mn) and Forecasts, By
Application
11.6.4.4.1. Exhaust Gas Recirculation (EGR)
11.6.4.4.2. Barometric Pressure
11.6.5. Rest of Asia Pacific
11.6.5.1. Rest of Asia Pacific Manifold Absolute Pressure (MAP) Sensor
Market Revenue (US$ Mn) and Forecasts, By Pressure Rating
11.6.5.1.1. 1 Bar
11.6.5.1.2. 2 Bar
11.6.5.1.3. 3 Bar
11.6.5.1.4. 4 Bar
11.6.5.1.5. Others
11.6.5.2. Rest of Asia Pacific Market Revenue (US$ Mn) and Forecasts, By
Fuel Type
11.6.5.2.1. Diesel
11.6.5.2.2. Gasoline
11.6.5.3. Rest of Asia Pacific Manifold Absolute Pressure (MAP) Sensor
Market Revenue (US$ Mn) and Forecasts, By Vehicle Type
11.6.5.3.1. Light Commercial Vehicle
11.6.5.3.2. Passenger Cars
11.6.5.3.3. Heavy Vehicles
11.6.5.4. Rest of Asia Pacific Manifold Absolute Pressure (MAP) Sensor
Market Revenue (US$ Mn) and Forecasts, By Application
11.6.5.4.1. Exhaust Gas Recirculation (EGR)
11.6.5.4.2. Barometric Pressure
11.7. Key Segment for Channeling Investments
11.7.1. By Country
11.7.2. By Pressure Rating
11.7.3. By Fuel Type
11.7.4. By Vehicle Type
11.7.5. By Application
12.
Middle East and Africa
Manifold Absolute Pressure (MAP) Sensor Market Analysis and Forecasts, 2018 –
2026
12.1. Overview
12.1.1. Middle East and Africa Market Revenue (US$ Mn)
12.2. Middle East and Africa Manifold Absolute Pressure (MAP) Sensor
Market Revenue (US$ Mn) and Forecasts, By Pressure Rating
12.2.1. 1 Bar
12.2.2. 2 Bar
12.2.3. 3 Bar
12.2.4. 4 Bar
12.2.5. Others
12.3. Middle East and Africa Market Revenue (US$ Mn) and Forecasts,
By Fuel Type
12.3.1. Diesel
12.3.2. Gasoline
12.4. Middle East and Africa Manifold Absolute Pressure (MAP) Sensor
Market Revenue (US$ Mn) and Forecasts, By Vehicle Type
12.4.1. Light Commercial Vehicle
12.4.2. Passenger Cars
12.4.3. Heavy Vehicles
12.5. Middle East and Africa Market Revenue (US$ Mn) and Forecasts,
By Application
12.5.1. Exhaust Gas Recirculation (EGR)
12.5.2. Barometric Pressure
12.6. Middle East and Africa Manifold Absolute Pressure (MAP) Sensor
Market Revenue (US$ Mn) and Forecasts, By Country
12.6.1. GCC Countries
12.6.1.1. GCC Countries Manifold Absolute Pressure (MAP) Sensor Market
Revenue (US$ Mn) and Forecasts, By Pressure Rating
12.6.1.1.1. 1 Bar
12.6.1.1.2. 2 Bar
12.6.1.1.3. 3 Bar
12.6.1.1.4. 4 Bar
12.6.1.1.5. Others
12.6.1.2. GCC Countries Market Revenue (US$ Mn) and Forecasts, By Fuel
Type
12.6.1.2.1. Diesel
12.6.1.2.2. Gasoline
12.6.1.3. GCC Countries Manifold Absolute Pressure (MAP) Sensor Market
Revenue (US$ Mn) and Forecasts, By Vehicle Type
12.6.1.3.1. Light Commercial Vehicle
12.6.1.3.2. Passenger Cars
12.6.1.3.3. Heavy Vehicles
12.6.1.4. GCC Countries Market Revenue (US$ Mn) and Forecasts, By
Application
12.6.1.4.1. Exhaust Gas Recirculation (EGR)
12.6.1.4.2. Barometric Pressure
12.6.2. Southern Africa
12.6.2.1. Southern Africa Manifold Absolute Pressure (MAP) Sensor Market
Revenue (US$ Mn) and Forecasts, By Pressure Rating
12.6.2.1.1. 1 Bar
12.6.2.1.2. 2 Bar
12.6.2.1.3. 3 Bar
12.6.2.1.4. 4 Bar
12.6.2.1.5. Others
12.6.2.2. Southern Africa Market Revenue (US$ Mn) and Forecasts, By Fuel
Type
12.6.2.2.1. Diesel
12.6.2.2.2. Gasoline
12.6.2.3. Southern Africa Manifold Absolute Pressure (MAP) Sensor Market
Revenue (US$ Mn) and Forecasts, By Vehicle Type
12.6.2.3.1. Light Commercial Vehicle
12.6.2.3.2. Passenger Cars
12.6.2.3.3. Heavy Vehicles
12.6.2.4. Southern Africa Market Revenue (US$ Mn) and Forecasts, By
Application
12.6.2.4.1. Exhaust Gas Recirculation (EGR)
12.6.2.4.2. Barometric Pressure
12.6.3. Rest of MEA
12.6.3.1. Rest of MEA Manifold Absolute Pressure (MAP) Sensor Market
Revenue (US$ Mn) and Forecasts, By Pressure Rating
12.6.3.1.1. 1 Bar
12.6.3.1.2. 2 Bar
12.6.3.1.3. 3 Bar
12.6.3.1.4. 4 Bar
12.6.3.1.5. Others
12.6.3.2. Rest of MEA Manifold Absolute Pressure (MAP) Sensor Market
Revenue (US$ Mn) and Forecasts, By Fuel Type
12.6.3.2.1. Diesel
12.6.3.2.2. Gasoline
12.6.3.3. Rest of MEA Market Revenue (US$ Mn) and Forecasts, By Vehicle
Type
12.6.3.3.1. Light Commercial Vehicle
12.6.3.3.2. Passenger Cars
12.6.3.3.3. Heavy Vehicles
12.6.3.4. Rest of MEA Manifold Absolute Pressure (MAP) Sensor Market
Revenue (US$ Mn) and Forecasts, By Application
12.6.3.4.1. Exhaust Gas Recirculation (EGR)
12.6.3.4.2. Barometric Pressure
12.7. Key Segment for Channeling Investments
12.7.1. By Country
12.7.2. By Pressure Rating
12.7.3. By Fuel Type
12.7.4. By Vehicle Type
12.7.5. By Application
13.
Latin America Manifold
Absolute Pressure (MAP) Sensor Market Analysis and Forecasts, 2018 – 2026
13.1. Overview
13.1.1. Latin America Market Revenue (US$ Mn)
13.2. Latin America Manifold Absolute Pressure (MAP) Sensor Market
Revenue (US$ Mn) and Forecasts, By Pressure Rating
13.2.1. 1 Bar
13.2.2. 2 Bar
13.2.3. 3 Bar
13.2.4. 4 Bar
13.2.5. Others
13.3. Latin America Market Revenue (US$ Mn) and Forecasts, By Fuel
Type
13.3.1. Diesel
13.3.2. Gasoline
13.4. Latin America Manifold Absolute Pressure (MAP) Sensor Market
Revenue (US$ Mn) and Forecasts, By Vehicle Type
13.4.1. Light Commercial Vehicle
13.4.2. Passenger Cars
13.4.3. Heavy Vehicles
13.5. Latin America Market Revenue (US$ Mn) and Forecasts, By
Application
13.5.1. Exhaust Gas Recirculation (EGR)
13.5.2. Barometric Pressure
13.6. Latin America Manifold Absolute Pressure (MAP) Sensor Market
Revenue (US$ Mn) and Forecasts, By Country
13.6.1. Brazil
13.6.1.1. Brazil Manifold Absolute Pressure (MAP) Sensor Market Revenue
(US$ Mn) and Forecasts, By Pressure Rating
13.6.1.1.1. 1 Bar
13.6.1.1.2. 2 Bar
13.6.1.1.3. 3 Bar
13.6.1.1.4. 4 Bar
13.6.1.1.5. Others
13.6.1.2. Brazil Market Revenue (US$ Mn) and Forecasts, By Fuel Type
13.6.1.2.1. Diesel
13.6.1.2.2. Gasoline
13.6.1.3. Brazil Manifold Absolute Pressure (MAP) Sensor Market Revenue
(US$ Mn) and Forecasts, By Vehicle Type
13.6.1.3.1. Light Commercial Vehicle
13.6.1.3.2. Passenger Cars
13.6.1.3.3. Heavy Vehicles
13.6.1.4. Brazil Manifold Absolute Pressure (MAP) Sensor Market Revenue
(US$ Mn) and Forecasts, By Application
13.6.1.4.1. Exhaust Gas Recirculation (EGR)
13.6.1.4.2. Barometric Pressure
13.6.2. Rest of Latin America
13.6.2.1. Rest of Latin America Manifold Absolute Pressure (MAP) Sensor
Market Revenue (US$ Mn) and Forecasts, By Pressure Rating
13.6.2.1.1. 1 Bar
13.6.2.1.2. 2 Bar
13.6.2.1.3. 3 Bar
13.6.2.1.4. 4 Bar
13.6.2.1.5. Others
13.6.2.2. Rest of Latin America Market Revenue (US$ Mn) and Forecasts,
By Fuel Type
13.6.2.2.1. Diesel
13.6.2.2.2. Gasoline
13.6.2.3. Rest of Latin America Market Revenue (US$ Mn) and Forecasts,
By Vehicle Type
13.6.2.3.1. Light Commercial Vehicle
13.6.2.3.2. Passenger Cars
13.6.2.3.3. Heavy Vehicles
13.6.2.4. Rest of Latin America Manifold Absolute Pressure (MAP) Sensor
Market Revenue (US$ Mn) and Forecasts, By Application
13.6.2.4.1. Exhaust Gas Recirculation (EGR)
13.6.2.4.2. Barometric Pressure
13.7. Key Segment for Channeling Investments
13.7.1. By Country
13.7.2. By Pressure Rating
13.7.3. By Fuel Type
13.7.4. By Vehicle Type
13.7.5. By Application
14.
Competitive Benchmarking
14.1. Player Positioning Analysis
14.2. Global Presence and Growth Strategies
15.
Player Profiles
15.1. Airtex Vehicle Electronics
15.1.1. Company Details
15.1.2. Company Overview
15.1.3. Product Offerings
15.1.4. Key Developments
15.1.5. Financial Analysis
15.1.6. SWOT Analysis
15.1.7. Business Strategies
15.2. Continental AG
15.2.1. Company Details
15.2.2. Company Overview
15.2.3. Product Offerings
15.2.4. Key Developments
15.2.5. Financial Analysis
15.2.6. SWOT Analysis
15.2.7. Business Strategies
15.3. Delphi Automotive LLP
15.3.1. Company Details
15.3.2. Company Overview
15.3.3. Product Offerings
15.3.4. Key Developments
15.3.5. Financial Analysis
15.3.6. SWOT Analysis
15.3.7. Business Strategies
15.4. Denso Corporation
15.4.1. Company Details
15.4.2. Company Overview
15.4.3. Product Offerings
15.4.4. Key Developments
15.4.5. Financial Analysis
15.4.6. SWOT Analysis
15.4.7. Business Strategies
15.5. ERA SPA
15.5.1. Company Details
15.5.2. Company Overview
15.5.3. Product Offerings
15.5.4. Key Developments
15.5.5. Financial Analysis
15.5.6. SWOT Analysis
15.5.7. Business Strategies
15.6. Facet Srl
15.6.1. Company Details
15.6.2. Company Overview
15.6.3. Product Offerings
15.6.4. Key Developments
15.6.5. Financial Analysis
15.6.6. SWOT Analysis
15.6.7. Business Strategies
15.7. Francisco Albero S.A.U.
15.7.1. Company Details
15.7.2. Company Overview
15.7.3. Product Offerings
15.7.4. Key Developments
15.7.5. Financial Analysis
15.7.6. SWOT Analysis
15.7.7. Business Strategies
15.8. HELLA KGaA Hueck & Co.
15.8.1. Company Details
15.8.2. Company Overview
15.8.3. Product Offerings
15.8.4. Key Developments
15.8.5. Financial Analysis
15.8.6. SWOT Analysis
15.8.7. Business Strategies
15.9. Infineon Technologies AG
15.9.1. Company Details
15.9.2. Company Overview
15.9.3. Product Offerings
15.9.4. Key Developments
15.9.5. Financial Analysis
15.9.6. SWOT Analysis
15.9.7. Business Strategies
15.10. Magneti Marelli S.p.A.
15.10.1.
Company Details
15.10.2.
Company Overview
15.10.3.
Product Offerings
15.10.4.
Key Developments
15.10.5.
Financial Analysis
15.10.6.
SWOT Analysis
15.10.7.
Business Strategies
15.11. Meat & Doria S.r.l.
15.11.1.
Company Details
15.11.2.
Company Overview
15.11.3.
Product Offerings
15.11.4.
Key Developments
15.11.5.
Financial Analysis
15.11.6.
SWOT Analysis
15.11.7.
Business Strategies
15.12. Mitsubishi Electric Corporation
15.12.1.
Company Details
15.12.2.
Company Overview
15.12.3.
Product Offerings
15.12.4.
Key Developments
15.12.5.
Financial Analysis
15.12.6.
SWOT Analysis
15.12.7.
Business Strategies
15.13. NXP Semiconductors
15.13.1.
Company Details
15.13.2.
Company Overview
15.13.3.
Product Offerings
15.13.4.
Key Developments
15.13.5.
Financial Analysis
15.13.6.
SWOT Analysis
15.13.7.
Business Strategies
15.14. Pierburg s.r.o.
15.14.1.
Company Details
15.14.2.
Company Overview
15.14.3.
Product Offerings
15.14.4.
Key Developments
15.14.5.
Financial Analysis
15.14.6.
SWOT Analysis
15.14.7.
Business Strategies
15.15. Robert Bosch GmbH
15.15.1.
Company Details
15.15.2.
Company Overview
15.15.3.
Product Offerings
15.15.4.
Key Developments
15.15.5.
Financial Analysis
15.15.6.
SWOT Analysis
15.15.7.
Business Strategies
15.16. Siemens AG
15.16.1.
Company Details
15.16.2.
Company Overview
15.16.3.
Product Offerings
15.16.4.
Key Developments
15.16.5.
Financial Analysis
15.16.6.
SWOT Analysis
15.16.7.
Business Strategies
15.17. Silicon Microstructures, Inc.
15.17.1.
Company Details
15.17.2.
Company Overview
15.17.3.
Product Offerings
15.17.4.
Key Developments
15.17.5.
Financial Analysis
15.17.6.
SWOT Analysis
15.17.7.
Business Strategies
15.18. TE Connectivity Corporation
15.18.1. Company Details
15.18.2. Company Overview
15.18.3. Product Offerings
15.18.4. Key Developments
15.18.5. Financial Analysis
15.18.6. SWOT Analysis
15.18.7. Business Strategies
Note: This ToC is
tentative and can be changed according to the research study conducted during
the course of report completion.
At Absolute Markets Insights, we are engaged in building both global as well as country specific reports. As a result, the approach taken for deriving the estimation and forecast for a specific country is a bit unique and different in comparison to the global research studies. In this case, we not only study the concerned market factors & trends prevailing in a particular country (from secondary research) but we also tend to calculate the actual market size & forecast from the revenue generated from the market participants involved in manufacturing or distributing the any concerned product. These companies can also be service providers. For analyzing any country specifically, we do consider the growth factors prevailing under the states/cities/county for the same. For instance, if we are analyzing an industry specific to United States, we primarily need to study about the states present under the same(where the product/service has the highest growth). Similar analysis will be followed by other countries. Our scope of the report changes with different markets.
Our research study is mainly implement through a mix of both secondary and primary research. Various sources such as industry magazines, trade journals, and government websites and trade associations are reviewed for gathering precise data. Primary interviews are conducted to validate the market size derived from secondary research. Industry experts, major manufacturers and distributors are contacted for further validation purpose on the current market penetration and growth trends.
Prominent participants in our primary research process include:
- Key Opinion Leaders namely the CEOs, CSOs, VPs, purchasing managers, amongst others
- Research and development participants, distributors/suppliers and subject matter experts
Secondary Research includes data extracted from paid data sources:
- Reuters
- Factiva
- Bloomberg
- One Source
- Hoovers
Research Methodology

Key Inclusions


