
Military Vetronics Market by Product (Communication System, Navigation System, C4 System, Power System, Display System, Control and Data Distribution System and Other); by Application (Light Protected Vehicles, Unmanned Ground Vehicles, Armored Amphibious Vehicles, Special Purpose Vehicles and Other ); by Regional outlook (U.S., Rest of North America, France, UK, Germany, Spain, Italy, Rest of Europe, China, Japan, India, Southeast Asia, Rest of Asia Pacific, GCC Countries, Southern Africa, Rest of MEA, Brazil, Rest of Latin America) – Global Insights, Growth, Size, Comparative Analysis, Trends and Forecast, 2018 - 2026
Industry Trends
Military vetronics is a product with high technology specification used extensively in the military domain. In defense, the demand for unmanned vehicles and drones is growing at high pace globally. These unmanned vehicles and drones are equipped with sophisticated technologies for capturing images of foliage, sporting events, and cityscapes. Thus, accelerating the military vetronics market. The global military vetronics market was valued at US$ 3,871.92 Mn in 2017 and is expected to reach US$ 4,744.39 Mn by 2022. The growth of the market is witnessed due to rising government initiatives to conduct secret military operation owing to increasing war situation among the various countries is expected to increase the demand for vetronics in military in the coming years.
Military Vetronics Market, By Product, 2018-2026 (USD Million)
The requirement for military mission is continuously evolving. The increasing technological advancements in vetronics such as HD video calling, advanced threat detection sensors, high bandwidth networking are the new requirements of military which are further accelerating the growth. However, high cost of such products in market is slowing down the market growth. Whereas on the other hand need of such advance technology is creating opportunity for military vetronics market.
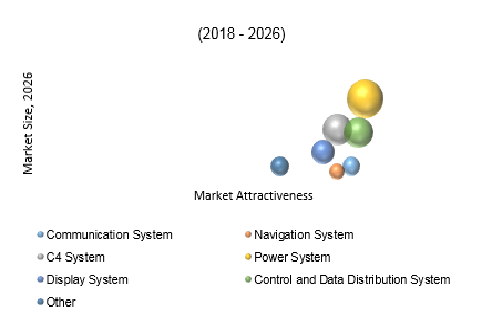
Military Vetronics Market, by Product
The solution segment of market is bifurcated into communication system, navigation system, C4 system, power system, display system, control and data distribution system and others, wherein the power system segment is currently dominating the market. Power management is one of the challenge in military vetronics, however this is overcome by introducing power system in the market. Hence, power system acquires the maximum market share to maintain sophisticated power management and computing, in the global market.
Military Vetronics Market, by Region
North America currently holds the maximum market share in the global market owing to increasing government initiatives to upgrade and strengthen their military abilities. The growth of military vetronics revenue in this region is primarily dependent on the increasing investments in research and development efforts for advanced vetronics systems. This applies especially to the fields of navigation systems, communication systems, and real time data transmission systems in modern combat vehicles. Among all the countries United States holds the maximum market share due to availability of expert skills and technological advancement.
Competitive Market Share
The Military Vetronics Market report provides both, qualitative and quantitative research of the market, as well as integrates worthy insights into the rational scenario and favored development methods adopted by the key contenders. The report also offers extensive research on the key players in this market and detailed insights on the competitiveness of these players. The key business strategies such as M&A, affiliations, collaborations, and contracts adopted by the major players are also recognized and analyzed in the report. For each company, the report recognizes their manufacturing base, competitors, product type, application and specification, pricing, and gross margin.
The market is consolidated since the market has giant players who are generating maximum market share. Some of the primary players of consolidated global Military Vetronics market are CurtissWright Corporation, Thales Group, SAAB A.B., BAE Systems PLC, Elbit Systems Ltd, General Electric Company, Lockheed Martin Corporation, General Dynamics Corporation, Ultra Electronics Ltd, The Raytheon Company and Kongsberg Gruppen ASA.

Military Vetronics Industry Background
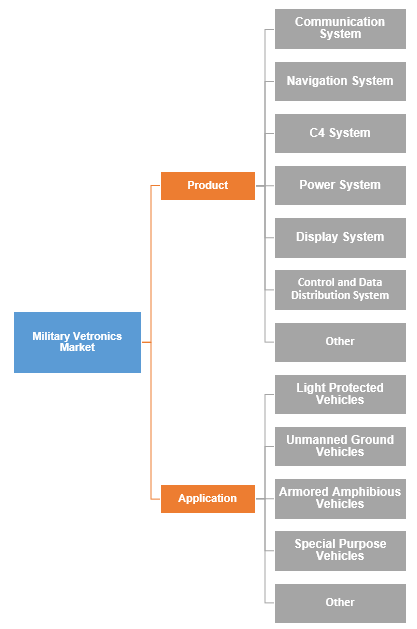
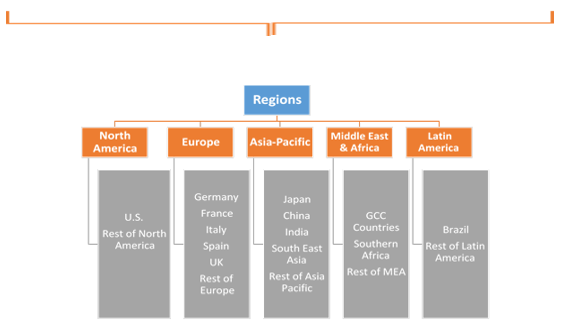
Table of Contents
1.
Introduction
1.1. Market Scope
1.2. Market Segmentation
1.3. Methodology
1.4. Assumptions
2.
Military Vetronics Market Snapshot
3.
Executive Summary: Military Vetronics Market
4.
Qualitative Analysis: Military Vetronics Market
4.1. Introduction
4.1.1. Product Definition
4.1.2. Industry Development
4.2. Market Dynamics
4.2.1. Drivers
4.2.2. Restraints
4.2.3. Opportunities
4.4.
Military
Vetronics Manufacturing Cost Analysis
4.4.1. Military vetronics Key Raw Materials Analysis
4.4.2. Price Trend of Key Raw Materials
4.4.3. Key Suppliers of Raw Materials
4.4.4. Proportion of Manufacturing Cost
4.4.5. Manufacturing Process Analysis of Military
Vetronics
4.5.
Marketing Strategy
Analysis: Military Vetronics Market
4.5.1. Marketing Channel
4.5.1.1.
Direct Marketing
4.5.1.2.
Indirect
Marketing
4.5.1.3.
Marketing Channel
Development Trend
4.5.2. Market Positioning
4.5.2.1.
Pricing Strategy
4.5.2.2.
Brand Strategy
5.
Global Military Vetronics Market Analysis and
Forecasts, 2018 – 2026
5.1. Overview
5.1.1. Global Market Revenue (US$ Mn) and Forecasts
5.2. Global Military Vetronics Market Revenue (US$
Mn) and Forecasts, By Product
5.2.1. Communication System
5.2.1.1.
Definition
5.2.1.2.
Market
Penetration
5.2.1.3.
Market Revenue
Expected to Increase by 2026
5.2.1.4.
Compound Annual
Growth Rate (CAGR)
5.2.2. Navigation System
5.2.2.1.
Definition
5.2.2.2.
Market
Penetration
5.2.2.3.
Market Revenue
Expected to Increase by 2026
5.2.2.4.
Compound Annual
Growth Rate (CAGR)
5.2.3. C4 System
5.2.3.1.
Definition
5.2.3.2.
Market
Penetration
5.2.3.3.
Market Revenue
Expected to Increase by 2026
5.2.3.4.
Compound Annual
Growth Rate (CAGR)
5.2.4. Power System
5.2.4.1.
Definition
5.2.4.2.
Market
Penetration
5.2.4.3.
Market Revenue
Expected to Increase by 2026
5.2.4.4.
Compound Annual
Growth Rate (CAGR)
5.2.5. Display System
5.2.5.1.
Definition
5.2.5.2.
Market
Penetration
5.2.5.3.
Market Revenue
Expected to Increase by 2026
5.2.5.4.
Compound Annual
Growth Rate (CAGR)
5.2.6. Control and Data Distribution System
5.2.6.1.
Definition
5.2.6.2.
Market
Penetration
5.2.6.3.
Market Revenue
Expected to Increase by 2026
5.2.6.4.
Compound Annual
Growth Rate (CAGR)
5.2.7. Others
5.2.7.1.
Definition
5.2.7.2.
Market
Penetration
5.2.7.3.
Market Revenue
Expected to Increase by 2026
5.2.7.4.
Compound Annual
Growth Rate (CAGR)
5.3. Key Segment for Channeling Investments
5.3.1. By Product
6.
Global Military Vetronics Market Analysis and
Forecasts, 2018 – 2026
6.1. Overview
6.2. Global Military Vetronics Market Revenue (US$
Mn) and Forecasts, By Application
6.2.1. Light Protected Vehicles
6.2.1.1.
Definition
6.2.1.2.
Market Penetration
6.2.1.3.
Market Revenue
Expected to Increase by 2026
6.2.1.4.
Compound Annual
Growth Rate (CAGR)
6.2.2. Unmanned Ground Vehicles
6.2.2.1.
Definition
6.2.2.2.
Market
Penetration
6.2.2.3.
Market Revenue
Expected to Increase by 2026
6.2.2.4.
Compound Annual
Growth Rate (CAGR)
6.2.3. Armored Amphibious Vehicles
6.2.3.1.
Definition
6.2.3.2.
Market
Penetration
6.2.3.3.
Market Revenue
Expected to Increase by 2026
6.2.3.4.
Compound Annual
Growth Rate (CAGR)
6.2.4. Special Purpose Vehicles
6.2.4.1.
Definition
6.2.4.2.
Market
Penetration
6.2.4.3.
Market Revenue
Expected to Increase by 2026
6.2.4.4.
Compound Annual
Growth Rate (CAGR)
6.2.5. Others
6.2.5.1.
Definition
6.2.5.2.
Market Penetration
6.2.5.3.
Market Revenue
Expected to Increase by 2026
6.2.5.4.
Compound Annual
Growth Rate (CAGR)
6.3. Key Segment for Channeling Investments
6.3.1. By Application
7.
North America Military Vetronics Market Analysis
and Forecasts, 2018 – 2026
7.1. Overview
7.1.1. North America Market Revenue (US$ Mn)
7.2. North America Military Vetronics Market Revenue
(US$ Mn) and Forecasts, By Product
7.2.1. Communication System
7.2.2. Navigation System
7.2.3. C4 System
7.2.4. Power System
7.2.5. Display System
7.2.6. Control and Data Distribution System
7.2.7. Others
7.3. North America Market Revenue (US$ Mn) and
Forecasts, By Application
7.3.1. Light Protected Vehicles
7.3.2. Unmanned Ground Vehicles
7.3.3. Armored Amphibious Vehicles
7.3.4. Special Purpose Vehicles
7.3.5. Others
7.4. North America Military Vetronics Market Revenue
(US$ Mn) and Forecasts, By Country
7.4.1. U.S.
7.4.1.1.
U.S. Military
Vetronics Market Revenue (US$ Mn) and Forecasts, By Product
7.4.1.1.1. Communication System
7.4.1.1.2. Navigation System
7.4.1.1.3. C4 System
7.4.1.1.4. Power System
7.4.1.1.5. Display System
7.4.1.1.6. Control and Data Distribution System
7.4.1.1.7. Others
7.4.1.2.
U.S. Market
Revenue (US$ Mn) and Forecasts, By Application
7.4.1.2.1. Light Protected Vehicles
7.4.1.2.2. Unmanned Ground Vehicles
7.4.1.2.3. Armored Amphibious Vehicles
7.4.1.2.4. Special Purpose Vehicles
7.4.1.2.5. Others
7.4.2. Rest of North America
7.4.2.1.
Rest of North
America Military Vetronics Market Revenue (US$ Mn) and Forecasts, By Product
7.4.2.1.1. Communication System
7.4.2.1.2. Navigation System
7.4.2.1.3. C4 System
7.4.2.1.4. Power System
7.4.2.1.5. Display System
7.4.2.1.6. Control and Data Distribution System
7.4.2.1.7. Others
7.4.2.2.
Rest of North
America Military Vetronics Market Revenue (US$ Mn) and Forecasts, By
Application
7.4.2.2.1. Light Protected Vehicles
7.4.2.2.2. Unmanned Ground Vehicles
7.4.2.2.3. Armored Amphibious Vehicles
7.4.2.2.4. Special Purpose Vehicles
7.4.2.2.5. Others
7.5. Key Segment for Channeling Investments
7.5.1. By Country
7.5.2. By Product
7.5.3. By Application
8.
Europe Military Vetronics Market Analysis and
Forecasts, 2018 – 2026
8.1. Overview
8.1.1. Europe Market Revenue (US$ Mn)
8.2. Europe Military Vetronics Market Revenue (US$
Mn) and Forecasts, By Product
8.2.1. Communication System
8.2.2. Navigation System
8.2.3. C4 System
8.2.4. Power System
8.2.5. Display System
8.2.6. Control and Data Distribution System
8.2.7. Others
8.3. Europe Market Revenue (US$ Mn) and Forecasts, By
Application
8.3.1. Light Protected Vehicles
8.3.2. Unmanned Ground Vehicles
8.3.3. Armored Amphibious Vehicles
8.3.4. Special Purpose Vehicles
8.3.5. Others
8.4. Europe Military Vetronics Market Revenue (US$
Mn) and Forecasts, By Country
8.4.1. France
8.4.1.1.
France Military
Vetronics Market Revenue (US$ Mn) and Forecasts, By Product
8.4.1.1.1. Communication System
8.4.1.1.2. Navigation System
8.4.1.1.3. C4 System
8.4.1.1.4. Power System
8.4.1.1.5. Display System
8.4.1.1.6. Control and Data Distribution System
8.4.1.1.7. Others
8.4.1.2.
France Military
Vetronics Market Revenue (US$ Mn) and Forecasts, By Application
8.4.1.2.1. Light Protected Vehicles
8.4.1.2.2. Unmanned Ground Vehicles
8.4.1.2.3. Armored Amphibious Vehicles
8.4.1.2.4. Special Purpose Vehicles
8.4.1.2.5. Others
8.4.2. The UK
8.4.2.1.
The UK Military
Vetronics Market Revenue (US$ Mn) and Forecasts, By Product
8.4.2.1.1. Communication System
8.4.2.1.2. Navigation System
8.4.2.1.3. C4 System
8.4.2.1.4. Power System
8.4.2.1.5. Display System
8.4.2.1.6. Control and Data Distribution System
8.4.2.1.7. Others
8.4.2.2.
The UK Market
Revenue (US$ Mn) and Forecasts, By Application
8.4.2.2.1. Light Protected Vehicles
8.4.2.2.2. Unmanned Ground Vehicles
8.4.2.2.3. Armored Amphibious Vehicles
8.4.2.2.4. Special Purpose Vehicles
8.4.2.2.5. Others
8.4.3. Spain
8.4.3.1.
Spain Military
Vetronics Market Revenue (US$ Mn) and Forecasts, By Product
8.4.3.1.1. Communication System
8.4.3.1.2. Navigation System
8.4.3.1.3. C4 System
8.4.3.1.4. Power System
8.4.3.1.5. Display System
8.4.3.1.6. Control and Data Distribution System
8.4.3.1.7. Others
8.4.3.2.
Spain Military
Vetronics Market Revenue (US$ Mn) and Forecasts, By Application
8.4.3.2.1. Light Protected Vehicles
8.4.3.2.2. Unmanned Ground Vehicles
8.4.3.2.3. Armored Amphibious Vehicles
8.4.3.2.4. Special Purpose Vehicles
8.4.3.2.5. Others
8.4.4. Germany
8.4.4.1.
Germany Military
Vetronics Market Revenue (US$ Mn) and Forecasts, By Product
8.4.4.1.1. Communication System
8.4.4.1.2. Navigation System
8.4.4.1.3. C4 System
8.4.4.1.4. Power System
8.4.4.1.5. Display System
8.4.4.1.6. Control and Data Distribution System
8.4.4.1.7. Others
8.4.4.2.
Germany Market
Revenue (US$ Mn) and Forecasts, By Application
8.4.4.2.1. Light Protected Vehicles
8.4.4.2.2. Unmanned Ground Vehicles
8.4.4.2.3. Armored Amphibious Vehicles
8.4.4.2.4. Special Purpose Vehicles
8.4.4.2.5. Others
8.4.5. Italy
8.4.5.1.
Italy Military
Vetronics Market Revenue (US$ Mn) and Forecasts, By Product
8.4.5.1.1. Communication System
8.4.5.1.2. Navigation System
8.4.5.1.3. C4 System
8.4.5.1.4. Power System
8.4.5.1.5. Display System
8.4.5.1.6. Control and Data Distribution System
8.4.5.1.7. Others
8.4.5.2.
Italy Military
Vetronics Market Revenue (US$ Mn) and Forecasts, By Application
8.4.5.2.1. Light Protected Vehicles
8.4.5.2.2. Unmanned Ground Vehicles
8.4.5.2.3. Armored Amphibious Vehicles
8.4.5.2.4. Special Purpose Vehicles
8.4.5.2.5. Others
8.4.6. Rest of Europe
8.4.6.1.
Rest of Europe
Military Vetronics Market Revenue (US$ Mn) and Forecasts, By Product
8.4.6.1.1. Communication System
8.4.6.1.2. Navigation System
8.4.6.1.3. C4 System
8.4.6.1.4. Power System
8.4.6.1.5. Display System
8.4.6.1.6. Control and Data Distribution System
8.4.6.1.7. Others
8.4.6.2.
Rest of Europe
Military Vetronics Market Revenue (US$ Mn) and Forecasts, By Application
8.4.6.2.1. Light Protected Vehicles
8.4.6.2.2. Unmanned Ground Vehicles
8.4.6.2.3. Armored Amphibious Vehicles
8.4.6.2.4. Special Purpose Vehicles
8.4.6.2.5. Others
8.5. Key Segment for Channeling Investments
8.5.1. By Country
8.5.2. By Product
8.5.3. By Application
9.
Asia Pacific Military Vetronics Market Analysis
and Forecasts, 2018 – 2026
9.1. Overview
9.1.1. Asia Pacific Market Revenue (US$ Mn)
9.2. Asia Pacific Military Vetronics Market Revenue
(US$ Mn) and Forecasts, By Product
9.2.1. Communication System
9.2.2. Navigation System
9.2.3. C4 System
9.2.4. Power System
9.2.5. Display System
9.2.6. Control and Data Distribution System
9.2.7. Others
9.3. Asia Pacific Market Revenue (US$ Mn) and
Forecasts, By Application
9.3.1. Light Protected Vehicles
9.3.2. Unmanned Ground Vehicles
9.3.3. Armored Amphibious Vehicles
9.3.4. Special Purpose Vehicles
9.3.5. Others
9.4. Asia Pacific Military Vetronics Market Revenue
(US$ Mn) and Forecasts, By Country
9.4.1. China
9.4.1.1.
China Military
Vetronics Market Revenue (US$ Mn) and Forecasts, By Product
9.4.1.1.1. Communication System
9.4.1.1.2. Navigation System
9.4.1.1.3. C4 System
9.4.1.1.4. Power System
9.4.1.1.5. Display System
9.4.1.1.6. Control and Data Distribution System
9.4.1.1.7. Others
9.4.1.2.
China Market
Revenue (US$ Mn) and Forecasts, By Application
9.4.1.2.1. Light Protected Vehicles
9.4.1.2.2. Unmanned Ground Vehicles
9.4.1.2.3. Armored Amphibious Vehicles
9.4.1.2.4. Special Purpose Vehicles
9.4.1.2.5. Others
9.4.2. Japan
9.4.2.1.
Japan Military
Vetronics Market Revenue (US$ Mn) and Forecasts, By Product
9.4.2.1.1. Communication System
9.4.2.1.2. Navigation System
9.4.2.1.3. C4 System
9.4.2.1.4. Power System
9.4.2.1.5. Display System
9.4.2.1.6. Control and Data Distribution System
9.4.2.1.7. Others
9.4.2.2.
Japan Market
Revenue (US$ Mn) and Forecasts, By Application
9.4.2.2.1. Light Protected Vehicles
9.4.2.2.2. Unmanned Ground Vehicles
9.4.2.2.3. Armored Amphibious Vehicles
9.4.2.2.4. Special Purpose Vehicles
9.4.2.2.5. Others
9.4.3. India
9.4.3.1.
India Military
Vetronics Market Revenue (US$ Mn) and Forecasts, By Product
9.4.3.1.1. Communication System
9.4.3.1.2. Navigation System
9.4.3.1.3. C4 System
9.4.3.1.4. Power System
9.4.3.1.5. Display System
9.4.3.1.6. Control and Data Distribution System
9.4.3.1.7. Others
9.4.3.2.
India Military
Vetronics Market Revenue (US$ Mn) and Forecasts, By Application
9.4.3.2.1. Light Protected Vehicles
9.4.3.2.2. Unmanned Ground Vehicles
9.4.3.2.3. Armored Amphibious Vehicles
9.4.3.2.4. Special Purpose Vehicles
9.4.3.2.5. Others
9.4.4. Southeast Asia
9.4.4.1.
Southeast Asia
Military Vetronics Market Revenue (US$ Mn) and Forecasts, By Product
9.4.4.1.1. Communication System
9.4.4.1.2. Navigation System
9.4.4.1.3. C4 System
9.4.4.1.4. Power System
9.4.4.1.5. Display System
9.4.4.1.6. Control and Data Distribution System
9.4.4.1.7. Others
9.4.4.2.
Southeast Asia
Market Revenue (US$ Mn) and Forecasts, By Application
9.4.4.2.1. Light Protected Vehicles
9.4.4.2.2. Unmanned Ground Vehicles
9.4.4.2.3. Armored Amphibious Vehicles
9.4.4.2.4. Special Purpose Vehicles
9.4.4.2.5. Others
9.4.5. Rest of Asia Pacific
9.4.5.1.
Rest of Asia
Pacific Military Vetronics Market Revenue (US$ Mn) and Forecasts, By Product
9.4.5.1.1. Communication System
9.4.5.1.2. Navigation System
9.4.5.1.3. C4 System
9.4.5.1.4. Power System
9.4.5.1.5. Display System
9.4.5.1.6. Control and Data Distribution System
9.4.5.1.7. Others
9.4.5.2.
Rest of Asia
Pacific Military Vetronics Market Revenue (US$ Mn) and Forecasts, By
Application
9.4.5.2.1. Light Protected Vehicles
9.4.5.2.2. Unmanned Ground Vehicles
9.4.5.2.3. Armored Amphibious Vehicles
9.4.5.2.4. Special Purpose Vehicles
9.4.5.2.5. Others
9.5. Key Segment for Channeling Investments
9.5.1. By Country
9.5.2. By Product
9.5.3. By Application
10. Middle East
and Africa Military Vetronics Market Analysis and Forecasts, 2018 – 2026
10.1. Overview
10.1.1. Middle East and Africa Market Revenue (US$ Mn)
10.2. Middle East and Africa Military Vetronics Market
Revenue (US$ Mn) and Forecasts, By Product
10.2.1. Communication System
10.2.2. Navigation System
10.2.3. C4 System
10.2.4. Power System
10.2.5. Display System
10.2.6. Control and Data Distribution System
10.2.7. Others
10.3. Middle East and Africa Market Revenue (US$ Mn)
and Forecasts, By Application
10.3.1. Light Protected Vehicles
10.3.2. Unmanned Ground Vehicles
10.3.3. Armored Amphibious Vehicles
10.3.4. Special Purpose Vehicles
10.3.5. Others
10.4. Middle East and Africa Military Vetronics Market
Revenue (US$ Mn) and Forecasts, By Country
10.4.1. GCC Countries
10.4.1.1.
GCC Countries
Military Vetronics Market Revenue (US$ Mn) and Forecasts, By Product
10.4.1.1.1. Communication System
10.4.1.1.2. Navigation System
10.4.1.1.3. C4 System
10.4.1.1.4. Power System
10.4.1.1.5. Display System
10.4.1.1.6. Control and Data Distribution System
10.4.1.1.7. Others
10.4.1.2.
GCC Countries
Military Vetronics Market Revenue (US$ Mn) and Forecasts, By Application
10.4.1.2.1. Light Protected Vehicles
10.4.1.2.2. Unmanned Ground Vehicles
10.4.1.2.3. Armored Amphibious Vehicles
10.4.1.2.4. Special Purpose Vehicles
10.4.1.2.5. Others
10.4.2. Southern Africa
10.4.2.1.
Southern Africa
Military Vetronics Market Revenue (US$ Mn) and Forecasts, By Product
10.4.2.1.1. Communication System
10.4.2.1.2. Navigation System
10.4.2.1.3. C4 System
10.4.2.1.4. Power System
10.4.2.1.5. Display System
10.4.2.1.6. Control and Data Distribution System
10.4.2.1.7. Others
10.4.2.2.
Southern Africa
Military Vetronics Market Revenue (US$ Mn) and Forecasts, By Application
10.4.2.2.1. Light Protected Vehicles
10.4.2.2.2. Unmanned Ground Vehicles
10.4.2.2.3. Armored Amphibious Vehicles
10.4.2.2.4. Special Purpose Vehicles
10.4.2.2.5. Others
10.4.3. Rest of MEA
10.4.3.1.
Rest of MEA
Military Vetronics Market Revenue (US$ Mn) and Forecasts, By Product
10.4.3.1.1. Communication System
10.4.3.1.2. Navigation System
10.4.3.1.3. C4 System
10.4.3.1.4. Power System
10.4.3.1.5. Display System
10.4.3.1.6. Control and Data Distribution System
10.4.3.1.7. Others
10.4.3.2.
Rest of MEA
Military Vetronics Market Revenue (US$ Mn) and Forecasts, By Application
10.4.3.2.1. Light Protected Vehicles
10.4.3.2.2. Unmanned Ground Vehicles
10.4.3.2.3. Armored Amphibious Vehicles
10.4.3.2.4. Special Purpose Vehicles
10.4.3.2.5. Others
10.5. Key Segment for Channeling Investments
10.5.1. By Country
10.5.2. By Product
10.5.3. By Application
11. Latin
America Military Vetronics Market Analysis and Forecasts, 2018 – 2026
11.1. Overview
11.1.1. Latin America Market Revenue (US$ Mn)
11.2. Latin America Military Vetronics Market Revenue
(US$ Mn) and Forecasts, By Product
11.2.1. Communication System
11.2.2. Navigation System
11.2.3. C4 System
11.2.4. Power System
11.2.5. Display System
11.2.6. Control and Data Distribution System
11.2.7. Others
11.3. Latin America Military Vetronics Market Revenue
(US$ Mn) and Forecasts, By Application
11.3.1. Light Protected Vehicles
11.3.2. Unmanned Ground Vehicles
11.3.3. Armored Amphibious Vehicles
11.3.4. Special Purpose Vehicles
11.3.5. Others
11.4. Latin America Military Vetronics Market Revenue
(US$ Mn) and Forecasts, By Country
11.4.1. Brazil
11.4.1.1.
Brazil Military
Vetronics Market Revenue (US$ Mn) and Forecasts, By Product
11.4.1.1.1. Communication System
11.4.1.1.2. Navigation System
11.4.1.1.3. C4 System
11.4.1.1.4. Power System
11.4.1.1.5. Display System
11.4.1.1.6. Control and Data Distribution System
11.4.1.1.7. Others
11.4.1.2.
Brazil Market
Revenue (US$ Mn) and Forecasts, By Application
11.4.1.2.1. Light Protected Vehicles
11.4.1.2.2. Unmanned Ground Vehicles
11.4.1.2.3. Armored Amphibious Vehicles
11.4.1.2.4. Special Purpose Vehicles
11.4.1.2.5. Others
11.4.2. Rest of Latin America
11.4.2.1.
Rest of Latin
America Military Vetronics Market Revenue (US$ Mn) and Forecasts, By Product
11.4.2.1.1. Communication System
11.4.2.1.2. Navigation System
11.4.2.1.3. C4 System
11.4.2.1.4. Power System
11.4.2.1.5. Display System
11.4.2.1.6. Control and Data Distribution System
11.4.2.1.7. Others
11.4.2.2.
Rest of Latin
America Military Vetronics Market Revenue (US$ Mn) and Forecasts, By
Application
11.4.2.2.1. Light Protected Vehicles
11.4.2.2.2. Unmanned Ground Vehicles
11.4.2.2.3. Armored Amphibious Vehicles
11.4.2.2.4. Special Purpose Vehicles
11.4.2.2.5. Others
11.5. Key Segment for Channeling Investments
11.5.1. By Country
11.5.2. By Product
11.5.3. By Application
12. Competitive
Benchmarking
12.1. Player Positioning Analysis
12.2. Global Presence and Growth Strategies
13. Player
Profiles
13.1. BAE Systems PLC
13.1.1. Company Details
13.1.2. Company Overview
13.1.3. Product Offerings
13.1.4. Key Developments
13.1.5. Financial Analysis
13.1.6. SWOT Analysis
13.1.7. Business Strategies
13.2. CurtissWright Corporation
13.2.1. Company Details
13.2.2. Company Overview
13.2.3. Product Offerings
13.2.4. Key Developments
13.2.5. Financial Analysis
13.2.6. SWOT Analysis
13.2.7. Business Strategies
13.3. Elbit Systems Ltd
13.3.1. Company Details
13.3.2. Company Overview
13.3.3. Product Offerings
13.3.4. Key Developments
13.3.5. Financial Analysis
13.3.6. SWOT Analysis
13.3.7. Business Strategies
13.4. General Dynamics Corporation
13.4.1. Company Details
13.4.2. Company Overview
13.4.3. Product Offerings
13.4.4. Key Developments
13.4.5. Financial Analysis
13.4.6. SWOT Analysis
13.4.7. Business Strategies
13.5. General Electric Company
13.5.1. Company Details
13.5.2. Company Overview
13.5.3. Product Offerings
13.5.4. Key Developments
13.5.5. Financial Analysis
13.5.6. SWOT Analysis
13.5.7. Business Strategies
13.6. Kongsberg Gruppen ASA
13.6.1. Company Details
13.6.2. Company Overview
13.6.3. Product Offerings
13.6.4. Key Developments
13.6.5. Financial Analysis
13.6.6. SWOT Analysis
13.6.7. Business Strategies
13.7. Lockheed Martin Corporation
13.7.1. Company Details
13.7.2. Company Overview
13.7.3. Product Offerings
13.7.4. Key Developments
13.7.5. Financial Analysis
13.7.6. SWOT Analysis
13.7.7. Business Strategies
13.8. SAAB A.B.
13.8.1. Company Details
13.8.2. Company Overview
13.8.3. Product Offerings
13.8.4. Key Developments
13.8.5. Financial Analysis
13.8.6. SWOT Analysis
13.8.7. Business Strategies
13.9. Thales Group
13.9.1. Company Details
13.9.2. Company Overview
13.9.3. Product Offerings
13.9.4. Key Developments
13.9.5. Financial Analysis
13.9.6. SWOT Analysis
13.9.7. Business Strategies
13.10. The Raytheon Company
13.10.1. Company Details
13.10.2. Company Overview
13.10.3. Product Offerings
13.10.4. Key Developments
13.10.5. Financial Analysis
13.10.6. SWOT Analysis
13.10.7. Business Strategies
13.11. Ultra Electronics Ltd
13.11.1. Company Details
13.11.2. Company Overview
13.11.3. Product Offerings
13.11.4. Key Developments
13.11.5. Financial Analysis
13.11.6. SWOT Analysis
13.11.7. Business Strategies
Note: This ToC is
tentative and can be changed according to the research study conducted during
the course of report completion.
At Absolute Markets Insights, we are engaged in building both global as well as country specific reports. As a result, the approach taken for deriving the estimation and forecast for a specific country is a bit unique and different in comparison to the global research studies. In this case, we not only study the concerned market factors & trends prevailing in a particular country (from secondary research) but we also tend to calculate the actual market size & forecast from the revenue generated from the market participants involved in manufacturing or distributing the any concerned product. These companies can also be service providers. For analyzing any country specifically, we do consider the growth factors prevailing under the states/cities/county for the same. For instance, if we are analyzing an industry specific to United States, we primarily need to study about the states present under the same(where the product/service has the highest growth). Similar analysis will be followed by other countries. Our scope of the report changes with different markets.
Our research study is mainly implement through a mix of both secondary and primary research. Various sources such as industry magazines, trade journals, and government websites and trade associations are reviewed for gathering precise data. Primary interviews are conducted to validate the market size derived from secondary research. Industry experts, major manufacturers and distributors are contacted for further validation purpose on the current market penetration and growth trends.
Prominent participants in our primary research process include:
- Key Opinion Leaders namely the CEOs, CSOs, VPs, purchasing managers, amongst others
- Research and development participants, distributors/suppliers and subject matter experts
Secondary Research includes data extracted from paid data sources:
- Reuters
- Factiva
- Bloomberg
- One Source
- Hoovers
Research Methodology

Key Inclusions


