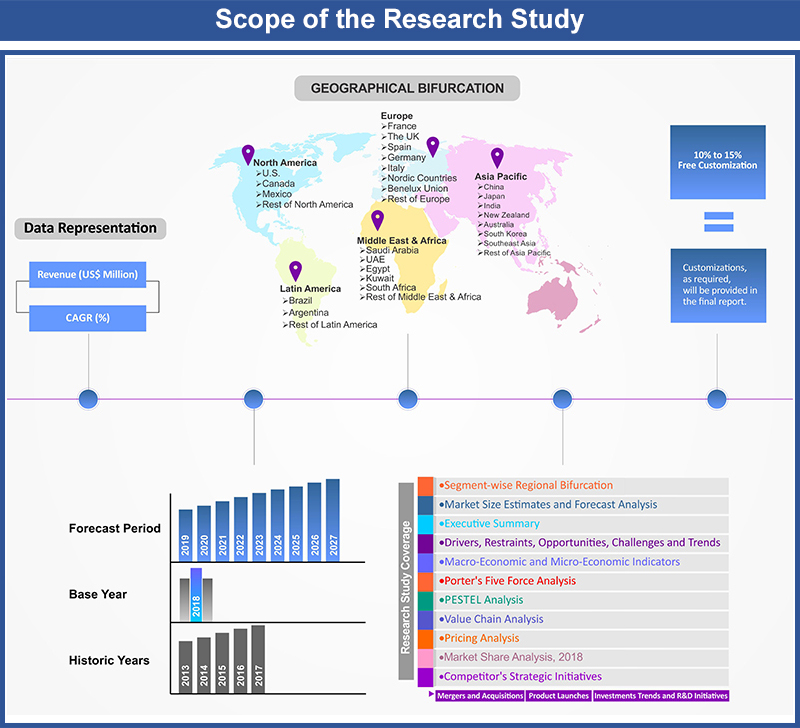
Asia Pacific Mobility as a Service (MaaS) Market By Type of Service (Self-driving Car Service, Ride-Hailing, Car Sharing, Bike Sharing); By Application Platform (Android, iOS); By End User (Government, Private Firms (Start-ups, Corporations)); By Countries (China, Japan, India, New Zealand, Australia, South Korea, Southeast Asia (Indonesia, Thailand, Malaysia, Singapore, Vietnam, Philippines, Rest of Asia Pacific) – Asia Pacific Insights, Growth, Size, Comparative Analysis, Trends and Forecast, 2019 - 2027
Industry Trends
The changing lifestyle, traditional mobility needs and customer expectations are transforming from ownership to service oriented. The changing automotive ecosystem is transforming how mobility is delivered towards a user-centred paradigm. Technological advancements such as connectivity, electric vehicles and others have contributed towards emerging mobility trends such as ride sharing or hailing. People are increasingly adopting these alternate transportation services owing to their convenience and high cost associated in purchasing and maintaining private vehicles. For instance, SOCAR, a car sharing service provider, analyzed that car sharing can save about US$ 300 per month. This shift in trends has forced transportation service vendors to revaluate their strategies and focus on providing mobility services. Mobility as a service (MaaS) is a combination of various on-demand transport services which are offered through digital channels. It involves basic functions such as end-to-end trip planning, electronic ticketing, payment and others for hassle-free transportation. MaaS is a new business model which enables the service providers to cater customized transportation requirements by providing value added services along with basic functions for better customer engagement and retention. MaaS is adding more flexibility and variability into the supply side of transportation owing to which major automotive OEMs are partnering with mobility services providers. For instance, in 2019, China’s largest ride hailing player Didi Chuxing established a joint venture with Volkswagen Group for developing purpose-built vehicles with focus on fleet operations and fleet leasing. Thus, the transforming mobility requirements coupled with new business models adopted by automotive players is contributing towards the growth of Asia Pacific mobility as a service (MaaS) market.
The rising awareness regarding pollution and stringent government norms has decelerated private vehicle ownership in Asia Pacific region. World Health Organization (WHO) in its press release of May 2018 stated that around one third of total deaths due to air pollution are in Asia Pacific. The alarmingly rising pollution rate in this region has forced governments to adopt strict measures and introduce new initiatives to counter this rise. For instance, Supreme Court of India in 2018, out-ruled a verdict for restricting the sale of Bharat Stage IV vehicles from the beginning of April 2020 and directed the adoption of Bharat Stage VI. As the latest norms imply stringent restrictions of emission for automobile exhaust, the automobile makers are expected to refine their technology in compliance to Bharat Stage VI norms, thus inviting more expenditure, which ultimately is contributing towards increased prices of their products. In a similar instance, China Vehicle Technology Service Centre in a press release of 2018 announced suspension of more than 500 car models’ production from January 2019 to reduce emissions caused by these models. These factors have affected the private car sales in this region and bolstered use of shared mobility services. Owing to fall in availability of private cars, the ride sharing service providers in the region such as Grab, Didi Chuxing and others are expecting multi-fold rise in their annual revenues. Thus, the stringent pollution control norms leading to high vehicle prices and scarce availability of vehicles are anticipated to drive the mobility as a service (MaaS) market in Asia Pacific region.
Amidst the outbreak of coronavirus, the factories and manufacturing plants of automobiles are affected severely due to lockdowns imposed by governments and lack of man power. China is at the centre of automotive supply chains across Asia Pacific. Large number of electronic and other automotive components are manufactured in China which are then supplied across other Asian countries. The automobile OEMs and Tier1 and Tier2 suppliers are affected by the shortfall of these components, thus impacting product availability and disrupting automotive supply chains across China and other South East Asian countries. Thus, the soaring prices of vehicles and delay in rolling out new products has pushed residents to opt for mobility services for their commuting needs, thereby boosting the growth of mobility as a service (MaaS) market in Asia Pacific region.
Service Type Outlook:
Based on the type of service offered by mobility service providers, ride-hailing contributed largest share in the Asia Pacific mobility as a service (MaaS) market in 2018. The rising number of private and corporate trips in the region along with increasing number of start-ups providing ride-hailing services has contributed towards high share of ride-hailing in mobility as a service (MaaS) market. The ride hailing concept was introduced in Asia by Didi Chuxing of China in 2012 followed by Grab of Singapore. Didi Chuxing has claimed that it completed about 29 million rides each day in 2019. The growing tourism in Asia with 348 million arrivals in 2018, as per World Tourism Organization report of 2019, has contributed towards rise in number of trips/vehicle journeys in the region. Thus, the growing number of tourists coupled with rise in mobility service providers has boosted the growth of Asia Pacific mobility as a service (MaaS) market. Bike sharing is anticipated to show highest growth rate over the forecast years in mobility as a service (MaaS) market. India, Thailand, Vietnam and other Asian countries have high number of motorbike owners as compared to cars. With introduction of motorbike sharing services by Gojek in 2016 in Indonesia, the untapped low income market sector was included in the scope of mobility services in the region. Thus, the changing consumer behaviour towards adoption of economic solutions for transportation is anticipated to drive the growth of bike sharing in Asia Pacific mobility as a service (MaaS) market over forecast years.
Regional Outlook:
China dominated the Asia Pacific mobility as a service (MaaS) market in 2018, followed by India, Indonesia, Japan and others. The fast spread of urbanization and industrialization in these countries has pushed migration of people from villages to towns. As reported by United Nations, Department of Economic and Social Affairs in May 2018, about 68% of the world population would be settled in urban areas by 2050 with 90% of this increase taking place in Asia and Africa. The growing workforce of these countries living in cities has led to congestion in public transportations due to which mobility service providers have adopted new mobility business models. Urban planners are looking for alternatives to make people less vehicle centric and mobility as a service is serving as a viable solution for this purpose of reducing urban traffic.. China has adopted various measures by undertaking initiatives such as Road Space Rationing, car quota systems and others to limit the number of cars in the cities. This has pushed people to opt for mobility services, thus increasing its share in Asia Pacific mobility as a service (MaaS) market.
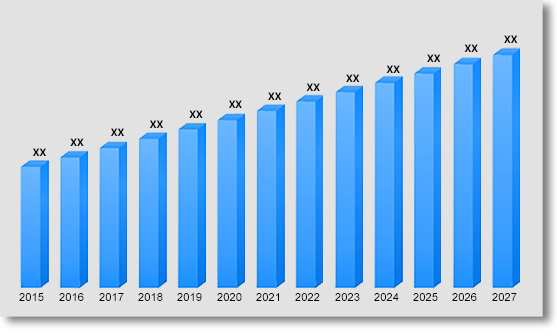
In terms of revenue, Asia Pacific mobility as a service (MaaS) market was valued at US$ 115,122.9 Mn in 2018 and reach US$ 238,448.8 Mn by 2027, growing at a CAGR of 8.5% over the forecast period. The study analyses the market in terms of revenue across all the major countries in the region.
Asia Pacific Mobility as a Service (MaaS) Market Revenue & Forecast, (US$ Million), 2015 – 2027
Competitive Landscape
The report provides both, qualitative and quantitative research of Asia Pacific mobility as a service (MaaS) market, as well as provides comprehensive insights and development methods adopted by the key contenders. The report also offers extensive research on the key players in this market and details on the competitiveness of these players. Key business strategies such as mergers and acquisitions (M&A), affiliations, collaborations, and contracts adopted by these major market participants are also recognized and analyzed in the report. For each company, the report studies their regional presence, competitors, service offerings and specification amongst others.
Some of the players operating in the Asia Pacific mobility as a service (MaaS) market are ANI Technologies Pvt. Ltd, Beijing Xiaoju Technology Co, Ltd., Citymapper, Grab Holdings Inc., Japan Taxi Co.,Ltd, MaaS Global Oy, MERU, Moovit Inc., oBike, PT Aplikasi Karya Anak Bangsa (brand Gojek) and Uber Technologies Inc. amongst others.
Asia Pacific Mobility as a Service (MaaS) Market:
- By Type of Service
- Self-driving Car Service
- Ride-Hailing
- Car Sharing
- Bike Sharing
- By Application Platform
- Android
- iOS
- By End User
- Government
- Private Firms
- Start ups
- Corporations
- By Countries
- China
- Japan
- India
- New Zealand
- Australia
- South Korea
- Indonesia
- Thailand
- Malaysia
- Singapore
- Vietnam
- Philippines
- Rest of Asia Pacific
Table of Contents
![]()
1.
Market Scope
1.1.
Market Segmentation
1.2.
Years Considered
1.2.1.
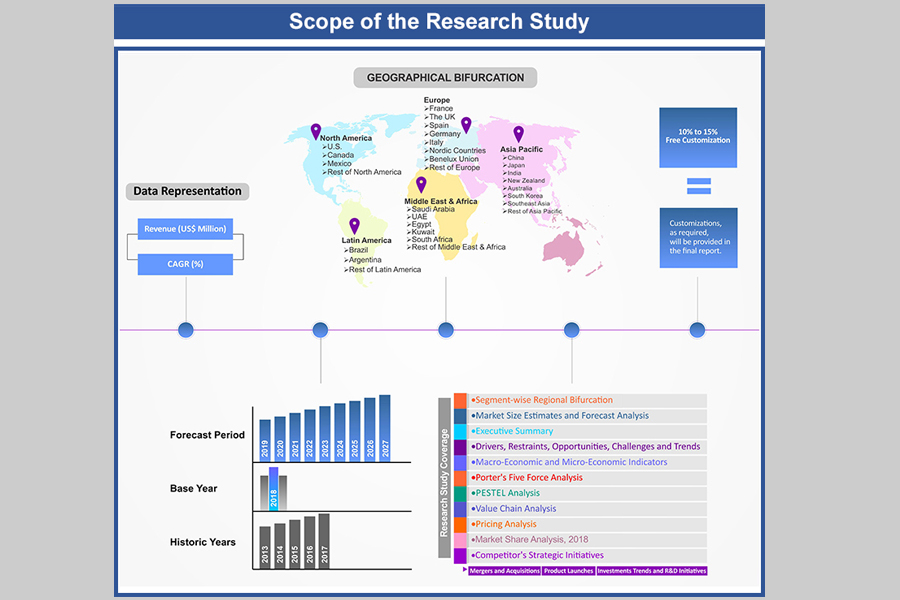
Historic Years: 2013 - 2017
1.2.2.
Base Year: 2018
1.2.3.
Forecast Years: 2019 – 2027
2.
Key Target Audiences
3.
Research Methodology
3.1.
Primary Research
3.1.1.
Research Questionnaire
3.1.2.
Asia Pacific Percentage Breakdown
3.1.3.
Primary Interviews: Key Opinion Leaders
(KOLs)
3.2.
Secondary Research
3.2.1.
Paid Databases
3.2.2.
Secondary Sources
3.3.
Market Size Estimates
3.3.1.
Top-Down Approach
3.3.2.
Bottom-Up Approach
3.4.
Data Triangulation Methodology
3.5.
Research Assumptions
4.
Recommendations and Insights
from AMI’s Perspective**
5.
Holistic Overview of Mobility
as a Service (MaaS) Market
6.
Market Synopsis: Mobility as a Service (MaaS) Market
7.
Mobility as a Service (MaaS)
Market Analysis: Qualitative Perspective
7.1.
Introduction
7.1.1.
Product Definition
7.1.2.
Industry Development
7.2.
Market Dynamics
7.2.1.
Drivers
7.2.2.
Restraints
7.2.3.
Opportunities
7.3.
Trends in Mobility as a Service (MaaS)
Market
7.4.
Market Determinants Radar Chart
7.5.
Macro-Economic and Micro-Economic
Indicators: Mobility as a Service (MaaS) Market
7.6.
Porter’s Five Force Analysis
8.
Asia Pacific Mobility as a
Service (MaaS) Market Analysis and Forecasts, 2019 - 2027
8.1.
Overview
8.1.1.
Asia Pacific Mobility as a Service
(MaaS) Market Revenue (US$ Mn)
8.2.
Asia Pacific Mobility as a Service
(MaaS) Market Revenue (US$ Mn) and Forecasts, By Type of Service
8.2.1.
Self-driving Car Service
8.2.2.
Ride-Hailing
8.2.3.
Car Sharing
8.2.4.
Bike Sharing
8.3.
Asia Pacific Mobility as a Service
(MaaS) Market Revenue (US$ Mn) and Forecasts, By Application Platform
8.3.1.
Android
8.3.2.
iOS
8.4.
Asia Pacific Mobility as a Service
(MaaS) Market Revenue (US$ Mn) and Forecasts, By End User
8.4.1.
Government
8.4.2.
Private Firms
8.4.2.1. Start ups
8.4.2.2. Corporations
8.5.
Asia Pacific Mobility as a Service
(MaaS) Market Revenue (US$ Mn) and Forecasts, By Country
8.5.1.
China
8.5.1.1. China Mobility as a Service (MaaS) Market Revenue (US$ Mn) and
Forecasts, By Type of Service
8.5.1.1.1.
Self-driving Car Service
8.5.1.1.2.
Ride-Hailing
8.5.1.1.3.
Car Sharing
8.5.1.1.4.
Bike Sharing
8.5.1.2. China Mobility as a Service (MaaS) Market Revenue (US$ Mn) and
Forecasts, By Application Platform
8.5.1.2.1.
Android
8.5.1.2.2.
iOS
8.5.1.3. China Mobility as a Service (MaaS) Market Revenue (US$ Mn) and
Forecasts, By End User
8.5.1.3.1.
Government
8.5.1.3.2.
Private Firms
8.5.1.3.2.1.
Start ups
8.5.1.3.2.2.
Corporations
8.5.2.
Japan
8.5.2.1. Japan Mobility as a Service (MaaS) Market Revenue (US$ Mn) and
Forecasts, By Type of Service
8.5.2.1.1.
Self-driving Car Service
8.5.2.1.2.
Ride-Hailing
8.5.2.1.3.
Car Sharing
8.5.2.1.4.
Bike Sharing
8.5.2.2. Japan Mobility as a Service (MaaS) Market Revenue (US$ Mn) and
Forecasts, By Application Platform
8.5.2.2.1.
Android
8.5.2.2.2.
iOS
8.5.2.3. Japan Mobility as a Service (MaaS) Market Revenue (US$ Mn) and
Forecasts, By End User
8.5.2.3.1.
Government
8.5.2.3.2.
Private Firms
8.5.2.3.2.1.
Start ups
8.5.2.3.2.2.
Corporations
8.5.3.
India
8.5.3.1. India Mobility as a Service (MaaS) Market Revenue (US$ Mn) and
Forecasts, By Type of Service
8.5.3.1.1.
Self-driving Car Service
8.5.3.1.2.
Ride-Hailing
8.5.3.1.3.
Car Sharing
8.5.3.1.4.
Bike Sharing
8.5.3.2. India Mobility as a Service (MaaS) Market Revenue (US$ Mn) and
Forecasts, By Application Platform
8.5.3.2.1.
Android
8.5.3.2.2.
iOS
8.5.3.3. India Mobility as a Service (MaaS) Market Revenue (US$ Mn) and
Forecasts, By End User
8.5.3.3.1.
Government
8.5.3.3.2.
Private Firms
8.5.3.3.2.1.
Start ups
8.5.3.3.2.2.
Corporations
8.5.4.
New Zealand
8.5.4.1. New Zealand Mobility as a Service (MaaS) Market Revenue (US$
Mn) and Forecasts, By Type of Service
8.5.4.1.1.
Self-driving Car Service
8.5.4.1.2.
Ride-Hailing
8.5.4.1.3.
Car Sharing
8.5.4.1.4.
Bike Sharing
8.5.4.2. New Zealand Mobility as a Service (MaaS) Market Revenue (US$
Mn) and Forecasts, By Application Platform
8.5.4.2.1.
Android
8.5.4.2.2.
iOS
8.5.4.3. New Zealand Mobility as a Service (MaaS) Market Revenue (US$
Mn) and Forecasts, By End User
8.5.4.3.1.
Government
8.5.4.3.2.
Private Firms
8.5.4.3.2.1.
Start ups
8.5.4.3.2.2.
Corporations
8.5.5.
Australia
8.5.5.1. Australia Mobility as a Service (MaaS) Market Revenue (US$ Mn)
and Forecasts, By Type of Service
8.5.5.1.1.
Self-driving Car Service
8.5.5.1.2.
Ride-Hailing
8.5.5.1.3.
Car Sharing
8.5.5.1.4.
Bike Sharing
8.5.5.2. Australia Mobility as a Service (MaaS) Market Revenue (US$ Mn)
and Forecasts, By Application Platform
8.5.5.2.1.
Android
8.5.5.2.2.
iOS
8.5.5.3. Australia Mobility as a Service (MaaS) Market Revenue (US$ Mn)
and Forecasts, By End User
8.5.5.3.1.
Government
8.5.5.3.2.
Private Firms
8.5.5.3.2.1.
Start ups
8.5.5.3.2.2.
Corporations
8.5.6.
South Korea
8.5.6.1. South Korea Mobility as a Service (MaaS) Market Revenue (US$
Mn) and Forecasts, By Type of Service
8.5.6.1.1.
Self-driving Car Service
8.5.6.1.2.
Ride-Hailing
8.5.6.1.3.
Car Sharing
8.5.6.1.4.
Bike Sharing
8.5.6.2. South Korea Mobility as a Service (MaaS) Market Revenue (US$
Mn) and Forecasts, By Application Platform
8.5.6.2.1.
Android
8.5.6.2.2.
iOS
8.5.6.3. South Korea Mobility as a Service (MaaS) Market Revenue (US$
Mn) and Forecasts, By End User
8.5.6.3.1.
Government
8.5.6.3.2.
Private Firms
8.5.6.3.2.1.
Start ups
8.5.6.3.2.2.
Corporations
8.5.7.
Indonesia
8.5.7.1. Indonesia Mobility as a Service (MaaS) Market Revenue (US$ Mn)
and Forecasts, By Type of Service
8.5.7.1.1.
Self-driving Car Service
8.5.7.1.2.
Ride-Hailing
8.5.7.1.3.
Car Sharing
8.5.7.1.4.
Bike Sharing
8.5.7.2. Indonesia Mobility as a Service (MaaS) Market Revenue (US$ Mn)
and Forecasts, By Application Platform
8.5.7.2.1.
Android
8.5.7.2.2.
iOS
8.5.7.3. Indonesia Mobility as a Service (MaaS) Market Revenue (US$ Mn)
and Forecasts, By End User
8.5.7.3.1.
Government
8.5.7.3.2.
Private Firms
8.5.7.3.2.1.
Start ups
8.5.7.3.2.2.
Corporations
8.5.8.
Thailand
8.5.8.1. Thailand Mobility as a Service (MaaS) Market Revenue (US$ Mn)
and Forecasts, By Type of Service
8.5.8.1.1.
Self-driving Car Service
8.5.8.1.2.
Ride-Hailing
8.5.8.1.3.
Car Sharing
8.5.8.1.4.
Bike Sharing
8.5.8.2. Thailand Mobility as a Service (MaaS) Market Revenue (US$ Mn)
and Forecasts, By Application Platform
8.5.8.2.1.
Android
8.5.8.2.2.
iOS
8.5.8.3. Thailand Mobility as a Service (MaaS) Market Revenue (US$ Mn)
and Forecasts, By End User
8.5.8.3.1.
Government
8.5.8.3.2.
Private Firms
8.5.8.3.2.1.
Start ups
8.5.8.3.2.2.
Corporations
8.5.9.
Singapore
8.5.9.1. Singapore Mobility as a Service (MaaS) Market Revenue (US$ Mn)
and Forecasts, By Type of Service
8.5.9.1.1.
Self-driving Car Service
8.5.9.1.2.
Ride-Hailing
8.5.9.1.3.
Car Sharing
8.5.9.1.4.
Bike Sharing
8.5.9.2. Singapore Mobility as a Service (MaaS) Market Revenue (US$ Mn)
and Forecasts, By Application Platform
8.5.9.2.1.
Android
8.5.9.2.2.
iOS
8.5.9.3. Singapore Mobility as a Service (MaaS) Market Revenue (US$ Mn)
and Forecasts, By End User
8.5.9.3.1.
Government
8.5.9.3.2.
Private Firms
8.5.9.3.2.1.
Start ups
8.5.9.3.2.2.
Corporations
8.5.10.
Malaysia
8.5.10.1. Malaysia Mobility as a Service (MaaS) Market Revenue (US$ Mn)
and Forecasts, By Type of Service
8.5.10.1.1.
Self-driving Car Service
8.5.10.1.2.
Ride-Hailing
8.5.10.1.3.
Car Sharing
8.5.10.1.4.
Bike Sharing
8.5.10.2. Malaysia Mobility as a Service (MaaS) Market Revenue (US$ Mn)
and Forecasts, By Application Platform
8.5.10.2.1.
Android
8.5.10.2.2.
iOS
8.5.10.3. Malaysia Mobility as a Service (MaaS) Market Revenue (US$ Mn)
and Forecasts, By End User
8.5.10.3.1.
Government
8.5.10.3.2.
Private Firms
8.5.10.3.2.1.
Start ups
8.5.10.3.2.2.
Corporations
8.5.11.
Vietnam
8.5.11.1. Vietnam Mobility as a Service (MaaS) Market Revenue (US$ Mn)
and Forecasts, By Type of Service
8.5.11.1.1.
Self-driving Car Service
8.5.11.1.2.
Ride-Hailing
8.5.11.1.3.
Car Sharing
8.5.11.1.4.
Bike Sharing
8.5.11.2. Vietnam Mobility as a Service (MaaS) Market Revenue (US$ Mn) and
Forecasts, By Application Platform
8.5.11.2.1.
Android
8.5.11.2.2.
iOS
8.5.11.3. Vietnam Mobility as a Service (MaaS) Market Revenue (US$ Mn)
and Forecasts, By End User
8.5.11.3.1.
Government
8.5.11.3.2.
Private Firms
8.5.11.3.2.1.
Start ups
8.5.11.3.2.2.
Corporations
8.5.12.
Philippines
8.5.12.1. Philippines Mobility as a Service (MaaS) Market Revenue (US$
Mn) and Forecasts, By Type of Service
8.5.12.1.1.
Self-driving Car Service
8.5.12.1.2.
Ride-Hailing
8.5.12.1.3.
Car Sharing
8.5.12.1.4.
Bike Sharing
8.5.12.2. Philippines Mobility as a Service (MaaS) Market Revenue (US$
Mn) and Forecasts, By Application Platform
8.5.12.2.1.
Android
8.5.12.2.2.
iOS
8.5.12.3. Philippines Mobility as a Service (MaaS) Market Revenue (US$
Mn) and Forecasts, By End User
8.5.12.3.1.
Government
8.5.12.3.2.
Private Firms
8.5.12.3.2.1.
Start ups
8.5.12.3.2.2.
Corporations
8.5.13.
Rest of Asia Pacific
8.5.13.1. Rest of Asia Pacific Mobility as a Service (MaaS) Market
Revenue (US$ Mn) and Forecasts, By Type of Service
8.5.13.1.1.
Self-driving Car Service
8.5.13.1.2.
Ride-Hailing
8.5.13.1.3.
Car Sharing
8.5.13.1.4.
Bike Sharing
8.5.13.2. Rest of Asia Pacific Mobility as a Service (MaaS) Market
Revenue (US$ Mn) and Forecasts, By Application Platform
8.5.13.2.1.
Android
8.5.13.2.2.
iOS
8.5.13.3. Rest of Asia Pacific Mobility as a Service (MaaS) Market
Revenue (US$ Mn) and Forecasts, By End User
8.5.13.3.1.
Government
8.5.13.3.2.
Private Firms
8.5.13.3.2.1.
Start ups
8.5.13.3.2.2.
Corporations
8.6.
Key Segment for Channeling Investments
8.6.1.
By Country
8.6.2.
By Type of Service
8.6.3.
By Application Platform
8.6.4.
By End User
9.
Competitive Benchmarking
9.1.
Market Share Analysis, 2018
9.2.
Asia Pacific Presence and Growth Strategies
9.2.1.
Mergers and Acquisitions
9.2.2.
Product Launches
9.2.3.
Investments Trends
9.2.4.
R&D Initiatives
10. Player Profiles
10.1.
ANI Technologies Pvt. Ltd
10.1.1.
Company Details
10.1.2.
Company Overview
10.1.3.
Product Offerings
10.1.4.
Key Developments
10.1.5.
Financial Analysis
10.1.6.
SWOT Analysis
10.1.7.
Business Strategies
10.2.
Beijing Xiaoju Technology Co, Ltd.
10.2.1.
Company Details
10.2.2.
Company Overview
10.2.3.
Product Offerings
10.2.4.
Key Developments
10.2.5.
Financial Analysis
10.2.6.
SWOT Analysis
10.2.7.
Business Strategies
10.3.
Citymapper
10.3.1.
Company Details
10.3.2.
Company Overview
10.3.3.
Product Offerings
10.3.4.
Key Developments
10.3.5.
Financial Analysis
10.3.6.
SWOT Analysis
10.3.7.
Business Strategies
10.4.
Grab Holdings Inc.
10.4.1.
Company Details
10.4.2.
Company Overview
10.4.3.
Product Offerings
10.4.4.
Key Developments
10.4.5.
Financial Analysis
10.4.6.
SWOT Analysis
10.4.7. Business
Strategies
10.5.
Japan Taxi Co.,Ltd
10.5.1.
Company Details
10.5.2.
Company Overview
10.5.3.
Product Offerings
10.5.4.
Key Developments
10.5.5.
Financial Analysis
10.5.6.
SWOT Analysis
10.5.7.
Business Strategies
10.6.
MaaS Global Oy
10.6.1.
Company Details
10.6.2.
Company Overview
10.6.3.
Product Offerings
10.6.4.
Key Developments
10.6.5.
Financial Analysis
10.6.6.
SWOT Analysis
10.6.7. Business
Strategies
10.7.
MERU
10.7.1.
Company Details
10.7.2.
Company Overview
10.7.3.
Product Offerings
10.7.4.
Key Developments
10.7.5.
Financial Analysis
10.7.6.
SWOT Analysis
10.7.7.
Business Strategies
10.8.
Moovit Inc
10.8.1.
Company Details
10.8.2.
Company Overview
10.8.3.
Product Offerings
10.8.4.
Key Developments
10.8.5.
Financial Analysis
10.8.6.
SWOT Analysis
10.8.7. Business
Strategies
10.9.
oBike
10.9.1.
Company Details
10.9.2.
Company Overview
10.9.3.
Product Offerings
10.9.4.
Key Developments
10.9.5.
Financial Analysis
10.9.6.
SWOT Analysis
10.9.7.
Business Strategies
10.10. PT Aplikasi Karya Anak Bangsa (Brand Gojek)
10.10.1.
Company Details
10.10.2.
Company Overview
10.10.3.
Product Offerings
10.10.4.
Key Developments
10.10.5.
Financial Analysis
10.10.6.
SWOT Analysis
10.10.7.
Business Strategies
10.11.
Uber Technologies Inc.
10.11.1.
Company Details
10.11.2.
Company Overview
10.11.3.
Product Offerings
10.11.4.
Key Developments
10.11.5.
Financial Analysis
10.11.6.
SWOT Analysis
10.11.7.
Business Strategies
10.12.
Other Market Participants
11. Key Findings
Note: This ToC is tentative and can
be changed according to the research study conducted during the course of
report completion.
**Exclusive for Multi-User and
Enterprise User
At Absolute Markets Insights, we are engaged in building both global as well as country specific reports. As a result, the approach taken for deriving the estimation and forecast for a specific country is a bit unique and different in comparison to the global research studies. In this case, we not only study the concerned market factors & trends prevailing in a particular country (from secondary research) but we also tend to calculate the actual market size & forecast from the revenue generated from the market participants involved in manufacturing or distributing the any concerned product. These companies can also be service providers. For analyzing any country specifically, we do consider the growth factors prevailing under the states/cities/county for the same. For instance, if we are analyzing an industry specific to United States, we primarily need to study about the states present under the same(where the product/service has the highest growth). Similar analysis will be followed by other countries. Our scope of the report changes with different markets.
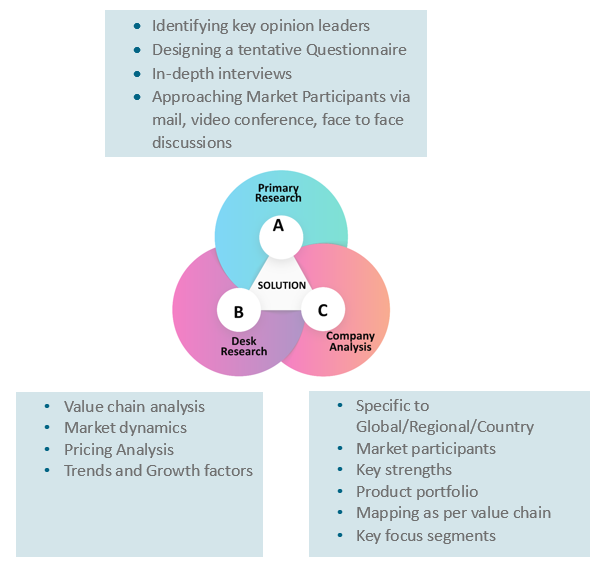
Our research study is mainly implement through a mix of both secondary and primary research. Various sources such as industry magazines, trade journals, and government websites and trade associations are reviewed for gathering precise data. Primary interviews are conducted to validate the market size derived from secondary research. Industry experts, major manufacturers and distributors are contacted for further validation purpose on the current market penetration and growth trends.
Prominent participants in our primary research process include:
- Key Opinion Leaders namely the CEOs, CSOs, VPs, purchasing managers, amongst others
- Research and development participants, distributors/suppliers and subject matter experts
Secondary Research includes data extracted from paid data sources:
- Reuters
- Factiva
- Bloomberg
- One Source
- Hoovers
Research Methodology
Key Inclusions
Why Absolute Markets Insights?
An effective strategy is the entity that influences a business to stand out of the crowd. An organization with a phenomenal strategy for success dependably has the edge over the rivals in the market. It offers the organizations a head start in planning their strategy. Absolute Market Insights is the new initiation in the industry that will furnish you with the lead your business needs. Absolute Market Insights is the best destination for your business intelligence and analytical solutions; essentially because our qualitative and quantitative sources of information are competent to give one-stop solutions. We inventively combine qualitative and quantitative research in accurate proportions to have the best report, which not only gives the most recent insights but also assists you to grow.
