
Nonlinear Optical Crystals Market By Product (KTP, BBO, LBO, CLBO, DKDP, ADP, KDP, Others); By Application (Laser Technology, Medical, Underwater Photography, Optical Communication, Optical Ranging, Nuclear Fusion, Others); By Region (U.S., Canada, Mexico, Rest of North America, UK, France, Germany, Italy, Spain, Benelux Union, Nordic Countries , Rest of Europe, China, Japan, India, South Korea, Southeast Asia, Australia, New Zealand, Rest of Asia Pacific, Brazil, Argentina Rest of Latin America, GCC countries, Southern Africa, Rest of Middle East & Africa) – Global Insights, Growth, Size, Comparative Analysis, Trends and Forecast, 2019 - 2027
Industry Trends
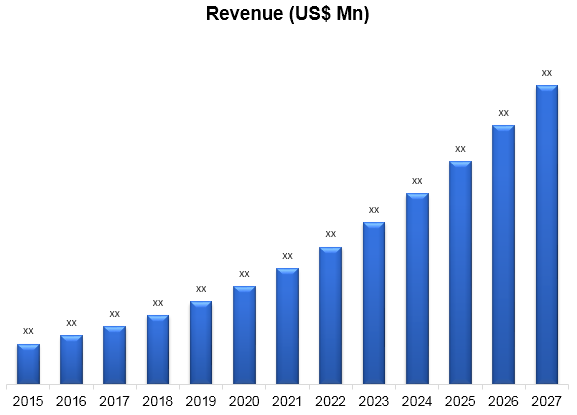
Global nonlinear optical crystals market was estimated to be 3238.90 million in 2018 and is expected to reach US$ 11001.68 million by 2027, growing at an estimated rate of 14.6% over the forecast period. Nonlinear optical devices use nonlinear refraction index dependence on the applied electric field for the processing of other frequencies. This involves either harmonic production or frequency shift. In combination with laser deployment, field growth has been increased, because laser beams have the energy density required to generate nonlinear results. The clear benefit of nonlinear optical materials for lasers and electrooptics became evident in the early days of lasers as it permitted their narrow spectral range to broaden. Today, for particular wavelengths, there are a big number of nonlinear optical materials with different damage thresholds and different optical features. Currently, there are a large number of nonlinear optical materials with different thresholds of damage and specific optical properties for particular wavelengths. Nonlinear optical (NLO) crystals have the purpose of generating tunable laser beams that cover optical spectrum areas by conversion of frequency. Currently, the commercially available crystals are capable of harmonic generation in the UV to near-IR field. In practical applications, efforts have been made to create high-quality crystals to boost their laser output and to find fresh crystals to expand spectrum range to deep UV and mid-IR areas.
The global nonlinear optical crystals market growth is ascribed to enhanced product demand in LEDs and enhanced R&D activities in different regions. Furthermore, owing to its outstanding characteristics including unique optical dispersion and outstanding control of light behaviour, nonlinear optical crystals market demand is also growing. It is anticipated that advancing green photonics technologies and financial enhancement in emerging economies will bring huge potential for growth. Growing applications of LEDs, image sensors, laser, and solar cells have in the last five years fostered the nonlinear optical crystal market.
Due to its broad implementation in the field of laser technology, optical communication and information storage technology, nonlinear optics are receiving growing attention. Nonlinear optics is entirely a new effect that transforms light from one wavelength to another. The development of new wavelength light has similar mechanism as that of nonlinear crystal electrons. Electrons in a nonlinear crystal are possess potential energy, acting like a spring, keeping the electrons in the crystal at the lattice point. In the global nonlinear optical crystals market, the laser technology application segment retained the biggest market.
Application Insights
In application category, laser technology is estimated to hold significant share in the market owing to the huge technology outbreak in the field. Laser research has been applied in various fields which also involves biomedical applications such as neurological implants, DNA analysis, and regeneration of cells and tissues. Years ago, the military research department was the most prominent recipient of this invention. It has little effect in the modern world as the technology has turned their focus into an economically effective policy for micro-manufacturing, accuracy engineering and any kind of scaling up or down of a particular procedure. Laser micromachining sponsored another aspect for precise calculation assembly of the objects.
Regional Insights
North America nonlinear optical crystals market has progressively evolved, and significant gains are expected to be recorded in the coming years. The introduction of various high-tech technologies and innovations has diversified the scope of commodity industry applications which has a favourable view of the sector's demand. Europe is booming at a considerable pace on the nonlinear optical crystals market, and is expected to boom at moderate CAGR due to increased R&D in the area. Several industry leaders are trying to innovate fresh technologies which enhance the applications of the product.
Nonlinear Optical Crystals Market Revenue & Forecast, (US$ Million), 2015 – 2027
Competitive Landscape
The report provides both, qualitative and quantitative research of nonlinear optical crystals market, as well as provides comprehensive insights and development methods adopted by the key contenders. The report also offers extensive research on the key players in this market and details on the competitiveness of these players. Key business strategies such as mergers and acquisitions (M&A), affiliations, collaborations, and contracts adopted by these major market participants are also recognized and analysed in the report. For each company, the report studies their global presence, competitors, service offerings and specification amongst others.
The major industry participants in the global nonlinear optical crystals market include Hangzhou Shalom EO, EKSMA Optics, Red Optronics, Cristal Laser S.A, Raicol Crystals Ltd., Newlight Photonics Inc., CASTECH, Inrad Optics Inc., GAMDAN Optics, Gooch & Housego, WTS PHOTONICS, HC Photonics Corp., and Covesion among others.

Nonlinear Optical Crystals Market:
- By Product
- KTP
- BBO
- LBO
- CLBO
- DKDP
- ADP
- KDP
- Others
- By Application
- Laser Technology
- Medical
- Underwater Photography
- Optical Communication
- Optical Ranging
- Nuclear Fusion
- Others
- By Geography
- North America
- US
- Canada
- Mexico
- Europe
- France
- The UK
- Spain
- Germany
- Italy
- Nordic Countries
- Benelux Union
- Rest of Europe
- Asia Pacific
- China
- Japan
- India
- New Zealand
- Australia
- South Korea
- Southeast Asia
- Rest of Asia Pacific
- Middle East and Africa
- Saudi Arabia
- UAE
- Egypt
- Kuwait
- South Africa
- Rest of Middle East & Africa
- Latin America
- Brazil
- Argentina
- Rest of Latin America
- North America
Table
of Contents
![]()
1. Market
Scope
1.1. Market
Segmentation
1.2. Years
Considered
1.2.1. Historic
Years: 2015 - 2017
1.2.2. Base
Year: 2018
1.2.3. Forecast
Years: 2019 – 2027
2. Key Target
Audiences
3. Research
Methodology
3.1. Primary
Research
3.1.1. Research
Questionnaire
3.1.2. Global
Percentage Breakdown
3.1.3. Primary
Interviews: Key Opinion Leaders (KOLs)
3.2. Secondary
Research
3.2.1. Paid
Databases
3.2.2. Secondary
Sources
3.3. Market
Size Estimates
3.3.1. Top-Down
Approach
3.3.2. Bottom-Up
Approach
3.4. Data
Triangulation Methodology
3.5. Research
Assumptions
4. Recommendations
and Insights from AMI’s Perspective**
5. Holistic
Overview of Nonlinear Optical Crystals Market
6. Market
Synopsis: Nonlinear Optical Crystals
Market
7. Nonlinear
Optical Crystals Market Analysis: Qualitative Perspective
7.1. Introduction
7.1.1. Product
Definition
7.1.2. Industry
Development
7.2. Market
Dynamics
7.2.1. Drivers
7.2.2. Restraints
7.2.3. Opportunities
7.3. Trends in
Nonlinear Optical Crystals Market
7.4. Market
Determinants Radar Chart
7.5. Macro-Economic
and Micro-Economic Indicators: Nonlinear Optical Crystals Market
8. Global
Nonlinear Optical Crystals Market Analysis and Forecasts, 2019 – 2027
8.1. Overview
8.1.1. Global
Nonlinear Optical Crystals Market Revenue (US$ Mn)
8.2. Global
Nonlinear Optical Crystals Market Revenue (US$ Mn) and Forecasts, By Product
8.2.1. KTP
8.2.1.1. Definition
8.2.1.2. Market
Estimation and Penetration, 2015 – 2018
8.2.1.3. Market
Forecast, 2019 – 2027
8.2.1.4. Compound
Annual Growth Rate (CAGR)
8.2.1.5. Regional
Bifurcation
8.2.1.5.1. North
America
8.2.1.5.1.1. Market
Estimation, 2015 – 2018
8.2.1.5.1.2. Market
Forecast, 2019 – 2027
8.2.1.5.2. Europe
8.2.1.5.2.1. Market
Estimation, 2015 – 2018
8.2.1.5.2.2. Market
Forecast, 2019 – 2027
8.2.1.5.3. Asia
Pacific
8.2.1.5.3.1. Market
Estimation, 2015 – 2018
8.2.1.5.3.2. Market
Forecast, 2019 – 2027
8.2.1.5.4. Middle
East and Africa
8.2.1.5.4.1. Market
Estimation, 2015 – 2018
8.2.1.5.4.2. Market
Forecast, 2019 – 2027
8.2.1.5.5. Latin
America
8.2.1.5.5.1. Market
Estimation, 2015 – 2018
8.2.1.5.5.2. Market
Forecast, 2019 – 2027
8.2.2. BBO
8.2.2.1. Definition
8.2.2.2. Market
Estimation and Penetration, 2015 – 2018
8.2.2.3. Market
Forecast, 2019 – 2027
8.2.2.4. Compound
Annual Growth Rate (CAGR)
8.2.2.5. Regional
Bifurcation
8.2.2.5.1. North
America
8.2.2.5.1.1. Market
Estimation, 2015 – 2018
8.2.2.5.1.2. Market
Forecast, 2019 – 2027
8.2.2.5.2. Europe
8.2.2.5.2.1. Market
Estimation, 2015 – 2018
8.2.2.5.2.2. Market
Forecast, 2019 – 2027
8.2.2.5.3. Asia
Pacific
8.2.2.5.3.1. Market
Estimation, 2015 – 2018
8.2.2.5.3.2. Market
Forecast, 2019 – 2027
8.2.2.5.4. Middle
East and Africa
8.2.2.5.4.1. Market
Estimation, 2015 – 2018
8.2.2.5.4.2. Market
Forecast, 2019 – 2027
8.2.2.5.5. Latin
America
8.2.2.5.5.1. Market
Estimation, 2015 – 2018
8.2.2.5.5.2. Market
Forecast, 2019 – 2027
8.2.3. LBO
8.2.3.1. Definition
8.2.3.2. Market
Estimation and Penetration, 2015 – 2018
8.2.3.3. Market
Forecast, 2019 – 2027
8.2.3.4. Compound
Annual Growth Rate (CAGR)
8.2.3.5. Regional
Bifurcation
8.2.3.5.1. North
America
8.2.3.5.1.1. Market
Estimation, 2015 – 2018
8.2.3.5.1.2. Market
Forecast, 2019 – 2027
8.2.3.5.2. Europe
8.2.3.5.2.1. Market
Estimation, 2015 – 2018
8.2.3.5.2.2. Market
Forecast, 2019 – 2027
8.2.3.5.3. Asia
Pacific
8.2.3.5.3.1. Market
Estimation, 2015 – 2018
8.2.3.5.3.2. Market
Forecast, 2019 – 2027
8.2.3.5.4. Middle
East and Africa
8.2.3.5.4.1. Market
Estimation, 2015 – 2018
8.2.3.5.4.2. Market
Forecast, 2019 – 2027
8.2.3.5.5. Latin
America
8.2.3.5.5.1. Market
Estimation, 2015 – 2018
8.2.3.5.5.2. Market
Forecast, 2019 – 2027
8.2.4. CLBO
8.2.4.1. Definition
8.2.4.2. Market
Estimation and Penetration, 2015 – 2018
8.2.4.3. Market
Forecast, 2019 – 2027
8.2.4.4. Compound
Annual Growth Rate (CAGR)
8.2.4.5. Regional
Bifurcation
8.2.4.5.1. North
America
8.2.4.5.1.1. Market
Estimation, 2015 – 2018
8.2.4.5.1.2. Market
Forecast, 2019 – 2027
8.2.4.5.2. Europe
8.2.4.5.2.1. Market
Estimation, 2015 – 2018
8.2.4.5.2.2. Market
Forecast, 2019 – 2027
8.2.4.5.3. Asia
Pacific
8.2.4.5.3.1. Market
Estimation, 2015 – 2018
8.2.4.5.3.2. Market
Forecast, 2019 – 2027
8.2.4.5.4. Middle
East and Africa
8.2.4.5.4.1. Market
Estimation, 2015 – 2018
8.2.4.5.4.2. Market
Forecast, 2019 – 2027
8.2.4.5.5. Latin
America
8.2.4.5.5.1. Market
Estimation, 2015 – 2018
8.2.4.5.5.2. Market
Forecast, 2019 – 2027
8.2.5. DKDP
8.2.5.1. Definition
8.2.5.2. Market
Estimation and Penetration, 2015 – 2018
8.2.5.3. Market
Forecast, 2019 – 2027
8.2.5.4. Compound
Annual Growth Rate (CAGR)
8.2.5.5. Regional
Bifurcation
8.2.5.5.1. North
America
8.2.5.5.1.1. Market
Estimation, 2015 – 2018
8.2.5.5.1.2. Market
Forecast, 2019 – 2027
8.2.5.5.2. Europe
8.2.5.5.2.1. Market
Estimation, 2015 – 2018
8.2.5.5.2.2. Market
Forecast, 2019 – 2027
8.2.5.5.3. Asia
Pacific
8.2.5.5.3.1. Market
Estimation, 2015 – 2018
8.2.5.5.3.2. Market
Forecast, 2019 – 2027
8.2.5.5.4. Middle
East and Africa
8.2.5.5.4.1. Market
Estimation, 2015 – 2018
8.2.5.5.4.2. Market
Forecast, 2019 – 2027
8.2.5.5.5. Latin
America
8.2.5.5.5.1. Market
Estimation, 2015 – 2018
8.2.5.5.5.2. Market
Forecast, 2019 – 2027
8.2.6. ADP
8.2.6.1. Definition
8.2.6.2. Market
Estimation and Penetration, 2015 – 2018
8.2.6.3. Market
Forecast, 2019 – 2027
8.2.6.4. Compound
Annual Growth Rate (CAGR)
8.2.6.5. Regional
Bifurcation
8.2.6.5.1. North
America
8.2.6.5.1.1. Market
Estimation, 2015 – 2018
8.2.6.5.1.2. Market
Forecast, 2019 – 2027
8.2.6.5.2. Europe
8.2.6.5.2.1. Market
Estimation, 2015 – 2018
8.2.6.5.2.2. Market
Forecast, 2019 – 2027
8.2.6.5.3. Asia
Pacific
8.2.6.5.3.1. Market
Estimation, 2015 – 2018
8.2.6.5.3.2. Market
Forecast, 2019 – 2027
8.2.6.5.4. Middle
East and Africa
8.2.6.5.4.1. Market
Estimation, 2015 – 2018
8.2.6.5.4.2. Market
Forecast, 2019 – 2027
8.2.6.5.5. Latin
America
8.2.6.5.5.1. Market
Estimation, 2015 – 2018
8.2.6.5.5.2. Market
Forecast, 2019 – 2027
8.2.7. KDP
8.2.7.1. Definition
8.2.7.2. Market
Estimation and Penetration, 2015 – 2018
8.2.7.3. Market
Forecast, 2019 – 2027
8.2.7.4. Compound
Annual Growth Rate (CAGR)
8.2.7.5. Regional
Bifurcation
8.2.7.5.1. North
America
8.2.7.5.1.1. Market
Estimation, 2015 – 2018
8.2.7.5.1.2. Market
Forecast, 2019 – 2027
8.2.7.5.2. Europe
8.2.7.5.2.1. Market
Estimation, 2015 – 2018
8.2.7.5.2.2. Market
Forecast, 2019 – 2027
8.2.7.5.3. Asia
Pacific
8.2.7.5.3.1. Market
Estimation, 2015 – 2018
8.2.7.5.3.2. Market
Forecast, 2019 – 2027
8.2.7.5.4. Middle
East and Africa
8.2.7.5.4.1. Market
Estimation, 2015 – 2018
8.2.7.5.4.2. Market
Forecast, 2019 – 2027
8.2.7.5.5. Latin
America
8.2.7.5.5.1. Market
Estimation, 2015 – 2018
8.2.7.5.5.2. Market
Forecast, 2019 – 2027
8.2.8. Others
8.2.8.1. Definition
8.2.8.2. Market
Estimation and Penetration, 2015 – 2018
8.2.8.3. Market
Forecast, 2019 – 2027
8.2.8.4. Compound
Annual Growth Rate (CAGR)
8.2.8.5. Regional
Bifurcation
8.2.8.5.1. North
America
8.2.8.5.1.1. Market
Estimation, 2015 – 2018
8.2.8.5.1.2. Market
Forecast, 2019 – 2027
8.2.8.5.2. Europe
8.2.8.5.2.1. Market
Estimation, 2015 – 2018
8.2.8.5.2.2. Market
Forecast, 2019 – 2027
8.2.8.5.3. Asia
Pacific
8.2.8.5.3.1. Market
Estimation, 2015 – 2018
8.2.8.5.3.2. Market
Forecast, 2019 – 2027
8.2.8.5.4. Middle
East and Africa
8.2.8.5.4.1. Market
Estimation, 2015 – 2018
8.2.8.5.4.2. Market
Forecast, 2019 – 2027
8.2.8.5.5. Latin
America
8.2.8.5.5.1. Market
Estimation, 2015 – 2018
8.2.8.5.5.2. Market
Forecast, 2019 – 2027
8.3. Key
Segment for Channeling Investments
8.3.1. By
Product
9. Global
Nonlinear Optical Crystals Market Analysis and Forecasts, 2019 – 2027
9.1. Overview
9.2. Global
Nonlinear Optical Crystals Market Revenue (US$ Mn) and Forecasts, By
Application
9.2.1. Laser
Technology
9.2.1.1. Definition
9.2.1.2. Market
Estimation and Penetration, 2015 – 2018
9.2.1.3. Market
Forecast, 2019 – 2027
9.2.1.4. Compound
Annual Growth Rate (CAGR)
9.2.1.5. Regional
Bifurcation
9.2.1.5.1. North
America
9.2.1.5.1.1. Market
Estimation, 2015 – 2018
9.2.1.5.1.2. Market
Forecast, 2019 – 2027
9.2.1.5.2. Europe
9.2.1.5.2.1. Market
Estimation, 2015 – 2018
9.2.1.5.2.2. Market
Forecast, 2019 – 2027
9.2.1.5.3. Asia
Pacific
9.2.1.5.3.1. Market
Estimation, 2015 – 2018
9.2.1.5.3.2. Market
Forecast, 2019 – 2027
9.2.1.5.4. Middle
East and Africa
9.2.1.5.4.1. Market
Estimation, 2015 – 2018
9.2.1.5.4.2. Market
Forecast, 2019 – 2027
9.2.1.5.5. Latin
America
9.2.1.5.5.1. Market
Estimation, 2015 – 2018
9.2.1.5.5.2. Market
Forecast, 2019 – 2027
9.2.2. Medical
9.2.2.1. Definition
9.2.2.2. Market
Estimation and Penetration, 2015 – 2018
9.2.2.3. Market
Forecast, 2019 – 2027
9.2.2.4. Compound
Annual Growth Rate (CAGR)
9.2.2.5. Regional
Bifurcation
9.2.2.5.1. North
America
9.2.2.5.1.1. Market
Estimation, 2015 – 2018
9.2.2.5.1.2. Market
Forecast, 2019 – 2027
9.2.2.5.2. Europe
9.2.2.5.2.1. Market
Estimation, 2015 – 2018
9.2.2.5.2.2. Market
Forecast, 2019 – 2027
9.2.2.5.3. Asia
Pacific
9.2.2.5.3.1. Market
Estimation, 2015 – 2018
9.2.2.5.3.2. Market
Forecast, 2019 – 2027
9.2.2.5.4. Middle
East and Africa
9.2.2.5.4.1. Market
Estimation, 2015 – 2018
9.2.2.5.4.2. Market
Forecast, 2019 – 2027
9.2.2.5.5. Latin
America
9.2.2.5.5.1. Market
Estimation, 2015 – 2018
9.2.2.5.5.2. Market
Forecast, 2019 – 2027
9.2.3. Underwater
Photography
9.2.3.1. Definition
9.2.3.2. Market
Estimation and Penetration, 2015 – 2018
9.2.3.3. Market
Forecast, 2019 – 2027
9.2.3.4. Compound
Annual Growth Rate (CAGR)
9.2.3.5. Regional
Bifurcation
9.2.3.5.1. North
America
9.2.3.5.1.1. Market
Estimation, 2015 – 2018
9.2.3.5.1.2. Market
Forecast, 2019 – 2027
9.2.3.5.2. Europe
9.2.3.5.2.1. Market
Estimation, 2015 – 2018
9.2.3.5.2.2. Market
Forecast, 2019 – 2027
9.2.3.5.3. Asia
Pacific
9.2.3.5.3.1. Market
Estimation, 2015 – 2018
9.2.3.5.3.2. Market
Forecast, 2019 – 2027
9.2.3.5.4. Middle
East and Africa
9.2.3.5.4.1. Market
Estimation, 2015 – 2018
9.2.3.5.4.2. Market
Forecast, 2019 – 2027
9.2.3.5.5. Latin
America
9.2.3.5.5.1. Market
Estimation, 2015 – 2018
9.2.3.5.5.2. Market
Forecast, 2019 – 2027
9.2.4. Optical
Communication
9.2.4.1. Definition
9.2.4.2. Market
Estimation and Penetration, 2015 – 2018
9.2.4.3. Market
Forecast, 2019 – 2027
9.2.4.4. Compound
Annual Growth Rate (CAGR)
9.2.4.5. Regional
Bifurcation
9.2.4.5.1. North
America
9.2.4.5.1.1. Market
Estimation, 2015 – 2018
9.2.4.5.1.2. Market
Forecast, 2019 – 2027
9.2.4.5.2. Europe
9.2.4.5.2.1. Market
Estimation, 2015 – 2018
9.2.4.5.2.2. Market
Forecast, 2019 – 2027
9.2.4.5.3. Asia
Pacific
9.2.4.5.3.1. Market
Estimation, 2015 – 2018
9.2.4.5.3.2. Market
Forecast, 2019 – 2027
9.2.4.5.4. Middle
East and Africa
9.2.4.5.4.1. Market
Estimation, 2015 – 2018
9.2.4.5.4.2. Market
Forecast, 2019 – 2027
9.2.4.5.5. Latin
America
9.2.4.5.5.1. Market
Estimation, 2015 – 2018
9.2.4.5.5.2. Market
Forecast, 2019 – 2027
9.2.5. Optical
Ranging
9.2.5.1. Definition
9.2.5.2. Market
Estimation and Penetration, 2015 – 2018
9.2.5.3. Market
Forecast, 2019 – 2027
9.2.5.4. Compound
Annual Growth Rate (CAGR)
9.2.5.5. Regional
Bifurcation
9.2.5.5.1. North
America
9.2.5.5.1.1. Market
Estimation, 2015 – 2018
9.2.5.5.1.2. Market
Forecast, 2019 – 2027
9.2.5.5.2. Europe
9.2.5.5.2.1. Market
Estimation, 2015 – 2018
9.2.5.5.2.2. Market
Forecast, 2019 – 2027
9.2.5.5.3. Asia
Pacific
9.2.5.5.3.1. Market
Estimation, 2015 – 2018
9.2.5.5.3.2. Market
Forecast, 2019 – 2027
9.2.5.5.4. Middle
East and Africa
9.2.5.5.4.1. Market
Estimation, 2015 – 2018
9.2.5.5.4.2. Market
Forecast, 2019 – 2027
9.2.5.5.5. Latin
America
9.2.5.5.5.1. Market
Estimation, 2015 – 2018
9.2.5.5.5.2. Market
Forecast, 2019 – 2027
9.2.6. Nuclear
Fusion
9.2.6.1. Definition
9.2.6.2. Market
Estimation and Penetration, 2015 – 2018
9.2.6.3. Market
Forecast, 2019 – 2027
9.2.6.4. Compound
Annual Growth Rate (CAGR)
9.2.6.5. Regional
Bifurcation
9.2.6.5.1. North
America
9.2.6.5.1.1. Market
Estimation, 2015 – 2018
9.2.6.5.1.2. Market
Forecast, 2019 – 2027
9.2.6.5.2. Europe
9.2.6.5.2.1. Market
Estimation, 2015 – 2018
9.2.6.5.2.2. Market
Forecast, 2019 – 2027
9.2.6.5.3. Asia
Pacific
9.2.6.5.3.1. Market
Estimation, 2015 – 2018
9.2.6.5.3.2. Market
Forecast, 2019 – 2027
9.2.6.5.4. Middle
East and Africa
9.2.6.5.4.1. Market
Estimation, 2015 – 2018
9.2.6.5.4.2. Market
Forecast, 2019 – 2027
9.2.6.5.5. Latin
America
9.2.6.5.5.1. Market
Estimation, 2015 – 2018
9.2.6.5.5.2. Market
Forecast, 2019 – 2027
9.2.7. Others
9.2.7.1. Definition
9.2.7.2. Market
Estimation and Penetration, 2015 – 2018
9.2.7.3. Market
Forecast, 2019 – 2027
9.2.7.4. Compound
Annual Growth Rate (CAGR)
9.2.7.5. Regional
Bifurcation
9.2.7.5.1. North
America
9.2.7.5.1.1. Market
Estimation, 2015 – 2018
9.2.7.5.1.2. Market
Forecast, 2019 – 2027
9.2.7.5.2. Europe
9.2.7.5.2.1. Market
Estimation, 2015 – 2018
9.2.7.5.2.2. Market
Forecast, 2019 – 2027
9.2.7.5.3. Asia
Pacific
9.2.7.5.3.1. Market
Estimation, 2015 – 2018
9.2.7.5.3.2. Market
Forecast, 2019 – 2027
9.2.7.5.4. Middle
East and Africa
9.2.7.5.4.1. Market
Estimation, 2015 – 2018
9.2.7.5.4.2. Market
Forecast, 2019 – 2027
9.2.7.5.5. Latin
America
9.2.7.5.5.1. Market
Estimation, 2015 – 2018
9.2.7.5.5.2. Market
Forecast, 2019 – 2027
9.3. Key
Segment for Channeling Investments
9.3.1. By
Application
10. North
America Nonlinear Optical Crystals Market Analysis and Forecasts, 2019 - 2027
10.1. Overview
10.1.1. North
America Nonlinear Optical Crystals Market Revenue (US$ Mn)
10.2. North
America Nonlinear Optical Crystals Market Revenue (US$ Mn) and Forecasts, By
Product
10.2.1. KTP
10.2.2. BBO
10.2.3. LBO
10.2.4. CLBO
10.2.5. DKDP
10.2.6. ADP
10.2.7. KDP
10.2.8. Others
10.3. North
America Nonlinear Optical Crystals Market Revenue (US$ Mn) and Forecasts, By Application
10.3.1. Laser
Technology
10.3.2. Medical
10.3.3. Underwater
Photography
10.3.4. Optical
Communication
10.3.5. Optical
Ranging
10.3.6. Nuclear
Fusion
10.3.7. Others
10.4. North
America Nonlinear Optical Crystals Market Revenue (US$ Mn) and Forecasts, By
Country
10.4.1. U.S
10.4.1.1. U.S
Nonlinear Optical Crystals Market Revenue (US$ Mn) and Forecasts, By Product
10.4.1.1.1. KTP
10.4.1.1.2. BBO
10.4.1.1.3. LBO
10.4.1.1.4. CLBO
10.4.1.1.5. DKDP
10.4.1.1.6. ADP
10.4.1.1.7. KDP
10.4.1.1.8. Others
10.4.1.2. U.S
Nonlinear Optical Crystals Market Revenue (US$ Mn) and Forecasts, By
Application
10.4.1.2.1. Laser
Technology
10.4.1.2.2. Medical
10.4.1.2.3. Underwater
Photography
10.4.1.2.4. Optical
Communication
10.4.1.2.5. Optical
Ranging
10.4.1.2.6. Nuclear
Fusion
10.4.1.2.7. Others
10.4.2. Canada
10.4.2.1. Canada
Nonlinear Optical Crystals Market Revenue (US$ Mn) and Forecasts, By Product
10.4.2.1.1. KTP
10.4.2.1.2. BBO
10.4.2.1.3. LBO
10.4.2.1.4. CLBO
10.4.2.1.5. DKDP
10.4.2.1.6. ADP
10.4.2.1.7. KDP
10.4.2.1.8. Others
10.4.2.2. Canada
Nonlinear Optical Crystals Market Revenue (US$ Mn) and Forecasts, By
Application
10.4.2.2.1. Laser
Technology
10.4.2.2.2. Medical
10.4.2.2.3. Underwater
Photography
10.4.2.2.4. Optical
Communication
10.4.2.2.5. Optical
Ranging
10.4.2.2.6. Nuclear
Fusion
10.4.2.2.7. Others
10.4.3. Mexico
10.4.3.1. Mexico
Nonlinear Optical Crystals Market Revenue (US$ Mn) and Forecasts, By Product
10.4.3.1.1. KTP
10.4.3.1.2. BBO
10.4.3.1.3. LBO
10.4.3.1.4. CLBO
10.4.3.1.5. DKDP
10.4.3.1.6. ADP
10.4.3.1.7. KDP
10.4.3.1.8. Others
10.4.3.2. Mexico
Nonlinear Optical Crystals Market Revenue (US$ Mn) and Forecasts, By
Application
10.4.3.2.1. Laser
Technology
10.4.3.2.2. Medical
10.4.3.2.3. Underwater
Photography
10.4.3.2.4. Optical
Communication
10.4.3.2.5. Optical
Ranging
10.4.3.2.6. Nuclear
Fusion
10.4.3.2.7. Others
10.4.4. Rest of
North America
10.4.4.1. Rest
of North America Nonlinear Optical Crystals Market Revenue (US$ Mn) and Forecasts,
By Product
10.4.4.1.1. KTP
10.4.4.1.2. BBO
10.4.4.1.3. LBO
10.4.4.1.4. CLBO
10.4.4.1.5. DKDP
10.4.4.1.6. ADP
10.4.4.1.7. KDP
10.4.4.1.8. Others
10.4.4.2. Rest
of North America Nonlinear Optical Crystals Market Revenue (US$ Mn) and
Forecasts, By Application
10.4.4.2.1. Laser
Technology
10.4.4.2.2. Medical
10.4.4.2.3. Underwater
Photography
10.4.4.2.4. Optical
Communication
10.4.4.2.5. Optical
Ranging
10.4.4.2.6. Nuclear
Fusion
10.4.4.2.7. Others
10.5. Key
Segment for Channeling Investments
10.5.1. By
Country
10.5.2. By
Product
10.5.3. By
Application
11. Europe
Nonlinear Optical Crystals Market Analysis and Forecasts, 2019 - 2027
11.1. Overview
11.1.1. Europe
Nonlinear Optical Crystals Market Revenue (US$ Mn)
11.2. Europe
Nonlinear Optical Crystals Market Revenue (US$ Mn) and Forecasts, By Product
11.2.1. KTP
11.2.2. BBO
11.2.3. LBO
11.2.4. CLBO
11.2.5. DKDP
11.2.6. ADP
11.2.7. KDP
11.2.8. Others
11.3. Europe
Nonlinear Optical Crystals Market Revenue (US$ Mn) and Forecasts, By
Application
11.3.1. Laser
Technology
11.3.2. Medical
11.3.3. Underwater
Photography
11.3.4. Optical
Communication
11.3.5. Optical
Ranging
11.3.6. Nuclear
Fusion
11.3.7. Others
11.4. Europe
Nonlinear Optical Crystals Market Revenue (US$ Mn) and Forecasts, By Country
11.4.1. France
11.4.1.1. France
Nonlinear Optical Crystals Market Revenue (US$ Mn) and Forecasts, By Product
11.4.1.1.1. KTP
11.4.1.1.2. BBO
11.4.1.1.3. LBO
11.4.1.1.4. CLBO
11.4.1.1.5. DKDP
11.4.1.1.6. ADP
11.4.1.1.7. KDP
11.4.1.1.8. Others
11.4.1.2. France
Nonlinear Optical Crystals Market Revenue (US$ Mn) and Forecasts, By
Application
11.4.1.2.1. Laser
Technology
11.4.1.2.2. Medical
11.4.1.2.3. Underwater
Photography
11.4.1.2.4. Optical
Communication
11.4.1.2.5. Optical
Ranging
11.4.1.2.6. Nuclear
Fusion
11.4.1.2.7. Others
11.4.2. The UK
11.4.2.1. The
UK Nonlinear Optical Crystals Market Revenue (US$ Mn) and Forecasts, By Product
11.4.2.1.1. KTP
11.4.2.1.2. BBO
11.4.2.1.3. LBO
11.4.2.1.4. CLBO
11.4.2.1.5. DKDP
11.4.2.1.6. ADP
11.4.2.1.7. KDP
11.4.2.1.8. Others
11.4.2.2. The
UK Nonlinear Optical Crystals Market Revenue (US$ Mn) and Forecasts, By
Application
11.4.2.2.1. Laser
Technology
11.4.2.2.2. Medical
11.4.2.2.3. Underwater
Photography
11.4.2.2.4. Optical
Communication
11.4.2.2.5. Optical
Ranging
11.4.2.2.6. Nuclear
Fusion
11.4.2.2.7. Others
11.4.3. Spain
11.4.3.1. Spain
Nonlinear Optical Crystals Market Revenue (US$ Mn) and Forecasts, By Product
11.4.3.1.1. KTP
11.4.3.1.2. BBO
11.4.3.1.3. LBO
11.4.3.1.4. CLBO
11.4.3.1.5. DKDP
11.4.3.1.6. ADP
11.4.3.1.7. KDP
11.4.3.1.8. Others
11.4.3.2. Spain
Nonlinear Optical Crystals Market Revenue (US$ Mn) and Forecasts, By
Application
11.4.3.2.1. Laser
Technology
11.4.3.2.2. Medical
11.4.3.2.3. Underwater
Photography
11.4.3.2.4. Optical
Communication
11.4.3.2.5. Optical
Ranging
11.4.3.2.6. Nuclear
Fusion
11.4.3.2.7. Others
11.4.4. Germany
11.4.4.1. Germany
Nonlinear Optical Crystals Market Revenue (US$ Mn) and Forecasts, By Product
11.4.4.1.1. KTP
11.4.4.1.2. BBO
11.4.4.1.3. LBO
11.4.4.1.4. CLBO
11.4.4.1.5. DKDP
11.4.4.1.6. ADP
11.4.4.1.7. KDP
11.4.4.1.8. Others
11.4.4.2. Germany
Nonlinear Optical Crystals Market Revenue (US$ Mn) and Forecasts, By
Application
11.4.4.2.1. Laser
Technology
11.4.4.2.2. Medical
11.4.4.2.3. Underwater
Photography
11.4.4.2.4. Optical
Communication
11.4.4.2.5. Optical
Ranging
11.4.4.2.6. Nuclear
Fusion
11.4.4.2.7. Others
11.4.5. Italy
11.4.5.1. Italy
Nonlinear Optical Crystals Market Revenue (US$ Mn) and Forecasts, By Product
11.4.5.1.1. KTP
11.4.5.1.2. BBO
11.4.5.1.3. LBO
11.4.5.1.4. CLBO
11.4.5.1.5. DKDP
11.4.5.1.6. ADP
11.4.5.1.7. KDP
11.4.5.1.8. Others
11.4.5.2. Italy
Nonlinear Optical Crystals Market Revenue (US$ Mn) and Forecasts, By
Application
11.4.5.2.1. Laser
Technology
11.4.5.2.2. Medical
11.4.5.2.3. Underwater
Photography
11.4.5.2.4. Optical
Communication
11.4.5.2.5. Optical
Ranging
11.4.5.2.6. Nuclear
Fusion
11.4.5.2.7. Others
11.4.6. Nordic
Countries
11.4.6.1. Nordic
Countries Nonlinear Optical Crystals Market Revenue (US$ Mn) and Forecasts, By
Product
11.4.6.1.1. KTP
11.4.6.1.2. BBO
11.4.6.1.3. LBO
11.4.6.1.4. CLBO
11.4.6.1.5. DKDP
11.4.6.1.6. ADP
11.4.6.1.7. KDP
11.4.6.1.8. Others
11.4.6.2. Nordic
Countries Nonlinear Optical Crystals Market Revenue (US$ Mn) and Forecasts, By
Application
11.4.6.2.1. Laser
Technology
11.4.6.2.2. Medical
11.4.6.2.3. Underwater
Photography
11.4.6.2.4. Optical
Communication
11.4.6.2.5. Optical
Ranging
11.4.6.2.6. Nuclear
Fusion
11.4.6.2.7. Others
11.4.6.3. Nordic
Countries Nonlinear Optical Crystals Market Revenue (US$ Mn) and Forecasts, By
Country
11.4.6.3.1. Denmark
11.4.6.3.2. Finland
11.4.6.3.3. Iceland
11.4.6.3.4. Sweden
11.4.6.3.5. Norway
11.4.7. Benelux
Union
11.4.7.1. Benelux
Union Nonlinear Optical Crystals Market Revenue (US$ Mn) and Forecasts, By
Product
11.4.7.1.1. KTP
11.4.7.1.2. BBO
11.4.7.1.3. LBO
11.4.7.1.4. CLBO
11.4.7.1.5. DKDP
11.4.7.1.6. ADP
11.4.7.1.7. KDP
11.4.7.1.8. Others
11.4.7.2. Benelux
Union Nonlinear Optical Crystals Market Revenue (US$ Mn) and Forecasts, By
Application
11.4.7.2.1. Laser
Technology
11.4.7.2.2. Medical
11.4.7.2.3. Underwater
Photography
11.4.7.2.4. Optical
Communication
11.4.7.2.5. Optical
Ranging
11.4.7.2.6. Nuclear
Fusion
11.4.7.2.7. Others
11.4.7.3. Benelux
Union Nonlinear Optical Crystals Market Revenue (US$ Mn) and Forecasts, By
Country
11.4.7.3.1. Belgium
11.4.7.3.2. The
Netherlands
11.4.7.3.3. Luxembourg
11.4.8. Rest of
Europe
11.4.8.1. Rest
of Europe Nonlinear Optical Crystals Market Revenue (US$ Mn) and Forecasts, By
Product
11.4.8.1.1. KTP
11.4.8.1.2. BBO
11.4.8.1.3. LBO
11.4.8.1.4. CLBO
11.4.8.1.5. DKDP
11.4.8.1.6. ADP
11.4.8.1.7. KDP
11.4.8.1.8. Others
11.4.8.2. Rest
of Europe Nonlinear Optical Crystals Market Revenue (US$ Mn) and Forecasts, By
Application
11.4.8.2.1. Laser
Technology
11.4.8.2.2. Medical
11.4.8.2.3. Underwater
Photography
11.4.8.2.4. Optical
Communication
11.4.8.2.5. Optical
Ranging
11.4.8.2.6. Nuclear
Fusion
11.4.8.2.7. Others
11.5. Key
Segment for Channeling Investments
11.5.1. By
Country
11.5.2. By
Product
11.5.3. By
Application
12. Asia
Pacific Nonlinear Optical Crystals Market Analysis and Forecasts, 2019 - 2027
12.1. Overview
12.1.1. Asia
Pacific Nonlinear Optical Crystals Market Revenue (US$ Mn)
12.2. Asia
Pacific Nonlinear Optical Crystals Market Revenue (US$ Mn) and Forecasts, By
Product
12.2.1. KTP
12.2.2. BBO
12.2.3. LBO
12.2.4. CLBO
12.2.5. DKDP
12.2.6. ADP
12.2.7. KDP
12.2.8. Others
12.3. Asia
Pacific Nonlinear Optical Crystals Market Revenue (US$ Mn) and Forecasts, By
Application
12.3.1. Laser
Technology
12.3.2. Medical
12.3.3. Underwater
Photography
12.3.4. Optical
Communication
12.3.5. Optical
Ranging
12.3.6. Nuclear
Fusion
12.3.7. Others
12.4. Asia
Pacific Nonlinear Optical Crystals Market Revenue (US$ Mn) and Forecasts, By
Country
12.4.1. China
12.4.1.1. China
Nonlinear Optical Crystals Market Revenue (US$ Mn) and Forecasts, By Product
12.4.1.1.1. KTP
12.4.1.1.2. BBO
12.4.1.1.3. LBO
12.4.1.1.4. CLBO
12.4.1.1.5. DKDP
12.4.1.1.6. ADP
12.4.1.1.7. KDP
12.4.1.1.8. Others
12.4.1.2. China
Nonlinear Optical Crystals Market Revenue (US$ Mn) and Forecasts, By
Application
12.4.1.2.1. Laser
Technology
12.4.1.2.2. Medical
12.4.1.2.3. Underwater
Photography
12.4.1.2.4. Optical
Communication
12.4.1.2.5. Optical
Ranging
12.4.1.2.6. Nuclear
Fusion
12.4.1.2.7. Others
12.4.2. Japan
12.4.2.1. Japan
Nonlinear Optical Crystals Market Revenue (US$ Mn) and Forecasts, By Product
12.4.2.1.1. KTP
12.4.2.1.2. BBO
12.4.2.1.3. LBO
12.4.2.1.4. CLBO
12.4.2.1.5. DKDP
12.4.2.1.6. ADP
12.4.2.1.7. KDP
12.4.2.1.8. Others
12.4.2.2. Japan
Nonlinear Optical Crystals Market Revenue (US$ Mn) and Forecasts, By
Application
12.4.2.2.1. Laser
Technology
12.4.2.2.2. Medical
12.4.2.2.3. Underwater
Photography
12.4.2.2.4. Optical
Communication
12.4.2.2.5. Optical
Ranging
12.4.2.2.6. Nuclear
Fusion
12.4.2.2.7. Others
12.4.3. India
12.4.3.1. India
Nonlinear Optical Crystals Market Revenue (US$ Mn) and Forecasts, By Product
12.4.3.1.1. KTP
12.4.3.1.2. BBO
12.4.3.1.3. LBO
12.4.3.1.4. CLBO
12.4.3.1.5. DKDP
12.4.3.1.6. ADP
12.4.3.1.7. KDP
12.4.3.1.8. Others
12.4.3.2. India
Nonlinear Optical Crystals Market Revenue (US$ Mn) and Forecasts, By
Application
12.4.3.2.1. Laser
Technology
12.4.3.2.2. Medical
12.4.3.2.3. Underwater
Photography
12.4.3.2.4. Optical
Communication
12.4.3.2.5. Optical
Ranging
12.4.3.2.6. Nuclear
Fusion
12.4.3.2.7. Others
12.4.4. New
Zealand
12.4.4.1. New
Zealand Nonlinear Optical Crystals Market Revenue (US$ Mn) and Forecasts, By
Product
12.4.4.1.1. KTP
12.4.4.1.2. BBO
12.4.4.1.3. LBO
12.4.4.1.4. CLBO
12.4.4.1.5. DKDP
12.4.4.1.6. ADP
12.4.4.1.7. KDP
12.4.4.1.8. Others
12.4.4.2. New
Zealand Nonlinear Optical Crystals Market Revenue (US$ Mn) and Forecasts, By
Application
12.4.4.2.1. Laser
Technology
12.4.4.2.2. Medical
12.4.4.2.3. Underwater
Photography
12.4.4.2.4. Optical
Communication
12.4.4.2.5. Optical
Ranging
12.4.4.2.6. Nuclear
Fusion
12.4.4.2.7. Others
12.4.5. Australia
12.4.5.1. Australia
Nonlinear Optical Crystals Market Revenue (US$ Mn) and Forecasts, By Product
12.4.5.1.1. KTP
12.4.5.1.2. BBO
12.4.5.1.3. LBO
12.4.5.1.4. CLBO
12.4.5.1.5. DKDP
12.4.5.1.6. ADP
12.4.5.1.7. KDP
12.4.5.1.8. Others
12.4.5.2. Australia
Nonlinear Optical Crystals Market Revenue (US$ Mn) and Forecasts, By
Application
12.4.5.2.1. Laser
Technology
12.4.5.2.2. Medical
12.4.5.2.3. Underwater
Photography
12.4.5.2.4. Optical
Communication
12.4.5.2.5. Optical
Ranging
12.4.5.2.6. Nuclear
Fusion
12.4.5.2.7. Others
12.4.6. South
Korea
12.4.6.1. South
Korea Nonlinear Optical Crystals Market Revenue (US$ Mn) and Forecasts, By
Product
12.4.6.1.1. KTP
12.4.6.1.2. BBO
12.4.6.1.3. LBO
12.4.6.1.4. CLBO
12.4.6.1.5. DKDP
12.4.6.1.6. ADP
12.4.6.1.7. KDP
12.4.6.1.8. Others
12.4.6.2. South
Korea Nonlinear Optical Crystals Market Revenue (US$ Mn) and Forecasts, By
Application
12.4.6.2.1. Laser
Technology
12.4.6.2.2. Medical
12.4.6.2.3. Underwater
Photography
12.4.6.2.4. Optical
Communication
12.4.6.2.5. Optical
Ranging
12.4.6.2.6. Nuclear
Fusion
12.4.6.2.7. Others
12.4.7. Southeast
Asia
12.4.7.1. Southeast
Asia Nonlinear Optical Crystals Market Revenue (US$ Mn) and Forecasts, By
Product
12.4.7.1.1. KTP
12.4.7.1.2. BBO
12.4.7.1.3. LBO
12.4.7.1.4. CLBO
12.4.7.1.5. DKDP
12.4.7.1.6. ADP
12.4.7.1.7. KDP
12.4.7.1.8. Others
12.4.7.2. Southeast
Asia Nonlinear Optical Crystals Market Revenue (US$ Mn) and Forecasts, By
Application
12.4.7.2.1. Laser
Technology
12.4.7.2.2. Medical
12.4.7.2.3. Underwater
Photography
12.4.7.2.4. Optical
Communication
12.4.7.2.5. Optical
Ranging
12.4.7.2.6. Nuclear
Fusion
12.4.7.2.7. Others
12.4.7.3. Southeast
Asia Nonlinear Optical Crystals Market Revenue (US$ Mn) and Forecasts, By
Country
12.4.7.3.1. Indonesia
12.4.7.3.2. Thailand
12.4.7.3.3. Malaysia
12.4.7.3.4. Singapore
12.4.7.3.5. Rest
of Southeast Asia
12.4.8. Rest of
Asia Pacific
12.4.8.1. Rest
of Asia Pacific Nonlinear Optical Crystals Market Revenue (US$ Mn) and
Forecasts, By Product
12.4.8.1.1. KTP
12.4.8.1.2. BBO
12.4.8.1.3. LBO
12.4.8.1.4. CLBO
12.4.8.1.5. DKDP
12.4.8.1.6. ADP
12.4.8.1.7. KDP
12.4.8.1.8. Others
12.4.8.2. Rest
of Asia Pacific Nonlinear Optical Crystals Market Revenue (US$ Mn) and
Forecasts, By Application
12.4.8.2.1. Laser
Technology
12.4.8.2.2. Medical
12.4.8.2.3. Underwater
Photography
12.4.8.2.4. Optical
Communication
12.4.8.2.5. Optical
Ranging
12.4.8.2.6. Nuclear
Fusion
12.4.8.2.7. Others
12.5. Key
Segment for Channeling Investments
12.5.1. By
Country
12.5.2. By
Product
12.5.3. By Application
13. Middle
East and Africa Nonlinear Optical Crystals Market Analysis and Forecasts, 2019
- 2027
13.1. Overview
13.1.1. Middle
East and Africa Nonlinear Optical Crystals Market Revenue (US$ Mn)
13.2. Middle
East and Africa Nonlinear Optical Crystals Market Revenue (US$ Mn) and
Forecasts, By Product
13.2.1. KTP
13.2.2. BBO
13.2.3. LBO
13.2.4. CLBO
13.2.5. DKDP
13.2.6. ADP
13.2.7. KDP
13.2.8. Others
13.3. Middle
East and Africa Nonlinear Optical Crystals Market Revenue (US$ Mn) and
Forecasts, By Application
13.3.1. Laser
Technology
13.3.2. Medical
13.3.3. Underwater
Photography
13.3.4. Optical
Communication
13.3.5. Optical
Ranging
13.3.6. Nuclear
Fusion
13.3.7. Others
13.4. Middle
East and Africa Nonlinear Optical Crystals Market Revenue (US$ Mn) and
Forecasts, By Country
13.4.1. Saudi
Arabia
13.4.1.1. Saudi
Arabia Nonlinear Optical Crystals Market Revenue (US$ Mn) and Forecasts, By
Product
13.4.1.1.1. KTP
13.4.1.1.2. BBO
13.4.1.1.3. LBO
13.4.1.1.4. CLBO
13.4.1.1.5. DKDP
13.4.1.1.6. ADP
13.4.1.1.7. KDP
13.4.1.1.8. Others
13.4.1.2. Saudi
Arabia Nonlinear Optical Crystals Market Revenue (US$ Mn) and Forecasts, By
Application
13.4.1.2.1. Laser
Technology
13.4.1.2.2. Medical
13.4.1.2.3. Underwater
Photography
13.4.1.2.4. Optical
Communication
13.4.1.2.5. Optical
Ranging
13.4.1.2.6. Nuclear
Fusion
13.4.1.2.7. Others
13.4.2. UAE
13.4.2.1. UAE
Nonlinear Optical Crystals Market Revenue (US$ Mn) and Forecasts, By Product
13.4.2.1.1. KTP
13.4.2.1.2. BBO
13.4.2.1.3. LBO
13.4.2.1.4. CLBO
13.4.2.1.5. DKDP
13.4.2.1.6. ADP
13.4.2.1.7. KDP
13.4.2.1.8. Others
13.4.2.2. UAE
Nonlinear Optical Crystals Market Revenue (US$ Mn) and Forecasts, By
Application
13.4.2.2.1. Laser
Technology
13.4.2.2.2. Medical
13.4.2.2.3. Underwater
Photography
13.4.2.2.4. Optical
Communication
13.4.2.2.5. Optical
Ranging
13.4.2.2.6. Nuclear
Fusion
13.4.2.2.7. Others
13.4.3. Egypt
13.4.3.1. Egypt
Nonlinear Optical Crystals Market Revenue (US$ Mn) and Forecasts, By Product
13.4.3.1.1. KTP
13.4.3.1.2. BBO
13.4.3.1.3. LBO
13.4.3.1.4. CLBO
13.4.3.1.5. DKDP
13.4.3.1.6. ADP
13.4.3.1.7. KDP
13.4.3.1.8. Others
13.4.3.2. Egypt
Nonlinear Optical Crystals Market Revenue (US$ Mn) and Forecasts, By
Application
13.4.3.2.1. Laser
Technology
13.4.3.2.2. Medical
13.4.3.2.3. Underwater
Photography
13.4.3.2.4. Optical
Communication
13.4.3.2.5. Optical
Ranging
13.4.3.2.6. Nuclear
Fusion
13.4.3.2.7. Others
13.4.4. Kuwait
13.4.4.1. Kuwait
Nonlinear Optical Crystals Market Revenue (US$ Mn) and Forecasts, By Product
13.4.4.1.1. KTP
13.4.4.1.2. BBO
13.4.4.1.3. LBO
13.4.4.1.4. CLBO
13.4.4.1.5. DKDP
13.4.4.1.6. ADP
13.4.4.1.7. KDP
13.4.4.1.8. Others
13.4.4.2. Kuwait
Nonlinear Optical Crystals Market Revenue (US$ Mn) and Forecasts, By
Application
13.4.4.2.1. Laser
Technology
13.4.4.2.2. Medical
13.4.4.2.3. Underwater
Photography
13.4.4.2.4. Optical
Communication
13.4.4.2.5. Optical
Ranging
13.4.4.2.6. Nuclear
Fusion
13.4.4.2.7. Others
13.4.5. South
Africa
13.4.5.1. South
Africa Nonlinear Optical Crystals Market Revenue (US$ Mn) and Forecasts, By
Product
13.4.5.1.1. KTP
13.4.5.1.2. BBO
13.4.5.1.3. LBO
13.4.5.1.4. CLBO
13.4.5.1.5. DKDP
13.4.5.1.6. ADP
13.4.5.1.7. KDP
13.4.5.1.8. Others
13.4.5.2. South
Africa Nonlinear Optical Crystals Market Revenue (US$ Mn) and Forecasts, By
Application
13.4.5.2.1. Laser
Technology
13.4.5.2.2. Medical
13.4.5.2.3. Underwater
Photography
13.4.5.2.4. Optical
Communication
13.4.5.2.5. Optical
Ranging
13.4.5.2.6. Nuclear
Fusion
13.4.5.2.7. Others
13.4.6. Rest of
Middle East & Africa
13.4.6.1. Rest
of Middle East & Africa Nonlinear Optical Crystals Market Revenue (US$ Mn)
and Forecasts, By Product
13.4.6.1.1. KTP
13.4.6.1.2. BBO
13.4.6.1.3. LBO
13.4.6.1.4. CLBO
13.4.6.1.5. DKDP
13.4.6.1.6. ADP
13.4.6.1.7. KDP
13.4.6.1.8. Others
13.4.6.2. Rest
of Middle East & Africa Nonlinear Optical Crystals Market Revenue (US$ Mn)
and Forecasts, By Application
13.4.6.2.1. Laser
Technology
13.4.6.2.2. Medical
13.4.6.2.3. Underwater
Photography
13.4.6.2.4. Optical
Communication
13.4.6.2.5. Optical
Ranging
13.4.6.2.6. Nuclear
Fusion
13.4.6.2.7. Others
13.5. Key
Segment for Channeling Investments
13.5.1. By
Country
13.5.2. By
Product
13.5.3. By
Application
14. Latin
America Nonlinear Optical Crystals Market Analysis and Forecasts, 2019 - 2027
14.1. Overview
14.1.1. Latin
America Nonlinear Optical Crystals Market Revenue (US$ Mn)
14.2. Latin
America Nonlinear Optical Crystals Market Revenue (US$ Mn) and Forecasts, By
Product
14.2.1. KTP
14.2.2. BBO
14.2.3. LBO
14.2.4. CLBO
14.2.5. DKDP
14.2.6. ADP
14.2.7. KDP
14.2.8. Others
14.3. Latin America
Nonlinear Optical Crystals Market Revenue (US$ Mn) and Forecasts, By
Application
14.3.1. Laser
Technology
14.3.2. Medical
14.3.3. Underwater
Photography
14.3.4. Optical
Communication
14.3.5. Optical
Ranging
14.3.6. Nuclear
Fusion
14.3.7. Others
14.4. Latin
America Nonlinear Optical Crystals Market Revenue (US$ Mn) and Forecasts, By
Country
14.4.1. Brazil
14.4.1.1. Brazil
Nonlinear Optical Crystals Market Revenue (US$ Mn) and Forecasts, By Product
14.4.1.1.1. KTP
14.4.1.1.2. BBO
14.4.1.1.3. LBO
14.4.1.1.4. CLBO
14.4.1.1.5. DKDP
14.4.1.1.6. ADP
14.4.1.1.7. KDP
14.4.1.1.8. Others
14.4.1.2. Brazil
Nonlinear Optical Crystals Market Revenue (US$ Mn) and Forecasts, By
Application
14.4.1.2.1. Laser
Technology
14.4.1.2.2. Medical
14.4.1.2.3. Underwater
Photography
14.4.1.2.4. Optical
Communication
14.4.1.2.5. Optical
Ranging
14.4.1.2.6. Nuclear
Fusion
14.4.1.2.7. Others
14.4.2. Argentina
14.4.2.1. Argentina
Nonlinear Optical Crystals Market Revenue (US$ Mn) and Forecasts, By Product
14.4.2.1.1. KTP
14.4.2.1.2. BBO
14.4.2.1.3. LBO
14.4.2.1.4. CLBO
14.4.2.1.5. DKDP
14.4.2.1.6. ADP
14.4.2.1.7. KDP
14.4.2.1.8. Others
14.4.2.2. Argentina
Nonlinear Optical Crystals Market Revenue (US$ Mn) and Forecasts, By
Application
14.4.2.2.1. Laser
Technology
14.4.2.2.2. Medical
14.4.2.2.3. Underwater
Photography
14.4.2.2.4. Optical
Communication
14.4.2.2.5. Optical
Ranging
14.4.2.2.6. Nuclear
Fusion
14.4.2.2.7. Others
14.4.3. Rest of
Latin America
14.4.3.1. Rest
of Latin America Nonlinear Optical Crystals Market Revenue (US$ Mn) and
Forecasts, By Product
14.4.3.1.1. KTP
14.4.3.1.2. BBO
14.4.3.1.3. LBO
14.4.3.1.4. CLBO
14.4.3.1.5. DKDP
14.4.3.1.6. ADP
14.4.3.1.7. KDP
14.4.3.1.8. Others
14.4.3.2. Rest
of Latin America Nonlinear Optical Crystals Market Revenue (US$ Mn) and
Forecasts, By Application
14.4.3.2.1. Laser
Technology
14.4.3.2.2. Medical
14.4.3.2.3. Underwater
Photography
14.4.3.2.4. Optical
Communication
14.4.3.2.5. Optical
Ranging
14.4.3.2.6. Nuclear
Fusion
14.4.3.2.7. Others
14.5. Key
Segment for Channeling Investments
14.5.1. By
Country
14.5.2. By
Product
14.5.3. By
Application
15. Competitive
Benchmarking
15.1. Market
Share Analysis, 2018
15.2. Global
Presence and Growth Strategies
15.2.1. Mergers
and Acquisitions
15.2.2. Product
Launches
15.2.3. Investments
Trends
15.2.4. R&D
Initiatives
16. Player
Profiles
16.1. CASTECH
16.1.1. Company
Details
16.1.2. Company
Overview
16.1.3. Product
Offerings
16.1.4. Key
Developments
16.1.5. Financial
Analysis
16.1.6. SWOT
Analysis
16.1.7. Business
Strategies
16.2. Covesion
16.2.1. Company
Details
16.2.2. Company
Overview
16.2.3. Product
Offerings
16.2.4. Key
Developments
16.2.5. Financial
Analysis
16.2.6. SWOT
Analysis
16.2.7. Business
Strategies
16.3. Cristal
Laser S.A.
16.3.1. Company
Details
16.3.2. Company
Overview
16.3.3. Product
Offerings
16.3.4. Key
Developments
16.3.5. Financial
Analysis
16.3.6. SWOT
Analysis
16.3.7. Business
Strategies
16.4. EKSMA
Optics
16.4.1. Company
Details
16.4.2. Company
Overview
16.4.3. Product
Offerings
16.4.4. Key
Developments
16.4.5. Financial
Analysis
16.4.6. SWOT
Analysis
16.4.7. Business
Strategies
16.5. GAMDAN
Optics
16.5.1. Company
Details
16.5.2. Company
Overview
16.5.3. Product
Offerings
16.5.4. Key
Developments
16.5.5. Financial
Analysis
16.5.6. SWOT
Analysis
16.5.7. Business
Strategies
16.6. Gooch
& Housego
16.6.1. Company
Details
16.6.2. Company
Overview
16.6.3. Product
Offerings
16.6.4. Key
Developments
16.6.5. Financial
Analysis
16.6.6. SWOT
Analysis
16.6.7. Business
Strategies
16.7. Hangzhou
Shalom EO
16.7.1. Company
Details
16.7.2. Company
Overview
16.7.3. Product
Offerings
16.7.4. Key
Developments
16.7.5. Financial
Analysis
16.7.6. SWOT
Analysis
16.7.7. Business
Strategies
16.8. HC Photonics Corp.
16.8.1. Company
Details
16.8.2. Company
Overview
16.8.3. Product
Offerings
16.8.4. Key
Developments
16.8.5. Financial
Analysis
16.8.6. SWOT
Analysis
16.8.7. Business
Strategies
16.9. Inrad
Optics Inc.
16.9.1. Company
Details
16.9.2. Company
Overview
16.9.3. Product
Offerings
16.9.4. Key
Developments
16.9.5. Financial
Analysis
16.9.6. SWOT
Analysis
16.9.7. Business
Strategies
16.10. Newlight
Photonics Inc
16.10.1. Company
Details
16.10.2. Company
Overview
16.10.3. Product
Offerings
16.10.4. Key
Developments
16.10.5. Financial
Analysis
16.10.6. SWOT
Analysis
16.10.7. Business
Strategies
16.11. Raicol
Crystals Ltd.
16.11.1. Company
Details
16.11.2. Company
Overview
16.11.3. Product
Offerings
16.11.4. Key
Developments
16.11.5. Financial
Analysis
16.11.6. SWOT
Analysis
16.11.7. Business
Strategies
16.12. Red Optronics
16.12.1. Company
Details
16.12.2. Company
Overview
16.12.3. Product
Offerings
16.12.4. Key
Developments
16.12.5. Financial
Analysis
16.12.6. SWOT
Analysis
16.12.7. Business
Strategies
16.13. WTS PHOTONICS
16.13.1. Company
Details
16.13.2. Company
Overview
16.13.3. Product
Offerings
16.13.4. Key
Developments
16.13.5. Financial
Analysis
16.13.6. SWOT
Analysis
16.13.7. Business
Strategies
16.14. Other
market participants
17. Key
Findings
Note: This ToC is tentative and can
be changed according to the research study conducted during the course of
report completion.
**Exclusive for Multi-User and
Enterprise User.
At Absolute Markets Insights, we are engaged in building both global as well as country specific reports. As a result, the approach taken for deriving the estimation and forecast for a specific country is a bit unique and different in comparison to the global research studies. In this case, we not only study the concerned market factors & trends prevailing in a particular country (from secondary research) but we also tend to calculate the actual market size & forecast from the revenue generated from the market participants involved in manufacturing or distributing the any concerned product. These companies can also be service providers. For analyzing any country specifically, we do consider the growth factors prevailing under the states/cities/county for the same. For instance, if we are analyzing an industry specific to United States, we primarily need to study about the states present under the same(where the product/service has the highest growth). Similar analysis will be followed by other countries. Our scope of the report changes with different markets.
Our research study is mainly implement through a mix of both secondary and primary research. Various sources such as industry magazines, trade journals, and government websites and trade associations are reviewed for gathering precise data. Primary interviews are conducted to validate the market size derived from secondary research. Industry experts, major manufacturers and distributors are contacted for further validation purpose on the current market penetration and growth trends.
Prominent participants in our primary research process include:
- Key Opinion Leaders namely the CEOs, CSOs, VPs, purchasing managers, amongst others
- Research and development participants, distributors/suppliers and subject matter experts
Secondary Research includes data extracted from paid data sources:
- Reuters
- Factiva
- Bloomberg
- One Source
- Hoovers
Research Methodology

Key Inclusions


