
Photo Printing Products Market, by Product Type (Photobooks, Prints, Photo Albums, Calendars, Photo Gifts, Mugs, Wall Art, Gift Cards, Others), By Region (U.S., Canada, Mexico, Rest of North America, France, UK, Germany, Spain, Italy, Nordic Countries, Benelux Union, Rest of Europe, China, Japan, India, New Zealand, Australia, South Korea, Southeast Asia, Rest of Asia Pacific, Saudi Arabia, UAE, Egypt, Kuwait, South Africa, Rest of MEA, Brazil, Argentina, Rest of Latin America) — Global Insights, Growth, Size, Comparative Analysis, Trends and Forecast, 2019–2027
Industry Trends
Nowadays individuals are shifted from traditional prints to digital photo printing technologies. Photographic printing is the process of creating a final image on paper for viewing by using a chemically sensitized paper. The final image is printed on various products such as mugs, all art, calendars, cases, home decor, gift cards, and photo books among others. The photo printing product is based on various factors such as orientation, size, cover type, paper type, among others. The three types of color systems/models are used in photo printing technology, which are red, green, and blue (RGB), cyan, magenta, yellow, and key (CMYK) and CIELAB (CIE L*A*B). Photo printing products are produced using digital printers such as inkjet printers, laser printers, etc. The color type plays an important role in creating an attractive photo printed product. Photo printed on a product can be black-and-white or colored. With the rise of digital printing technology, colored printing is also done on other gift related products. Moreover, digital printing has revolutionized photo printing in terms of the ability to retouch and color correct a photograph before printing. Attractive wallpaper, wrapping paper, greeting cards, calendars and posters have been a key factor in driving the demand for the global printed products market. For instance, Vistaprint offers customized marketing materials and printed products for business or personal use to fit any budget, style, and occasion.
One of the product types, photo books are widely used under the photo printing products market due to the rise in consumer demand. Portrays tender emotions and special moments with loved ones, keep them secured with a sturdy and classy hardcover that makes a perfect guardian for beautiful memories and ensure to remain protected for years ahead. For instance, Mpix transforms photos into attractive artwork in hardcovers and soft covers offer into three types of photo books such as premium panoramic, softcover panoramic and economy photo books.
Likewise, the photo printing is used in various sectors based on industry verticals such as by education, healthcare, information technology, retail and consumer goods, consumer electronics, marketing and advertising, travel and hospitality, banking financial services and insurance, among others. Technological advancements in printing technology have given various options such as lustre prints, metallic prints, glossy prints, linen prints, among others. The rising number of options provided by service providers to consumers is also a key factor in attracting consumers to buy photo printing products. With the adoption of the Internet of Things (IoT), the printing industry would experience more advanced devices that create better images.
North America is expected to hold the largest market share over the next eight years owing to large scale investments in photo printing products. With the adoption of mobile, equally staggering advances in intelligent and automated photo management, and new mobile photo printing business models represent an unprecedented foundation for substantial and sustained growth of demand can be attributed to the market.
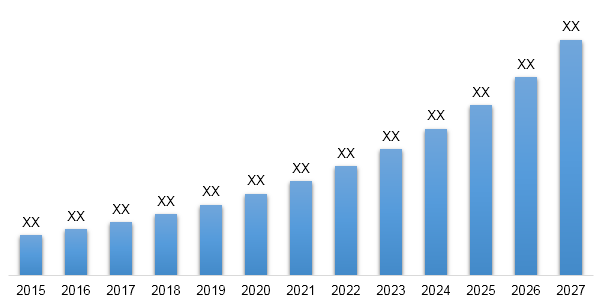
In terms of revenue, global photo printing products market was valued at US$ 22,102.48 Mn in 2018 and is anticipated to reach US$ 21,440.93 Mn by 2027, growing at a CAGR of 3.2% from 2019 to 2027.
Global Photo Printing Products Market Revenue & Forecast, (US$ Million), 2015–2027
Competitive Landscape
The report provides both, qualitative and quantitative research of photo printing products market, market, as well as provides comprehensive insights and favored development methods adopted by the key contenders. The report also offers extensive research on the key players in this market and details on the competitiveness of these players. Key business strategies such as mergers and acquisitions (M&A), affiliations, collaborations, and contracts adopted by these major market participants are also recognized and analyzed in the report. For each company, the report studies their global presence, competitors, service offerings, specification, pricing, and gross margin. Some of the players operating in the Photo Printing Products market are Shutterfly, Inc., Peak Imaging, Snapfish, Mpix amongst others.

Global Photo Printing Products Market:
- By Product Type
- Photo Books
- Prints
- Photo Albums
- Calendars
- Photo Gifts
- Mugs
- Wall Art
- Gift Cards
- Others
- By Geography
- North America
- U.S.
- Canada
- Mexico
- Rest of North America
- Europe
- France
- The UK
- Spain
- Germany
- Italy
- Nordic Countries
- Denmark
- Finland
- Iceland
- Norway
- Sweden
- Benelux Union
- Belgium
- The Netherlands
- Luxemburg
- Rest of Europe
- Asia Pacific
- China
- Japan
- India
- New Zealand
- Australia
- South Korea
- Southeast Asia
- Indonesia
- Thailand
- Malaysia
- Singapore
- Rest of Southeast Asia
- Rest of Asia Pacific
- Middle East & Africa
- Saudi Arabia
- UAE
- Egypt
- Kuwait
- South Africa
- Rest of Middle East and Africa
- Latin America
- Brazil
- Argentina
- Rest of Latin America
- North America
Table of Contents
1. Market Scope
1.1. Market Segmentation
1.2. Years Considered
1.2.1. Historic Years: 2013 - 2017
1.2.2. Base Year: 2018
1.2.3. Forecast Years: 2019 – 2027
2. Key Target Audiences
3. Research Methodology
3.1. Primary Research
3.1.1. Research Questionnaire
3.1.2. Global Percentage Breakdown
3.1.3. Primary Interviews: Key Opinion Leaders (KOLs)
3.2. Secondary Research
3.2.1. Paid Databases
3.2.2. Secondary Sources
3.3. Market Size Estimates
3.3.1. Top-Down Approach
3.3.2. Bottom-Up Approach
3.4. Data Triangulation Methodology
3.5. Research Assumptions
4. Recommendations and Insights from AMI’s Perspective**
5. Holistic Overview of Photo Printing Products Market
6. Market Synopsis: Photo
Printing Products Market
7. Photo Printing Products Market Analysis: Qualitative
Perspective
7.1. Introduction
7.1.1. Product Definition
7.1.2. Industry Development
7.2. Market Dynamics
7.2.1. Drivers
7.2.2. Restraints
7.2.3. Opportunities
7.3. Trends in Photo Printing Products Market
7.4. Market Determinants Radar Chart
7.5. Macro-Economic and Micro-Economic Indicators: Photo Printing
Products Market
7.6. Porter’s Five Force Analysis
8. Global Photo Printing Products Market Analysis and Forecasts,
2019 – 2027
8.1. Overview
8.1.1. Global Photo Printing Products Market Revenue (US$ Mn)
8.2. Global Photo Printing Products Market Revenue (US$ Mn) and
Forecasts, By Product Type
8.2.1. Photo Books
8.2.1.1. Definition
8.2.1.2. Market Estimation and Penetration, 2013 – 2018
8.2.1.3. Market Forecast, 2019 – 2027
8.2.1.4. Compound Annual Growth Rate (CAGR)
8.2.1.5. Regional Bifurcation
8.2.1.5.1. North America
8.2.1.5.1.1. Market Estimation, 2013 – 2018
8.2.1.5.1.2. Market Forecast, 2019 – 2027
8.2.1.5.2. Europe
8.2.1.5.2.1. Market Estimation, 2013 – 2018
8.2.1.5.2.2. Market Forecast, 2019 – 2027
8.2.1.5.3. Asia Pacific
8.2.1.5.3.1. Market Estimation, 2013 – 2018
8.2.1.5.3.2. Market Forecast, 2019 – 2027
8.2.1.5.4. Middle East and Africa
8.2.1.5.4.1. Market Estimation, 2013 – 2018
8.2.1.5.4.2. Market Forecast, 2019 – 2027
8.2.1.5.5. Latin America
8.2.1.5.5.1. Market Estimation, 2013 – 2018
8.2.1.5.5.2. Market Forecast, 2019 – 2027
8.2.2. Prints
8.2.2.1. Definition
8.2.2.2. Market Estimation and Penetration, 2013 – 2018
8.2.2.3. Market Forecast, 2019 – 2027
8.2.2.4. Compound Annual Growth Rate (CAGR)
8.2.2.5. Regional Bifurcation
8.2.2.5.1. North America
8.2.2.5.1.1. Market Estimation, 2013 – 2018
8.2.2.5.1.2. Market Forecast, 2019 – 2027
8.2.2.5.2. Europe
8.2.2.5.2.1. Market Estimation, 2013 – 2018
8.2.2.5.2.2. Market Forecast, 2019 – 2027
8.2.2.5.3. Asia Pacific
8.2.2.5.3.1. Market Estimation, 2013 – 2018
8.2.2.5.3.2. Market Forecast, 2019 – 2027
8.2.2.5.4. Middle East and Africa
8.2.2.5.4.1. Market Estimation, 2013 – 2018
8.2.2.5.4.2. Market Forecast, 2019 – 2027
8.2.2.5.5. Latin America
8.2.2.5.5.1. Market Estimation, 2013 – 2018
8.2.2.5.5.2. Market Forecast, 2019 – 2027
8.2.3. Photo Albums
8.2.3.1. Definition
8.2.3.2. Market Estimation and Penetration, 2013 – 2018
8.2.3.3. Market Forecast, 2019 – 2027
8.2.3.4. Compound Annual Growth Rate (CAGR)
8.2.3.5. Regional Bifurcation
8.2.3.5.1. North America
8.2.3.5.1.1. Market Estimation, 2013 – 2018
8.2.3.5.1.2. Market Forecast, 2019 – 2027
8.2.3.5.2. Europe
8.2.3.5.2.1. Market Estimation, 2013 – 2018
8.2.3.5.2.2. Market Forecast, 2019 – 2027
8.2.3.5.3. Asia Pacific
8.2.3.5.3.1. Market Estimation, 2013 – 2018
8.2.3.5.3.2. Market Forecast, 2019 – 2027
8.2.3.5.4. Middle East and Africa
8.2.3.5.4.1. Market Estimation, 2013 – 2018
8.2.3.5.4.2. Market Forecast, 2019 – 2027
8.2.3.5.5. Latin America
8.2.3.5.5.1. Market Estimation, 2013 – 2018
8.2.3.5.5.2. Market Forecast, 2019 – 2027
8.2.4. Calendars
8.2.4.1. Definition
8.2.4.2. Market Estimation and Penetration, 2013 – 2018
8.2.4.3. Market Forecast, 2019 – 2027
8.2.4.4. Compound Annual Growth Rate (CAGR)
8.2.4.5. Regional Bifurcation
8.2.4.5.1. North America
8.2.4.5.1.1. Market Estimation, 2013 – 2018
8.2.4.5.1.2. Market Forecast, 2019 – 2027
8.2.4.5.2. Europe
8.2.4.5.2.1. Market Estimation, 2013 – 2018
8.2.4.5.2.2. Market Forecast, 2019 – 2027
8.2.4.5.3. Asia Pacific
8.2.4.5.3.1. Market Estimation, 2013 – 2018
8.2.4.5.3.2. Market Forecast, 2019 – 2027
8.2.4.5.4. Middle East and Africa
8.2.4.5.4.1. Market Estimation, 2013 – 2018
8.2.4.5.4.2. Market Forecast, 2019 – 2027
8.2.4.5.5. Latin America
8.2.4.5.5.1. Market Estimation, 2013 – 2018
8.2.4.5.5.2. Market Forecast, 2019 – 2027
8.2.5. Photo Gifts
8.2.5.1. Definition
8.2.5.2. Market Estimation and Penetration, 2013 – 2018
8.2.5.3. Market Forecast, 2019 – 2027
8.2.5.4. Compound Annual Growth Rate (CAGR)
8.2.5.5. Regional Bifurcation
8.2.5.5.1. North America
8.2.5.5.1.1. Market Estimation, 2013 – 2018
8.2.5.5.1.2. Market Forecast, 2019 – 2027
8.2.5.5.2. Europe
8.2.5.5.2.1. Market Estimation, 2013 – 2018
8.2.5.5.2.2. Market Forecast, 2019 – 2027
8.2.5.5.3. Asia Pacific
8.2.5.5.3.1. Market Estimation, 2013 – 2018
8.2.5.5.3.2. Market Forecast, 2019 – 2027
8.2.5.5.4. Middle East and Africa
8.2.5.5.4.1. Market Estimation, 2013 – 2018
8.2.5.5.4.2. Market Forecast, 2019 – 2027
8.2.5.5.5. Latin America
8.2.5.5.5.1. Market Estimation, 2013 – 2018
8.2.5.5.5.2. Market Forecast, 2019 – 2027
8.2.6. Mugs
8.2.6.1. Definition
8.2.6.2. Market Estimation and Penetration, 2013 – 2018
8.2.6.3. Market Forecast, 2019 – 2027
8.2.6.4. Compound Annual Growth Rate (CAGR)
8.2.6.5. Regional Bifurcation
8.2.6.5.1. North America
8.2.6.5.1.1. Market Estimation, 2013 – 2018
8.2.6.5.1.2. Market Forecast, 2019 – 2027
8.2.6.5.2. Europe
8.2.6.5.2.1. Market Estimation, 2013 – 2018
8.2.6.5.2.2. Market Forecast, 2019 – 2027
8.2.6.5.3. Asia Pacific
8.2.6.5.3.1. Market Estimation, 2013 – 2018
8.2.6.5.3.2. Market Forecast, 2019 – 2027
8.2.6.5.4. Middle East and Africa
8.2.6.5.4.1. Market Estimation, 2013 – 2018
8.2.6.5.4.2. Market Forecast, 2019 – 2027
8.2.6.5.5. Latin America
8.2.6.5.5.1. Market Estimation, 2013 – 2018
8.2.6.5.5.2. Market Forecast, 2019 – 2027
8.2.7. Wall Art
8.2.7.1. Definition
8.2.7.2. Market Estimation and Penetration, 2013 – 2018
8.2.7.3. Market Forecast, 2019 – 2027
8.2.7.4. Compound Annual Growth Rate (CAGR)
8.2.7.5. Regional Bifurcation
8.2.7.5.1. North America
8.2.7.5.1.1. Market Estimation, 2013 – 2018
8.2.7.5.1.2. Market Forecast, 2019 – 2027
8.2.7.5.2. Europe
8.2.7.5.2.1. Market Estimation, 2013 – 2018
8.2.7.5.2.2. Market Forecast, 2019 – 2027
8.2.7.5.3. Asia Pacific
8.2.7.5.3.1. Market Estimation, 2013 – 2018
8.2.7.5.3.2. Market Forecast, 2019 – 2027
8.2.7.5.4. Middle East and Africa
8.2.7.5.4.1. Market Estimation, 2013 – 2018
8.2.7.5.4.2. Market Forecast, 2019 – 2027
8.2.7.5.5. Latin America
8.2.7.5.5.1. Market Estimation, 2013 – 2018
8.2.7.5.5.2. Market Forecast, 2019 – 2027
8.2.8. Gift Cards
8.2.8.1. Definition
8.2.8.2. Market Estimation and Penetration, 2013 – 2018
8.2.8.3. Market Forecast, 2019 – 2027
8.2.8.4. Compound Annual Growth Rate (CAGR)
8.2.8.5. Regional Bifurcation
8.2.8.5.1. North America
8.2.8.5.1.1. Market Estimation, 2013 – 2018
8.2.8.5.1.2. Market Forecast, 2019 – 2027
8.2.8.5.2. Europe
8.2.8.5.2.1. Market Estimation, 2013 – 2018
8.2.8.5.2.2. Market Forecast, 2019 – 2027
8.2.8.5.3. Asia Pacific
8.2.8.5.3.1. Market Estimation, 2013 – 2018
8.2.8.5.3.2. Market Forecast, 2019 – 2027
8.2.8.5.4. Middle East and Africa
8.2.8.5.4.1. Market Estimation, 2013 – 2018
8.2.8.5.4.2. Market Forecast, 2019 – 2027
8.2.8.5.5. Latin America
8.2.8.5.5.1. Market Estimation, 2013 – 2018
8.2.8.5.5.2. Market Forecast, 2019 – 2027
8.2.9. Others
8.2.9.1. Definition
8.2.9.2. Market Estimation and Penetration, 2013 – 2018
8.2.9.3. Market Forecast, 2019 – 2027
8.2.9.4. Compound Annual Growth Rate (CAGR)
8.2.9.5. Regional Bifurcation
8.2.9.5.1. North America
8.2.9.5.1.1. Market Estimation, 2013 – 2018
8.2.9.5.1.2. Market Forecast, 2019 – 2027
8.2.9.5.2. Europe
8.2.9.5.2.1. Market Estimation, 2013 – 2018
8.2.9.5.2.2. Market Forecast, 2019 – 2027
8.2.9.5.3. Asia Pacific
8.2.9.5.3.1. Market Estimation, 2013 – 2018
8.2.9.5.3.2. Market Forecast, 2019 – 2027
8.2.9.5.4. Middle East and Africa
8.2.9.5.4.1. Market Estimation, 2013 – 2018
8.2.9.5.4.2. Market Forecast, 2019 – 2027
8.2.9.5.5. Latin America
8.2.9.5.5.1. Market Estimation, 2013 – 2018
8.2.9.5.5.2. Market Forecast, 2019 – 2027
8.3. Key Segment for Channeling Investments
8.3.1. By Product Type
9. North America Photo Printing Products Market Analysis and
Forecasts, 2019 - 2027
9.1. Overview
9.1.1. North America Photo Printing Products Market Revenue (US$ Mn)
9.2. North America Photo Printing Products Market Revenue (US$ Mn)
and Forecasts, By Product Type
9.2.1. Photo Books
9.2.2. Prints
9.2.3. Photo Albums
9.2.4. Calendars
9.2.5. Photo Gifts
9.2.6. Mugs
9.2.7. Wall Art
9.2.8. Gift Cards
9.2.9. Others
9.3. North America Photo Printing Products Market Revenue (US$ Mn)
and Forecasts, By Country
9.3.1. U.S
9.3.1.1. U.S Photo Printing Products Market Revenue (US$ Mn) and
Forecasts, By Product Type
9.3.1.1.1. Photo Books
9.3.1.1.2. Prints
9.3.1.1.3. Photo Albums
9.3.1.1.4. Calendars
9.3.1.1.5. Photo Gifts
9.3.1.1.6. Mugs
9.3.1.1.7. Wall Art
9.3.1.1.8. Gift Cards
9.3.1.1.9. Others
9.3.2. Canada
9.3.2.1. Canada Photo Printing Products Market Revenue (US$ Mn) and
Forecasts, By Product Type
9.3.2.1.1. Photo Books
9.3.2.1.2. Prints
9.3.2.1.3. Photo Albums
9.3.2.1.4. Calendars
9.3.2.1.5. Photo Gifts
9.3.2.1.6. Mugs
9.3.2.1.7. Wall Art
9.3.2.1.8. Gift Cards
9.3.2.1.9. Others
9.3.3. Mexico
9.3.3.1. Mexico Photo Printing Products Market Revenue (US$ Mn) and
Forecasts, By Product Type
9.3.3.1.1. Photo Books
9.3.3.1.2. Prints
9.3.3.1.3. Photo Albums
9.3.3.1.4. Calendars
9.3.3.1.5. Photo Gifts
9.3.3.1.6. Mugs
9.3.3.1.7. Wall Art
9.3.3.1.8. Gift Cards
9.3.3.1.9. Others
9.3.4. Rest of North America
9.3.4.1. Rest of North America Photo Printing Products Market Revenue
(US$ Mn) and Forecasts, By Product Type
9.3.4.1.1. Photo Books
9.3.4.1.2. Prints
9.3.4.1.3. Photo Albums
9.3.4.1.4. Calendars
9.3.4.1.5. Photo Gifts
9.3.4.1.6. Mugs
9.3.4.1.7. Wall Art
9.3.4.1.8. Gift Cards
9.3.4.1.9. Others
9.4. Key Segment for Channeling Investments
9.4.1. By Country
9.4.2. By Product Type
10. Europe Photo Printing Products Market Analysis and Forecasts,
2019 - 2027
10.1. Overview
10.1.1. Europe Photo Printing Products Market Revenue (US$ Mn)
10.2. Europe Photo Printing Products Market Revenue (US$ Mn) and
Forecasts, By Product Type
10.2.1. Photo Books
10.2.2. Prints
10.2.3. Photo Albums
10.2.4. Calendars
10.2.5. Photo Gifts
10.2.6. Mugs
10.2.7. Wall Art
10.2.8. Gift Cards
10.2.9. Others
10.3. Europe Photo Printing Products Market Revenue (US$ Mn) and
Forecasts, By Country
10.3.1. France
10.3.1.1. France Photo Printing Products Market Revenue (US$ Mn) and
Forecasts, By Product Type
10.3.1.1.1. Photo Books
10.3.1.1.2. Prints
10.3.1.1.3. Photo Albums
10.3.1.1.4. Calendars
10.3.1.1.5. Photo Gifts
10.3.1.1.6. Mugs
10.3.1.1.7. Wall Art
10.3.1.1.8. Gift Cards
10.3.1.1.9. Others
10.3.2. The UK
10.3.2.1. The UK Photo Printing Products Market Revenue (US$ Mn) and
Forecasts, By Product Type
10.3.2.1.1. Photo Books
10.3.2.1.2. Prints
10.3.2.1.3. Photo Albums
10.3.2.1.4. Calendars
10.3.2.1.5. Photo Gifts
10.3.2.1.6. Mugs
10.3.2.1.7. Wall Art
10.3.2.1.8. Gift Cards
10.3.2.1.9. Others
10.3.3. Spain
10.3.3.1. Spain Photo Printing Products Market Revenue (US$ Mn) and
Forecasts, By Product Type
10.3.3.1.1. Photo Books
10.3.3.1.2. Prints
10.3.3.1.3. Photo Albums
10.3.3.1.4. Calendars
10.3.3.1.5. Photo Gifts
10.3.3.1.6. Mugs
10.3.3.1.7. Wall Art
10.3.3.1.8. Gift Cards
10.3.3.1.9. Others
10.3.4. Germany
10.3.4.1. Germany Photo Printing Products Market Revenue (US$ Mn) and
Forecasts, By Product Type
10.3.4.1.1. Photo Books
10.3.4.1.2. Prints
10.3.4.1.3. Photo Albums
10.3.4.1.4. Calendars
10.3.4.1.5. Photo Gifts
10.3.4.1.6. Mugs
10.3.4.1.7. Wall Art
10.3.4.1.8. Gift Cards
10.3.4.1.9. Others
10.3.5. Italy
10.3.5.1. Italy Photo Printing Products Market Revenue (US$ Mn) and
Forecasts, By Product Type
10.3.5.1.1. Photo Books
10.3.5.1.2. Prints
10.3.5.1.3. Photo Albums
10.3.5.1.4. Calendars
10.3.5.1.5. Photo Gifts
10.3.5.1.6. Mugs
10.3.5.1.7. Wall Art
10.3.5.1.8. Gift Cards
10.3.5.1.9. Others
10.3.6. Nordic Countries
10.3.6.1. Nordic Countries Photo Printing Products Market Revenue (US$
Mn) and Forecasts, By Product Type
10.3.6.1.1. Photo Books
10.3.6.1.2. Prints
10.3.6.1.3. Photo Albums
10.3.6.1.4. Calendars
10.3.6.1.5. Photo Gifts
10.3.6.1.6. Mugs
10.3.6.1.7. Wall Art
10.3.6.1.8. Gift Cards
10.3.6.1.9. Others
10.3.6.2. Nordic Countries Photo Printing Products Market Revenue (US$
Mn) and Forecasts, By Country
10.3.6.2.1. Denmark
10.3.6.2.2. Finland
10.3.6.2.3. Iceland
10.3.6.2.4. Sweden
10.3.6.2.5. Norway
10.3.7. Benelux Union
10.3.7.1. Benelux Union Photo Printing Products Market Revenue (US$ Mn)
and Forecasts, By Product Type
10.3.7.1.1. Photo Books
10.3.7.1.2. Prints
10.3.7.1.3. Photo Albums
10.3.7.1.4. Calendars
10.3.7.1.5. Photo Gifts
10.3.7.1.6. Mugs
10.3.7.1.7. Wall Art
10.3.7.1.8. Gift Cards
10.3.7.1.9. Others
10.3.7.2. Benelux Union Photo Printing Products Market Revenue (US$ Mn)
and Forecasts, By Country
10.3.7.2.1. Belgium
10.3.7.2.2. The Netherlands
10.3.7.2.3. Luxembourg
10.3.8. Rest of Europe
10.3.8.1. Rest of Europe Photo Printing Products Market Revenue (US$ Mn)
and Forecasts, By Product Type
10.3.8.1.1. Photo Books
10.3.8.1.2. Prints
10.3.8.1.3. Photo Albums
10.3.8.1.4. Calendars
10.3.8.1.5. Photo Gifts
10.3.8.1.6. Mugs
10.3.8.1.7. Wall Art
10.3.8.1.8. Gift Cards
10.3.8.1.9. Others
10.4. Key Segment for Channeling Investments
10.4.1. By Country
10.4.2. By Product Type
11. Asia Pacific Photo Printing Products Market Analysis and
Forecasts, 2019 - 2027
11.1. Overview
11.1.1. Asia Pacific Photo Printing Products Market Revenue (US$ Mn)
11.2. Asia Pacific Photo Printing Products Market Revenue (US$ Mn)
and Forecasts, By Product Type
11.2.1. Photo Books
11.2.2. Prints
11.2.3. Photo Albums
11.2.4. Calendars
11.2.5. Photo Gifts
11.2.6. Mugs
11.2.7. Wall Art
11.2.8. Gift Cards
11.2.9. Others
11.3. Asia Pacific Photo Printing Products Market Revenue (US$ Mn)
and Forecasts, By Country
11.3.1. China
11.3.1.1. China Photo Printing Products Market Revenue (US$ Mn) and
Forecasts, By Product Type
11.3.1.1.1. Photo Books
11.3.1.1.2. Prints
11.3.1.1.3. Photo Albums
11.3.1.1.4. Calendars
11.3.1.1.5. Photo Gifts
11.3.1.1.6. Mugs
11.3.1.1.7. Wall Art
11.3.1.1.8. Gift Cards
11.3.1.1.9. Others
11.3.2. Japan
11.3.2.1. Japan Photo Printing Products Market Revenue (US$ Mn) and
Forecasts, By Product Type
11.3.2.1.1. Photo Books
11.3.2.1.2. Prints
11.3.2.1.3. Photo Albums
11.3.2.1.4. Calendars
11.3.2.1.5. Photo Gifts
11.3.2.1.6. Mugs
11.3.2.1.7. Wall Art
11.3.2.1.8. Gift Cards
11.3.2.1.9. Others
11.3.3. India
11.3.3.1. India Photo Printing Products Market Revenue (US$ Mn) and
Forecasts, By Product Type
11.3.3.1.1. Photo Books
11.3.3.1.2. Prints
11.3.3.1.3. Photo Albums
11.3.3.1.4. Calendars
11.3.3.1.5. Photo Gifts
11.3.3.1.6. Mugs
11.3.3.1.7. Wall Art
11.3.3.1.8. Gift Cards
11.3.3.1.9. Others
11.3.4. New Zealand
11.3.4.1. New Zealand Photo Printing Products Market Revenue (US$ Mn)
and Forecasts, By Product Type
11.3.4.1.1. Photo Books
11.3.4.1.2. Prints
11.3.4.1.3. Photo Albums
11.3.4.1.4. Calendars
11.3.4.1.5. Photo Gifts
11.3.4.1.6. Mugs
11.3.4.1.7. Wall Art
11.3.4.1.8. Gift Cards
11.3.4.1.9. Others
11.3.5. Australia
11.3.5.1. Australia Photo Printing Products Market Revenue (US$ Mn) and
Forecasts, By Product Type
11.3.5.1.1. Photo Books
11.3.5.1.2. Prints
11.3.5.1.3. Photo Albums
11.3.5.1.4. Calendars
11.3.5.1.5. Photo Gifts
11.3.5.1.6. Mugs
11.3.5.1.7. Wall Art
11.3.5.1.8. Gift Cards
11.3.5.1.9. Others
11.3.6. South Korea
11.3.6.1. South Korea Photo Printing Products Market Revenue (US$ Mn)
and Forecasts, By Product Type
11.3.6.1.1. Photo Books
11.3.6.1.2. Prints
11.3.6.1.3. Photo Albums
11.3.6.1.4. Calendars
11.3.6.1.5. Photo Gifts
11.3.6.1.6. Mugs
11.3.6.1.7. Wall Art
11.3.6.1.8. Gift Cards
11.3.6.1.9. Others
11.3.7. Southeast Asia
11.3.7.1. Southeast Asia Photo Printing Products Market Revenue (US$ Mn)
and Forecasts, By Product Type
11.3.7.1.1. Photo Books
11.3.7.1.2. Prints
11.3.7.1.3. Photo Albums
11.3.7.1.4. Calendars
11.3.7.1.5. Photo Gifts
11.3.7.1.6. Mugs
11.3.7.1.7. Wall Art
11.3.7.1.8. Gift Cards
11.3.7.1.9. Others
11.3.7.2. Southeast Asia Photo Printing Products Market Revenue (US$ Mn)
and Forecasts, By Country
11.3.7.2.1. Indonesia
11.3.7.2.2. Thailand
11.3.7.2.3. Malaysia
11.3.7.2.4. Singapore
11.3.7.2.5. Rest of Southeast Asia
11.3.8. Rest of Asia Pacific
11.3.8.1. Rest of Asia Pacific Photo Printing Products Market Revenue
(US$ Mn) and Forecasts, By Product Type
11.3.8.1.1. Photo Books
11.3.8.1.2. Prints
11.3.8.1.3. Photo Albums
11.3.8.1.4. Calendars
11.3.8.1.5. Photo Gifts
11.3.8.1.6. Mugs
11.3.8.1.7. Wall Art
11.3.8.1.8. Gift Cards
11.3.8.1.9. Others
11.4. Key Segment for Channeling Investments
11.4.1. By Country
11.4.2. By Product Type
12. Middle East and Africa Photo Printing Products Market
Analysis and Forecasts, 2019 - 2027
12.1. Overview
12.1.1. Middle East and Africa Photo Printing Products Market Revenue
(US$ Mn)
12.2. Middle East and Africa Photo Printing Products Market Revenue
(US$ Mn) and Forecasts, By Product Type
12.2.1. Photo Books
12.2.2. Prints
12.2.3. Photo Albums
12.2.4. Calendars
12.2.5. Photo Gifts
12.2.6. Mugs
12.2.7. Wall Art
12.2.8. Gift Cards
12.2.9. Others
12.3. Middle East and Africa Photo Printing Products Market Revenue
(US$ Mn) and Forecasts, By Country
12.3.1. Saudi Arabia
12.3.1.1. Saudi Arabia Photo Printing Products Market Revenue (US$ Mn)
and Forecasts, By Product Type
12.3.1.1.1. Photo Books
12.3.1.1.2. Prints
12.3.1.1.3. Photo Albums
12.3.1.1.4. Calendars
12.3.1.1.5. Photo Gifts
12.3.1.1.6. Mugs
12.3.1.1.7. Wall Art
12.3.1.1.8. Gift Cards
12.3.1.1.9. Others
12.3.2. UAE
12.3.2.1. UAE Photo Printing Products Market Revenue (US$ Mn) and
Forecasts, By Product Type
12.3.2.1.1. Photo Books
12.3.2.1.2. Prints
12.3.2.1.3. Photo Albums
12.3.2.1.4. Calendars
12.3.2.1.5. Photo Gifts
12.3.2.1.6. Mugs
12.3.2.1.7. Wall Art
12.3.2.1.8. Gift Cards
12.3.2.1.9. Others
12.3.3. Egypt
12.3.3.1. Egypt Photo Printing Products Market Revenue (US$ Mn) and
Forecasts, By Product Type
12.3.3.1.1. Photo Books
12.3.3.1.2. Prints
12.3.3.1.3. Photo Albums
12.3.3.1.4. Calendars
12.3.3.1.5. Photo Gifts
12.3.3.1.6. Mugs
12.3.3.1.7. Wall Art
12.3.3.1.8. Gift Cards
12.3.3.1.9. Others
12.3.4. Kuwait
12.3.4.1. Kuwait Photo Printing Products Market Revenue (US$ Mn) and
Forecasts, By Product Type
12.3.4.1.1. Photo Books
12.3.4.1.2. Prints
12.3.4.1.3. Photo Albums
12.3.4.1.4. Calendars
12.3.4.1.5. Photo Gifts
12.3.4.1.6. Mugs
12.3.4.1.7. Wall Art
12.3.4.1.8. Gift Cards
12.3.4.1.9. Others
12.3.5. South Africa
12.3.5.1. South Africa Photo Printing Products Market Revenue (US$ Mn)
and Forecasts, By Product Type
12.3.5.1.1. Photo Books
12.3.5.1.2. Prints
12.3.5.1.3. Photo Albums
12.3.5.1.4. Calendars
12.3.5.1.5. Photo Gifts
12.3.5.1.6. Mugs
12.3.5.1.7. Wall Art
12.3.5.1.8. Gift Cards
12.3.5.1.9. Others
12.3.6. Rest of Middle East & Africa
12.3.6.1. Rest of Middle East & Africa Photo Printing Products
Market Revenue (US$ Mn) and Forecasts, By Product Type
12.3.6.1.1. Photo Books
12.3.6.1.2. Prints
12.3.6.1.3. Photo Albums
12.3.6.1.4. Calendars
12.3.6.1.5. Photo Gifts
12.3.6.1.6. Mugs
12.3.6.1.7. Wall Art
12.3.6.1.8. Gift Cards
12.3.6.1.9. Others
12.4. Key Segment for Channeling Investments
12.4.1. By Country
12.4.2. By Product Type
13. Latin America Photo Printing Products Market Analysis and
Forecasts, 2019 - 2027
13.1. Overview
13.1.1. Latin America Photo Printing Products Market Revenue (US$ Mn)
13.2. Latin America Photo Printing Products Market Revenue (US$ Mn)
and Forecasts, By Product Type
13.2.1. Photo Books
13.2.2. Prints
13.2.3. Photo Albums
13.2.4. Calendars
13.2.5. Photo Gifts
13.2.6. Mugs
13.2.7. Wall Art
13.2.8. Gift Cards
13.2.9. Others
13.3. Latin America Photo Printing Products Market Revenue (US$ Mn)
and Forecasts, By Country
13.3.1. Brazil
13.3.1.1. Brazil Photo Printing Products Market Revenue (US$ Mn) and
Forecasts, By Product Type
13.3.1.1.1. Photo Books
13.3.1.1.2. Prints
13.3.1.1.3. Photo Albums
13.3.1.1.4. Calendars
13.3.1.1.5. Photo Gifts
13.3.1.1.6. Mugs
13.3.1.1.7. Wall Art
13.3.1.1.8. Gift Cards
13.3.1.1.9. Others
13.3.2. Argentina
13.3.2.1. Argentina Photo Printing Products Market Revenue (US$ Mn) and
Forecasts, By Product Type
13.3.2.1.1. Photo Books
13.3.2.1.2. Prints
13.3.2.1.3. Photo Albums
13.3.2.1.4. Calendars
13.3.2.1.5. Photo Gifts
13.3.2.1.6. Mugs
13.3.2.1.7. Wall Art
13.3.2.1.8. Gift Cards
13.3.2.1.9. Others
13.3.3. Rest of Latin America
13.3.3.1. Rest of Latin America Photo Printing Products Market Revenue
(US$ Mn) and Forecasts, By Product Type
13.3.3.1.1. Photo Books
13.3.3.1.2. Prints
13.3.3.1.3. Photo Albums
13.3.3.1.4. Calendars
13.3.3.1.5. Photo Gifts
13.3.3.1.6. Mugs
13.3.3.1.7. Wall Art
13.3.3.1.8. Gift Cards
13.3.3.1.9. Others
13.4. Key Segment for Channeling Investments
13.4.1. By Country
13.4.2. By Product Type
14. Competitive Benchmarking
14.1. Brand Benchmarking
14.2. Market Share Analysis
14.3. Global Presence and Growth Strategies
14.3.1. Mergers and Acquisitions
14.3.2. Product Launches
14.3.3. Investments Trends
14.3.4. R&D Initiatives
15. Player Profiles
15.1. Mpix
15.1.1. Company Details
15.1.2. Company Overview
15.1.3. Product Offerings
15.1.4. Key Developments
15.1.5. Financial Analysis
15.1.6. SWOT Analysis
15.1.7. Business Strategies
15.2. Peak Imaging
15.2.1. Company Details
15.2.2. Company Overview
15.2.3. Product Offerings
15.2.4. Key Developments
15.2.5. Financial Analysis
15.2.6. SWOT Analysis
15.2.7. Business Strategies
15.3. PhotoBox Ltd.
15.3.1. Company Details
15.3.2. Company Overview
15.3.3. Product Offerings
15.3.4. Key Developments
15.3.5. Financial Analysis
15.3.6. SWOT Analysis
15.3.7. Business Strategies
15.4. Snapfish
15.4.1. Company Details
15.4.2. Company Overview
15.4.3. Product Offerings
15.4.4. Key Developments
15.4.5. Financial Analysis
15.4.6. SWOT Analysis
15.4.7. Business Strategies
15.5. Shutterfly, Inc.
15.5.1. Company Details
15.5.2. Company Overview
15.5.3. Product Offerings
15.5.4. Key Developments
15.5.5. Financial Analysis
15.5.6. SWOT Analysis
15.5.7. Business Strategies
15.6. Other Market Participants
16. Key Findings
Note: This ToC is tentative and can
be changed according to the research study conducted during the course of
report completion.
**Exclusive for Multi-User and
Enterprise User.
At Absolute Markets Insights, we are engaged in building both global as well as country specific reports. As a result, the approach taken for deriving the estimation and forecast for a specific country is a bit unique and different in comparison to the global research studies. In this case, we not only study the concerned market factors & trends prevailing in a particular country (from secondary research) but we also tend to calculate the actual market size & forecast from the revenue generated from the market participants involved in manufacturing or distributing the any concerned product. These companies can also be service providers. For analyzing any country specifically, we do consider the growth factors prevailing under the states/cities/county for the same. For instance, if we are analyzing an industry specific to United States, we primarily need to study about the states present under the same(where the product/service has the highest growth). Similar analysis will be followed by other countries. Our scope of the report changes with different markets.
Our research study is mainly implement through a mix of both secondary and primary research. Various sources such as industry magazines, trade journals, and government websites and trade associations are reviewed for gathering precise data. Primary interviews are conducted to validate the market size derived from secondary research. Industry experts, major manufacturers and distributors are contacted for further validation purpose on the current market penetration and growth trends.
Prominent participants in our primary research process include:
- Key Opinion Leaders namely the CEOs, CSOs, VPs, purchasing managers, amongst others
- Research and development participants, distributors/suppliers and subject matter experts
Secondary Research includes data extracted from paid data sources:
- Reuters
- Factiva
- Bloomberg
- One Source
- Hoovers
Research Methodology

Key Inclusions


