Global Pod Taxi Market By Application (City Centers, Airports, Business & Industrial Parks, University Campus, Shopping Centers, Theme Parks & Resorts, Large Hospitals Areas, Others); By Region (North America, Europe, Asia Pacific, Middle East & Africa, Latin America) – Global Insights, Growth, Size, Comparative Analysis, Trends and Forecast, 2020 - 2028
Industry Trends
Pod taxi, also known as personal rapid transit (PRT), is a public transport system developed for traveling swiftly in congested areas. These cars operate much like the traditional rail and streetcar network and are built above busy roads and highways. Pod cars are automated driverless vehicles and can carry up to six people at a time. Pod car is a revolutionary transport concept which is environment-friendly possessing the ability to be fuelled by solar power and other renewal power sources, thereby aiding in limiting the adversities concerning pollution in densely populated areas. The Ultra pod system, for instance, helps in the reduction of carbon emissions by about 50%, as compared to fossil fuel-powered buses. Factors such as environment sustainability and reduction in congestion are propelling the growth of the global pod taxi market. The countries globally are heading towards high-end technology, and a few countries have also initiated the deployment of pod taxi system. Morgantown in West Virginia has a sprawling network of PRT and gained popularity since 1975. Masdar City of UAE has also established the same in 2010. An ultra-PRT has been set up at London Heathrow Airport as well. The PRT runs at a maximum speed of 45 kmph. Recently, several PRT stations have been made operational in Suncheon city of South Korea for a 40-vehicle system. The success rate of PRT is quite high in these cities. Government authorities in developing countries are also investing profusely towards the construction of sustainable alternative form of public transportation network. In the Indian city of Gurugram, for instance, the current public transportation system is unable to meet the entire needs of the travellers, which is worsening the concerns pertaining to crowd and traffic congestion during peak hours. The National Highway Authority of India (NHAI) have invested towards the establishment of Delhi-Gurugaon Pod Taxi corridor, to be carried out as a public private partnership project. According the initial project plan laid out by the authority, about 800 to 1100 pod taxis/PRT care are anticipated to be floated in the initial years. The pod taxi system in Gurgaon is expected to cost the government around US$ 540 Mn, and will be built on Automated People Mover (APM) standards. With the introduction of pod taxis in the developing and developed countries in the world, and the growing focus on intelligent transport systems by government bodies, the global pod taxi market is expected to be a lucrative investment option in the coming years.
Accidents as a result of traffic congestion have been a major concern in urban cities. In India's capital city of New Delhi, for instance, over 570 individuals lost their lives in two-wheeler related accidents in 2018. Metro systems are being increasingly developed in developing cities. However, the concerns regarding the higher cost of infrastructure, coupled with the added convenience of transportation on-demand by PRT is expected to provide the latter an edge over the metro systems. Furthermore, the PRT systems are being designed to run on renewable sources of energy, which helps in reducing the carbon footprint. Pod taxis are built with features such as vehicle arrival audio and video visual warning system, surveillance using CCTV, audio communication, platform sloping to prevent injuries, evacuation of misaligned vehicles, amongst others. With the government bodies mulling over various pod taxi projects, private entities are forming partnerships for the development of PRTs. India's conglomerate Reliance, for instance, is partnering with SkyTran for the development of pod taxis in various locations in India. Once the trial runs are completed, Reliance is expected to get into agreements with government bodies both at the State and Central level. The prototype is expected to boost the Government of India's, Make in India initiate, as majority of the parts are to be developed in India. Therefore, the partnerships by private companies, with the involvement of the government bodies, are expected to boost the growth of the global pod taxi market during the forecast years.
The recent outbreak of coronavirus pandemic has affected countries across continents. Government bodies in the affected countries have imposed nationwide lockdown to inhibit the spread of this infectious disease. Pod taxis are expected to provide an effective medium for transport while ensuring compliance with social distancing norms. The automated taxi aids in recording the details of the passengers, which will eventually help to trace down passengers. The COVID-19 pandemic has created a sense of health awareness among people which is anticipated to prevail even in the post-COVID-19 phase. This along with sustained demand for fast and secure travel amongst individuals will influence the growth of pod taxi market. Thus, the coronavirus pandemic is anticipated to have a positive impact on the global pod taxi market.
By Application
Based on application, the pod taxi market are classified into city centers, airports, business & industrial parks, university campuses, shopping centers, theme parks & resorts, large hospitals areas, amongst others. In 2018, the airport segment accounted for the highest market share. This can be attributed to the lesser maintenance and installation cost as compared to other existing airport transport system. In addition, it resolves many of the drawbacks of air travel such as queues, elevators, and the continuous barrage of public address announcements. Personal rapid transit also showcases competitive advantage over the conventional transit alternatives in providing point-to-point connectivity. It also offers higher privacy and comfort to the passengers as they can avail personalized transportation services. These factors are anticipated to drive the growth of the pod taxi market worldwide.
By Region
North America contributes a significant share to the global pod taxi market owing to the growing investment and initiatives taken by the government entities to optimize the travel experience. For instance, in 2016, the University of Texas approved a pod taxi initiative to modernize many of the system’s internal components, repair the guideway, and eventually phase out Boeing’s original cars. The estimated budget of the project was $100 million in total. The project is about halfway through its second phase. This phase includes replacing the core of its automated controls with help from France's industrial electronics company Thales. However, Asia Pacific is expected to grow with the highest CAGR over the forecast period owing to the growing investment by government agencies to modernize the public transport system. For instance, the Indian government, in collaboration with various private firms, invested around INR 4000 crore in the pod taxi project, with an aim is to eliminate chaos caused by traffic congestion during the peak hours. The project is being constructed on a public-private partnership (PPP) basis, and the initial phase will cover a total stretch of 12.3 Km. Singapore is also expected to invest more into their public rapid transit projects, as the country is trying to provide advanced public transport facilities to its individuals. Singapore's public transport operator, SMRT has entered into a partnership with 2getthere, which is sustainable mobility firm, for the rolling out of pod taxis in the near future. The joint venture in Singapore is called as 2getthere Asia. These pods are designed to be fully electric, and will run on lithium iron phosphate batteries, with a top speed of 40 kmph. Passenger safety features like obstacle detection are expected to be incorporated in the pod taxis. In their more advanced versions, these pods are expected to accommodate around 24 individuals at a time.
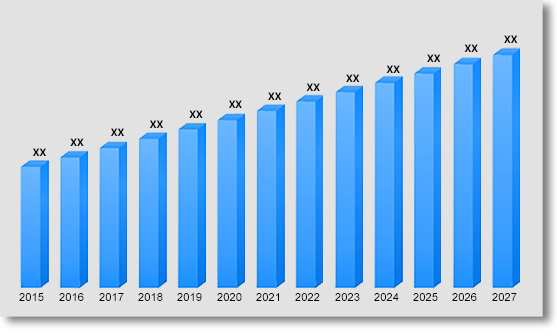
In terms of revenue, global pod taxi market was valued at US$ US$ 8.01 Bn in 2019 and is anticipated to grow at a CAGR of 18.30 % over the forecast period (2020 – 2028). The study analyses the market in terms of revenue across all the major regions.
Global Pod Taxi Market Revenue & Forecast, (US$ Million), 2015 – 2028
Competitive Landscape
The report provides both, qualitative and quantitative research of pod taxi market, as well as provides comprehensive insights and development methods adopted by the key contenders. The report also offers extensive research on the key players in this market and details on the competitiveness of these players. Key business strategies such as mergers and acquisitions (M&A), affiliations, collaborations, and contracts adopted by these major market participants are also recognized and analysed in the report. For each company, the report studies their global presence, competitors, service offerings and specification amongst others.
Some of the players operating in the global pod taxi market card market are Fairwood Group, Metrino-PRT, skyTran, Vectus Ltd. and www.2getthere.eu.amongst others.
Global Pod Taxi Market:
- By Application
- City Centers
- Airports
- Business & Industrial Parks
- University Campus
- Shopping Centers
- Theme Parks & Resorts
- Large Hospitals Areas
- Others
- By Region
- North America
- Europe
- Asia Pacific
- Middle East and Africa
- Latin America
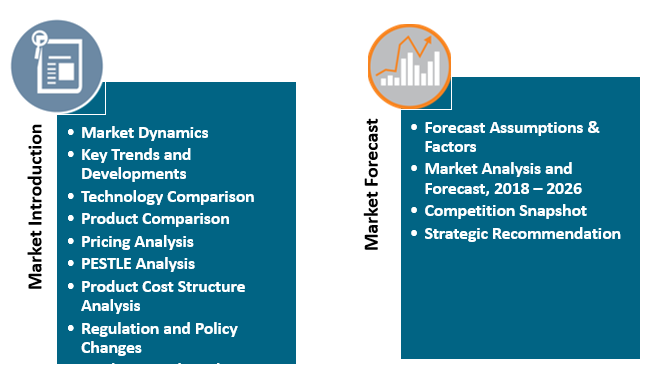
Table of Contents
![]()
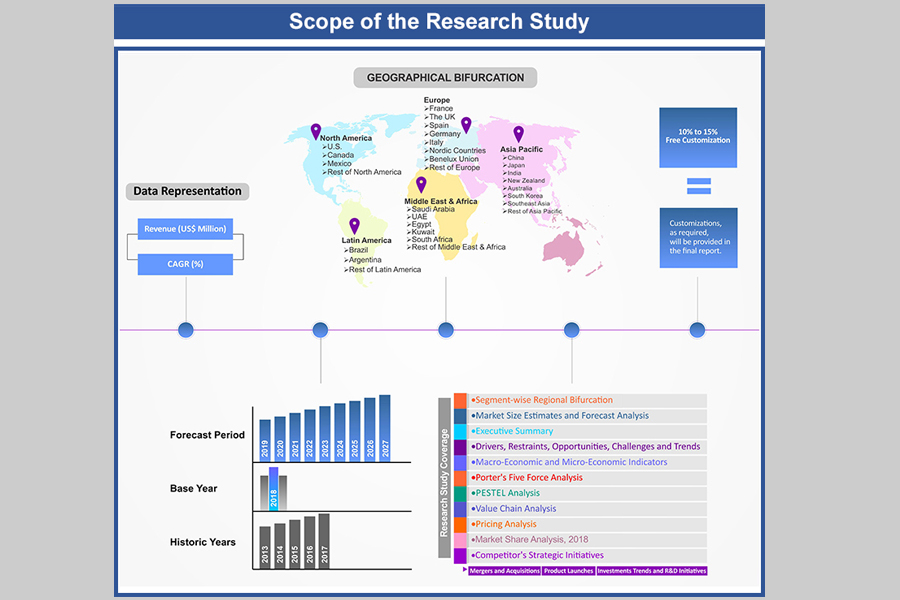
1. Market
Scope
1.1. Market
Segmentation
1.2. Years
Considered
1.2.1. Historic
Years: 2015 - 2017
1.2.2. Base
Year: 2018
1.2.3. Forecast
Years: 2019 – 2027
2. Key Target
Audiences
3. Research
Methodology
3.1. Primary
Research
3.1.1. Research
Questionnaire
3.1.2. Global
Percentage Breakdown
3.1.3. Primary
Interviews: Key Opinion Leaders (KOLs)
3.2. Secondary
Research
3.2.1. Paid
Databases
3.2.2. Secondary
Sources
3.3. Market
Size Estimates
3.3.1. Top-Down
Approach
3.3.2. Bottom-Up
Approach
3.4. Data
Triangulation Methodology
3.5. Research
Assumptions
4. Recommendations
and Insights from AMI’s Perspective**
5. Holistic
Overview of POD Taxi Market
6. Market
Synopsis: POD Taxi Market
7. POD Taxi
Market Analysis: Qualitative Perspective
7.1. Introduction
7.1.1. Product
Definition
7.1.2. Industry
Development
7.2. Market
Dynamics
7.2.1. Drivers
7.2.2. Restraints
7.2.3. Opportunities
7.3. Trends in
POD Taxi Market
7.4. Market
Determinants Radar Chart
7.5. Macro-Economic
and Micro-Economic Indicators: POD Taxi Market
7.6. Porter’s
Five Force Analysis
7.7. PESTEL Analysis
7.8. Analysis
on Impact of Covid-19 on Global POD Taxi Market
8. Global POD
Taxi Market Analysis and Forecasts, 2019 – 2027
8.1. Overview
8.1.1. Global
POD Taxi Market Revenue (US$ Mn)
8.2. Global POD
Taxi Market Revenue (US$ Mn) and Forecasts, By Application
8.2.1. City
Centers
8.2.1.1. Definition
8.2.1.2. Market
Estimation and Penetration, 2015 – 2018
8.2.1.3. Market
Forecast, 2019 – 2027
8.2.1.4. Compound
Annual Growth Rate (CAGR)
8.2.1.5. Regional
Bifurcation
8.2.1.5.1. North
America
8.2.1.5.1.1. Market Estimation, 2015 – 2018
8.2.1.5.1.2. Market Forecast, 2019 – 2027
8.2.1.5.2. Europe
8.2.1.5.2.1. Market Estimation, 2015 – 2018
8.2.1.5.2.2. Market Forecast, 2019 – 2027
8.2.1.5.3. Asia
Pacific
8.2.1.5.3.1. Market Estimation, 2015 – 2018
8.2.1.5.3.2. Market Forecast, 2019 – 2027
8.2.1.5.4. Middle
East and Africa
8.2.1.5.4.1. Market Estimation, 2015 – 2018
8.2.1.5.4.2. Market Forecast, 2019 – 2027
8.2.1.5.5. Latin
America
8.2.1.5.5.1. Market Estimation, 2015 – 2018
8.2.1.5.5.2. Market Forecast, 2019 – 2027
8.2.2. Airports
8.2.2.1. Definition
8.2.2.2. Market
Estimation and Penetration, 2015 – 2018
8.2.2.3. Market
Forecast, 2019 – 2027
8.2.2.4. Compound
Annual Growth Rate (CAGR)
8.2.2.5. Regional
Bifurcation
8.2.2.5.1. North
America
8.2.2.5.1.1. Market Estimation, 2015 – 2018
8.2.2.5.1.2. Market Forecast, 2019 – 2027
8.2.2.5.2. Europe
8.2.2.5.2.1. Market Estimation, 2015 – 2018
8.2.2.5.2.2. Market Forecast, 2019 – 2027
8.2.2.5.3. Asia
Pacific
8.2.2.5.3.1. Market Estimation, 2015 – 2018
8.2.2.5.3.2. Market Forecast, 2019 – 2027
8.2.2.5.4. Middle
East and Africa
8.2.2.5.4.1. Market Estimation, 2015 – 2018
8.2.2.5.4.2. Market Forecast, 2019 – 2027
8.2.2.5.5. Latin
America
8.2.2.5.5.1. Market Estimation, 2015 – 2018
8.2.2.5.5.2. Market Forecast, 2019 – 2027
8.2.3. Business
and Industrial Parks
8.2.3.1. Definition
8.2.3.2. Market
Estimation and Penetration, 2015 – 2018
8.2.3.3. Market
Forecast, 2019 – 2027
8.2.3.4. Compound
Annual Growth Rate (CAGR)
8.2.3.5. Regional
Bifurcation
8.2.3.5.1. North
America
8.2.3.5.1.1. Market Estimation, 2015 – 2018
8.2.3.5.1.2. Market Forecast, 2019 – 2027
8.2.3.5.2. Europe
8.2.3.5.2.1. Market Estimation, 2015 – 2018
8.2.3.5.2.2. Market Forecast, 2019 – 2027
8.2.3.5.3. Asia
Pacific
8.2.3.5.3.1. Market Estimation, 2015 – 2018
8.2.3.5.3.2. Market Forecast, 2019 – 2027
8.2.3.5.4. Middle
East and Africa
8.2.3.5.4.1. Market Estimation, 2015 – 2018
8.2.3.5.4.2. Market Forecast, 2019 – 2027
8.2.3.5.5. Latin
America
8.2.3.5.5.1. Market Estimation, 2015 – 2018
8.2.3.5.5.2. Market Forecast, 2019 – 2027
8.2.4. University
Campus
8.2.4.1. Definition
8.2.4.2. Market
Estimation and Penetration, 2015 – 2018
8.2.4.3. Market
Forecast, 2019 – 2027
8.2.4.4. Compound
Annual Growth Rate (CAGR)
8.2.4.5. Regional
Bifurcation
8.2.4.5.1. North
America
8.2.4.5.1.1. Market Estimation, 2015 – 2018
8.2.4.5.1.2. Market Forecast, 2019 – 2027
8.2.4.5.2. Europe
8.2.4.5.2.1. Market Estimation, 2015 – 2018
8.2.4.5.2.2. Market Forecast, 2019 – 2027
8.2.4.5.3. Asia
Pacific
8.2.4.5.3.1. Market Estimation, 2015 – 2018
8.2.4.5.3.2. Market Forecast, 2019 – 2027
8.2.4.5.4. Middle
East and Africa
8.2.4.5.4.1. Market Estimation, 2015 – 2018
8.2.4.5.4.2. Market Forecast, 2019 – 2027
8.2.4.5.5. Latin
America
8.2.4.5.5.1. Market Estimation, 2015 – 2018
8.2.4.5.5.2. Market Forecast, 2019 – 2027
8.2.5. Shopping
Centers
8.2.5.1. Definition
8.2.5.2. Market
Estimation and Penetration, 2015 – 2018
8.2.5.3. Market
Forecast, 2019 – 2027
8.2.5.4. Compound
Annual Growth Rate (CAGR)
8.2.5.5. Regional
Bifurcation
8.2.5.5.1. North
America
8.2.5.5.1.1. Market Estimation, 2015 – 2018
8.2.5.5.1.2. Market Forecast, 2019 – 2027
8.2.5.5.2. Europe
8.2.5.5.2.1. Market Estimation, 2015 – 2018
8.2.5.5.2.2. Market Forecast, 2019 – 2027
8.2.5.5.3. Asia
Pacific
8.2.5.5.3.1. Market Estimation, 2015 – 2018
8.2.5.5.3.2. Market Forecast, 2019 – 2027
8.2.5.5.4. Middle
East and Africa
8.2.5.5.4.1. Market Estimation, 2015 – 2018
8.2.5.5.4.2. Market Forecast, 2019 – 2027
8.2.5.5.5. Latin
America
8.2.5.5.5.1. Market Estimation, 2015 – 2018
8.2.5.5.5.2. Market Forecast, 2019 – 2027
8.2.6. Theme
Parks and Resorts
8.2.6.1. Definition
8.2.6.2. Market
Estimation and Penetration, 2015 – 2018
8.2.6.3. Market
Forecast, 2019 – 2027
8.2.6.4. Compound
Annual Growth Rate (CAGR)
8.2.6.5. Regional
Bifurcation
8.2.6.5.1. North
America
8.2.6.5.1.1. Market Estimation, 2015 – 2018
8.2.6.5.1.2. Market Forecast, 2019 – 2027
8.2.6.5.2. Europe
8.2.6.5.2.1. Market Estimation, 2015 – 2018
8.2.6.5.2.2. Market Forecast, 2019 – 2027
8.2.6.5.3. Asia
Pacific
8.2.6.5.3.1. Market Estimation, 2015 – 2018
8.2.6.5.3.2. Market Forecast, 2019 – 2027
8.2.6.5.4. Middle
East and Africa
8.2.6.5.4.1. Market Estimation, 2015 – 2018
8.2.6.5.4.2. Market Forecast, 2019 – 2027
8.2.6.5.5. Latin
America
8.2.6.5.5.1. Market Estimation, 2015 – 2018
8.2.6.5.5.2. Market Forecast, 2019 – 2027
8.2.7. Large
Hospitals Areas
8.2.7.1. Definition
8.2.7.2. Market
Estimation and Penetration, 2015 – 2018
8.2.7.3. Market
Forecast, 2019 – 2027
8.2.7.4. Compound
Annual Growth Rate (CAGR)
8.2.7.5. Regional
Bifurcation
8.2.7.5.1. North
America
8.2.7.5.1.1. Market Estimation, 2015 – 2018
8.2.7.5.1.2. Market Forecast, 2019 – 2027
8.2.7.5.2. Europe
8.2.7.5.2.1. Market Estimation, 2015 – 2018
8.2.7.5.2.2. Market Forecast, 2019 – 2027
8.2.7.5.3. Asia
Pacific
8.2.7.5.3.1. Market Estimation, 2015 – 2018
8.2.7.5.3.2. Market Forecast, 2019 – 2027
8.2.7.5.4. Middle
East and Africa
8.2.7.5.4.1. Market Estimation, 2015 – 2018
8.2.7.5.4.2. Market Forecast, 2019 – 2027
8.2.7.5.5. Latin
America
8.2.7.5.5.1. Market Estimation, 2015 – 2018
8.2.7.5.5.2. Market Forecast, 2019 – 2027
8.2.8. Others
8.2.8.1. Definition
8.2.8.2. Market
Estimation and Penetration, 2015 – 2018
8.2.8.3. Market
Forecast, 2019 – 2027
8.2.8.4. Compound
Annual Growth Rate (CAGR)
8.2.8.5. Regional
Bifurcation
8.2.8.5.1. North
America
8.2.8.5.1.1. Market Estimation, 2015 – 2018
8.2.8.5.1.2. Market Forecast, 2019 – 2027
8.2.8.5.2. Europe
8.2.8.5.2.1. Market Estimation, 2015 – 2018
8.2.8.5.2.2. Market Forecast, 2019 – 2027
8.2.8.5.3. Asia
Pacific
8.2.8.5.3.1. Market Estimation, 2015 – 2018
8.2.8.5.3.2. Market Forecast, 2019 – 2027
8.2.8.5.4. Middle
East and Africa
8.2.8.5.4.1. Market Estimation, 2015 – 2018
8.2.8.5.4.2. Market Forecast, 2019 – 2027
8.2.8.5.5. Latin
America
8.2.8.5.5.1. Market Estimation, 2015 – 2018
8.2.8.5.5.2. Market Forecast, 2019 – 2027
8.3. Key
Segment for Channeling Investments
8.3.1. By
Application
9. North
America POD Taxi Market Analysis and Forecasts, 2019 - 2027
9.1. Overview
9.1.1. North
America POD Taxi Market Revenue (US$ Mn)
9.2. North
America POD Taxi Market Revenue (US$ Mn) and Forecasts, By Application
9.2.1. City
Centers
9.2.2. Airports
9.2.3. Business
and Industrial Parks
9.2.4. University
Campus
9.2.5. Shopping
Centers
9.2.6. Theme
Parks and Resorts
9.2.7. Large
Hospitals Areas
9.2.8. Others
9.3. Key
Segment for Channeling Investments
9.3.1. By
Application
10. Europe POD
Taxi Market Analysis and Forecasts, 2019 - 2027
10.1. Overview
10.1.1. Europe
POD Taxi Market Revenue (US$ Mn)
10.2. Europe
POD Taxi Market Revenue (US$ Mn) and Forecasts, By Application
10.2.1. City
Centers
10.2.2. Airports
10.2.3. Business
and Industrial Parks
10.2.4. University
Campus
10.2.5. Shopping
Centers
10.2.6. Theme
Parks and Resorts
10.2.7. Large
Hospitals Areas
10.2.8. Others
10.3. Key
Segment for Channeling Investments
10.3.1. By
Application
11. Asia
Pacific POD Taxi Market Analysis and Forecasts, 2019 - 2027
11.1. Overview
11.1.1. Asia
Pacific POD Taxi Market Revenue (US$ Mn)
11.2. Asia
Pacific POD Taxi Market Revenue (US$ Mn) and Forecasts, By Application
11.2.1. City
Centers
11.2.2. Airports
11.2.3. Business
and Industrial Parks
11.2.4. University
Campus
11.2.5. Shopping
Centers
11.2.6. Theme
Parks and Resorts
11.2.7. Large
Hospitals Areas
11.2.8. Others
11.3. Key
Segment for Channeling Investments
11.3.1. By
Application
12. Middle
East and Africa POD Taxi Market Analysis and Forecasts, 2019 - 2027
12.1. Overview
12.1.1. Middle
East and Africa POD Taxi Market Revenue (US$ Mn)
12.2. Middle
East and Africa POD Taxi Market Revenue (US$ Mn) and Forecasts, By Application
12.2.1. City
Centers
12.2.2. Airports
12.2.3. Business
and Industrial Parks
12.2.4. University
Campus
12.2.5. Shopping
Centers
12.2.6. Theme
Parks and Resorts
12.2.7. Large
Hospitals Areas
12.2.8. Others
12.3. Key
Segment for Channeling Investments
12.3.1. By
Application
13. Latin
America POD Taxi Market Analysis and Forecasts, 2019 - 2027
13.1. Overview
13.1.1. Latin
America POD Taxi Market Revenue (US$ Mn)
13.2. Latin
America POD Taxi Market Revenue (US$ Mn) and Forecasts, By Application
13.2.1. City
Centers
13.2.2. Airports
13.2.3. Business
and Industrial Parks
13.2.4. University
Campus
13.2.5. Shopping
Centers
13.2.6. Theme
Parks and Resorts
13.2.7. Large
Hospitals Areas
13.2.8. Others
13.3. Key
Segment for Channeling Investments
13.3.1. By
Application
14. Competitive
Benchmarking
14.1. Market
Share Analysis, 2018
14.2. Global
Presence and Growth Strategies
14.2.1. Mergers
and Acquisitions
14.2.2. Product
Launches
14.2.3. Investments
Trends
14.2.4. R&D
Initiatives
15. Player
Profiles
15.1. Fairwood
Group.
15.1.1. Company
Details
15.1.2. Company
Overview
15.1.3. Product
Offerings
15.1.4. Key
Developments
15.1.5. Financial
Analysis
15.1.6. SWOT
Analysis
15.1.7. Business
Strategies
15.2. Metrino-PRT
15.2.1. Company
Details
15.2.2. Company
Overview
15.2.3. Product
Offerings
15.2.4. Key
Developments
15.2.5. Financial
Analysis
15.2.6. SWOT
Analysis
15.2.7. Business
Strategies
15.3. skyTran
15.3.1. Company
Details
15.3.2. Company
Overview
15.3.3. Product
Offerings
15.3.4. Key
Developments
15.3.5. Financial
Analysis
15.3.6. SWOT
Analysis
15.3.7. Business
Strategies
15.4. Vectus
Ltd.
15.4.1. Company
Details
15.4.2. Company
Overview
15.4.3. Product
Offerings
15.4.4. Key
Developments
15.4.5. Financial
Analysis
15.4.6. SWOT
Analysis
15.4.7. Business
Strategies
15.5. www.2getthere.eu.
15.5.1. Company
Details
15.5.2. Company
Overview
15.5.3. Product
Offerings
15.5.4. Key
Developments
15.5.5. Financial
Analysis
15.5.6. SWOT
Analysis
15.5.7. Business
Strategies
15.6. Other
Industry Participants
16. Key
Findings
Note: This ToC is tentative
and can be changed according to the research study conducted during the course
of report completion.
**Exclusive for Multi-User and
Enterprise User
At Absolute Markets Insights, we are engaged in building both global as well as country specific reports. As a result, the approach taken for deriving the estimation and forecast for a specific country is a bit unique and different in comparison to the global research studies. In this case, we not only study the concerned market factors & trends prevailing in a particular country (from secondary research) but we also tend to calculate the actual market size & forecast from the revenue generated from the market participants involved in manufacturing or distributing the any concerned product. These companies can also be service providers. For analyzing any country specifically, we do consider the growth factors prevailing under the states/cities/county for the same. For instance, if we are analyzing an industry specific to United States, we primarily need to study about the states present under the same(where the product/service has the highest growth). Similar analysis will be followed by other countries. Our scope of the report changes with different markets.
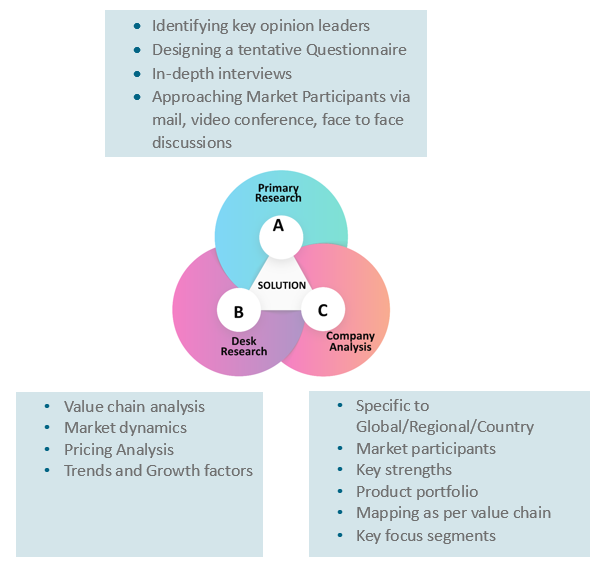
Our research study is mainly implement through a mix of both secondary and primary research. Various sources such as industry magazines, trade journals, and government websites and trade associations are reviewed for gathering precise data. Primary interviews are conducted to validate the market size derived from secondary research. Industry experts, major manufacturers and distributors are contacted for further validation purpose on the current market penetration and growth trends.
Prominent participants in our primary research process include:
- Key Opinion Leaders namely the CEOs, CSOs, VPs, purchasing managers, amongst others
- Research and development participants, distributors/suppliers and subject matter experts
Secondary Research includes data extracted from paid data sources:
- Reuters
- Factiva
- Bloomberg
- One Source
- Hoovers
Research Methodology
Key Inclusions
Why Absolute Markets Insights?
An effective strategy is the entity that influences a business to stand out of the crowd. An organization with a phenomenal strategy for success dependably has the edge over the rivals in the market. It offers the organizations a head start in planning their strategy. Absolute Market Insights is the new initiation in the industry that will furnish you with the lead your business needs. Absolute Market Insights is the best destination for your business intelligence and analytical solutions; essentially because our qualitative and quantitative sources of information are competent to give one-stop solutions. We inventively combine qualitative and quantitative research in accurate proportions to have the best report, which not only gives the most recent insights but also assists you to grow.
