
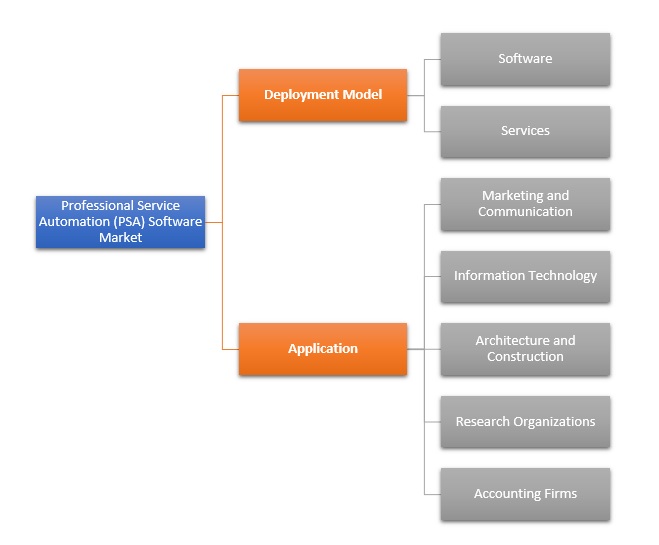
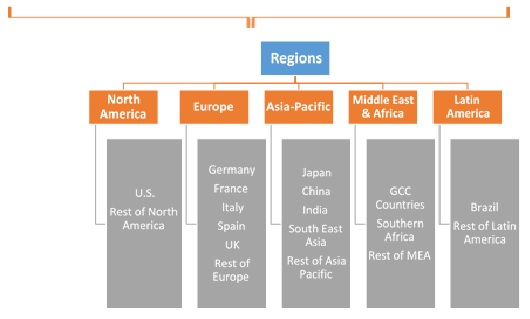
Professional Service Automation (PSA) Software Market by Deployment Model (Software, Services); by Application (Marketing and Communication, Information Technology, Architecture and Construction, Research Organizations, Accounting Firms); by Regional outlook (U.S., Rest of North America, France, UK, Germany, Spain, Italy, Rest of Europe, China, Japan, India, Southeast Asia, Rest of Asia Pacific, GCC Countries, Southern Africa, Rest of MEA, Brazil, Rest of Latin America) – Global Insights, Growth, Size, Comparative Analysis, Trends and Forecast, 2018 - 2026
Industry Trends
PSA software help service oriented companies in optimizing and streamlining their business, relying on a set of organizational tools such as data gathering, data sharing, analytics and metric generation. It helps professional service providers manage client engagement throughout the project lifecycle.
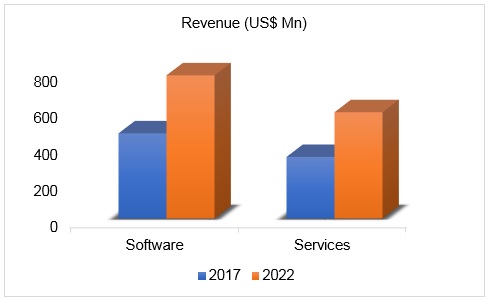
The professional service automation (PSA) software market, in terms of revenue, which was estimated at US$ 802.3 million in 2017, is expected to reach US$ 1364.07 million by 2022.
Professional Service Automation (PSA) Software Market, By Deployment Model, 2017 & 2022 (US$ Million)
Professional service automation software provides the perfect alternative to the array of separate time tracking, invoicing, project management, resource planning, business intelligence and collaboration tools that are being utilized by many teams in the corporate structure. The PSA software was initially developed to address the concerns of the professional service sectors, which included consultants, lawyers and other professional service teams but now it is witnessing a wider adoption in project-based industries. The main driver for the wide spread adoption of PSA software is the improvement in profit margins from the deployment of these software. The centralization of project data enabled through PSA solutions provide visibility into performance metrics like cost, revenue, profit margins, and utilization.
However, with PSA implementation, the clashes between a new system and an already established enterprise system arise, thereby obstructing the growth of the industry.
Professional Service Automation (PSA) Software Market, By Deployment Model
On the basis of deployment, software segment is expected to be the largest segment in global professional service automation (PSA) software market. The enhanced transparency in processes of a project such as time tracking, billing invoicing, expense management, and resource and labor allocation that is brought out by the deployment of PSA software is driving the demand for this software globally. Various industries have recognized the pivotal role PSA software which plays an important role in increasing the efficiency and productivity of their projects and hence are instrumental in driving the market forward.
Professional Service Automation (PSA) Software Market, By Region
On the basis of geography, North America held the largest PSA software market share in terms of revenue. This growth is attributed to the rapid adoption of technologies in the industries located in this region. Along with this, the investment in the deployment of these software is the highest in North America. The U.S. constituted approximately 86% market share in this region.
Competitive Landscape
The report provides both, qualitative and quantitative research of the market, as well as provides worthy insights into the rational scenario and favored development methods adopted by the key contenders. The report also offers extensive research on the key players in this market and detailed insights on the competitiveness of these players. The key business strategies such as mergers & acquisitions (M&A), affiliations, collaborations, and contracts adopted by the major players are also recognized and analyzed in the report. For each company, the professional service automation (PSA) software market report recognizes their manufacturing base, competitors, product/service type, application and specification, pricing, and gross margin.
Some of the primary market participants are Atera Networks Ltd., Changepoint Corporation, Clarizen, ConnectWise, Inc., Deltek, inc, FinancialForce.com, Inc., Harmony Business Systems Ltd., Infor, Kaseya Limited, Kimble Applications Inc., Mavenlink, LLC, Oracle Corporation, Projector PSA, Promys PSA, SOFTRAX, Inc. (a subsidiary of AFS Technologies, Inc.), Unanet Technologies, Inc., Upland Software, Inc., Vista Equity Partners LLC (Autotask Corporation), Workday, Inc. amongst others.

Professional Service Automation (PSA) Software Industry Background
1. Introduction
1.1. Market Scope
1.2. Market Segmentation
1.3. Methodology
1.4. Assumptions
2. Professional Service Automation (PSA) Software Market
Snapshot
3. Executive Summary: Professional Service Automation (PSA)
Software Market
4. Qualitative Analysis: Professional Service Automation (PSA)
Software Market
4.1. Introduction
4.1.1. Product Definition
4.1.2. Industry Development
4.2. Market Dynamics
4.2.1. Drivers
4.2.2. Restraints
4.2.3. Opportunities
4.3. Trends in Market
5. Global Professional Service Automation (PSA) Software Market
Analysis and Forecasts, 2018 – 2026
5.1. Overview
5.1.1. Global Professional Service Automation (PSA) Software Market
Revenue (US$ Mn) and Forecasts
5.2. Global Market Revenue (US$ Mn) and Forecasts, By Deployment
Model
5.2.1. Software
5.2.1.1. Definition
5.2.1.2. Market Penetration
5.2.1.3. Market Revenue Expected to Increase by 2026
5.2.1.4. Compound Annual Growth Rate (CAGR)
5.2.2. Services
5.2.2.1. Definition
5.2.2.2. Market Penetration
5.2.2.3. Market Revenue Expected to Increase by 2026
5.2.2.4. Compound Annual Growth Rate (CAGR)
5.3. Key Segment for Channeling Investments
5.3.1. By Deployment Model
6. Global Professional Service Automation (PSA) Software Market
Analysis and Forecasts, 2018 – 2026
6.1. Overview
6.2. Global Professional Service Automation (PSA) Software Market
Revenue (US$ Mn) and Forecasts, By Application
6.2.1. Marketing and Communication
6.2.1.1. Definition
6.2.1.2. Market Penetration
6.2.1.3. Market Revenue Expected to Increase by 2026
6.2.1.4. Compound Annual Growth Rate (CAGR)
6.2.2. Information Technology
6.2.2.1. Definition
6.2.2.2. Market Penetration
6.2.2.3. Market Revenue Expected to Increase by 2026
6.2.2.4. Compound Annual Growth Rate (CAGR)
6.2.3. Architecture and Construction
6.2.3.1. Definition
6.2.3.2. Market Penetration
6.2.3.3. Market Revenue Expected to Increase by 2026
6.2.3.4. Compound Annual Growth Rate (CAGR)
6.2.4. Research Organizations
6.2.4.1. Definition
6.2.4.2. Market Penetration
6.2.4.3. Market Revenue Expected to Increase by 2026
6.2.4.4. Compound Annual Growth Rate (CAGR)
6.2.5. Accounting Firms
6.2.5.1. Definition
6.2.5.2. Market Penetration
6.2.5.3. Market Revenue Expected to Increase by 2026
6.2.5.4. Compound Annual Growth Rate (CAGR)
6.3. Key Segment for Channeling Investments
6.3.1. By Application
7. North America Professional Service Automation (PSA) Software
Market Analysis and Forecasts, 2018 – 2026
7.1. Overview
7.1.1. North America Market Revenue (US$ Mn)
7.2. North America Professional Service Automation (PSA) Software
Market Revenue (US$ Mn) and Forecasts, By Deployment Model
7.2.1. Software
7.2.2. Services
7.3. North America Market Revenue (US$ Mn) and Forecasts, By
Application
7.3.1. Marketing and Communication
7.3.2. Information Technology
7.3.3. Architecture and Construction
7.3.4. Research Organizations
7.3.5. Accounting Firms
7.4. North America Professional Service Automation (PSA) Software
Market Revenue (US$ Mn) and Forecasts, By Country
7.4.1. U.S.
7.4.1.1. U.S. Professional Service Automation (PSA) Software Market
Revenue (US$ Mn) and Forecasts, By Deployment Model
7.4.1.1.1. Software
7.4.1.1.2. Services
7.4.1.2. U.S. Market Revenue (US$ Mn) and Forecasts, By Application
7.4.1.2.1. Marketing and Communication
7.4.1.2.2. Information Technology
7.4.1.2.3. Architecture and Construction
7.4.1.2.4. Research Organizations
7.4.1.2.5. Accounting Firms
7.4.2. Rest of North America
7.4.2.1. Rest of North America Professional Service Automation (PSA)
Software Market Revenue (US$ Mn) and Forecasts, By Deployment Model
7.4.2.1.1. Software
7.4.2.1.2. Services
7.4.2.2. Rest of North America Market Revenue (US$ Mn) and Forecasts,
By Application
7.4.2.2.1. Marketing and Communication
7.4.2.2.2. Information Technology
7.4.2.2.3. Architecture and Construction
7.4.2.2.4. Research Organizations
7.4.2.2.5. Accounting Firms
7.5. Key Segment for Channeling Investments
7.5.1. By Country
7.5.2. By Deployment Model
7.5.3. By Application
8. Europe Professional Service Automation (PSA) Software Market
Analysis and Forecasts, 2018 – 2026
8.1. Overview
8.1.1. Europe Market Revenue (US$ Mn)
8.2. Europe Professional Service Automation (PSA) Software Market
Revenue (US$ Mn) and Forecasts, By Deployment Model
8.2.1. Software
8.2.2. Services
8.3. Europe Market Revenue (US$ Mn) and Forecasts, By Application
8.3.1. Marketing and Communication
8.3.2. Information Technology
8.3.3. Architecture and Construction
8.3.4. Research Organizations
8.3.5. Accounting Firms
8.4. Europe Professional Service Automation (PSA) Software Market
Revenue (US$ Mn) and Forecasts, By Country
8.4.1. France
8.4.1.1. France Professional Service Automation (PSA) Software Market
Revenue (US$ Mn) and Forecasts, By Deployment Model
8.4.1.1.1. Software
8.4.1.1.2. Services
8.4.1.2. France Market Revenue (US$ Mn) and Forecasts, By Application
8.4.1.2.1. Marketing and Communication
8.4.1.2.2. Information Technology
8.4.1.2.3. Architecture and Construction
8.4.1.2.4. Research Organizations
8.4.1.2.5. Accounting Firms
8.4.2. The UK
8.4.2.1. The UK Professional Service Automation (PSA) Software Market
Revenue (US$ Mn) and Forecasts, By Deployment Model
8.4.2.1.1. Software
8.4.2.1.2. Services
8.4.2.2. The UK Market Revenue (US$ Mn) and Forecasts, By Application
8.4.2.2.1. Marketing and Communication
8.4.2.2.2. Information Technology
8.4.2.2.3. Architecture and Construction
8.4.2.2.4. Research Organizations
8.4.2.2.5. Accounting Firms
8.4.3. Spain
8.4.3.1. Spain Professional Service Automation (PSA) Software Market
Revenue (US$ Mn) and Forecasts, By Deployment Model
8.4.3.1.1. Software
8.4.3.1.2. Services
8.4.3.2. Spain Professional Service Automation (PSA) Software Market
Revenue (US$ Mn) and Forecasts, By Application
8.4.3.2.1. Marketing and Communication
8.4.3.2.2. Information Technology
8.4.3.2.3. Architecture and Construction
8.4.3.2.4. Research Organizations
8.4.3.2.5. Accounting Firms
8.4.4. Germany
8.4.4.1. Germany Professional Service Automation (PSA) Software Market
Revenue (US$ Mn) and Forecasts, By Deployment Model
8.4.4.1.1. Software
8.4.4.1.2. Services
8.4.4.2. Germany Market Revenue (US$ Mn) and Forecasts, By Application
8.4.4.2.1. Marketing and Communication
8.4.4.2.2. Information Technology
8.4.4.2.3. Architecture and Construction
8.4.4.2.4. Research Organizations
8.4.4.2.5. Accounting Firms
8.4.5. Italy
8.4.5.1. Italy Professional Service Automation (PSA) Software Market
Revenue (US$ Mn) and Forecasts, By Deployment Model
8.4.5.1.1. Software
8.4.5.1.2. Services
8.4.5.2. Italy Market Revenue (US$ Mn) and Forecasts, By Application
8.4.5.2.1. Marketing and Communication
8.4.5.2.2. Information Technology
8.4.5.2.3. Architecture and Construction
8.4.5.2.4. Research Organizations
8.4.5.2.5. Accounting Firms
8.4.6. Rest of Europe
8.4.6.1. Rest of Europe Professional Service Automation (PSA) Software
Market Revenue (US$ Mn) and Forecasts, By Deployment Model
8.4.6.1.1. Software
8.4.6.1.2. Services
8.4.6.2. Rest of Europe Market Revenue (US$ Mn) and Forecasts, By
Application
8.4.6.2.1. Marketing and Communication
8.4.6.2.2. Information Technology
8.4.6.2.3. Architecture and Construction
8.4.6.2.4. Research Organizations
8.4.6.2.5. Accounting Firms
8.5. Key Segment for Channeling Investments
8.5.1. By Country
8.5.2. By Deployment Model
8.5.3. By Application
9. Asia Pacific Professional Service Automation (PSA) Software
Market Analysis and Forecasts, 2018 – 2026
9.1. Overview
9.1.1. Asia Pacific Market Revenue (US$ Mn)
9.2. Asia Pacific Professional Service Automation (PSA) Software
Market Revenue (US$ Mn) and Forecasts, By Deployment Model
9.2.1. Software
9.2.2. Services
9.3. Asia Pacific Market Revenue (US$ Mn) and Forecasts, By
Application
9.3.1. Marketing and Communication
9.3.2. Information Technology
9.3.3. Architecture and Construction
9.3.4. Research Organizations
9.3.5. Accounting Firms
9.4. Asia Pacific Professional Service Automation (PSA) Software
Market Revenue (US$ Mn) and Forecasts, By Country
9.4.1. China
9.4.1.1. China Professional Service Automation (PSA) Software Market
Revenue (US$ Mn) and Forecasts, By Deployment Model
9.4.1.1.1. Software
9.4.1.1.2. Services
9.4.1.2. China Market Revenue (US$ Mn) and Forecasts, By Application
9.4.1.2.1. Marketing and Communication
9.4.1.2.2. Information Technology
9.4.1.2.3. Architecture and Construction
9.4.1.2.4. Research Organizations
9.4.1.2.5. Accounting Firms
9.4.2. Japan
9.4.2.1. Japan Professional Service Automation (PSA) Software Market
Revenue (US$ Mn) and Forecasts, By Deployment Model
9.4.2.1.1. Software
9.4.2.1.2. Services
9.4.2.2. Japan Market Revenue (US$ Mn) and Forecasts, By Application
9.4.2.2.1. Marketing and Communication
9.4.2.2.2. Information Technology
9.4.2.2.3. Architecture and Construction
9.4.2.2.4. Research Organizations
9.4.2.2.5. Accounting Firms
9.4.3. India
9.4.3.1. India Professional Service Automation (PSA) Software Market
Revenue (US$ Mn) and Forecasts, By Deployment Model
9.4.3.1.1. Software
9.4.3.1.2. Services
9.4.3.2. India Market Revenue (US$ Mn) and Forecasts, By Application
9.4.3.2.1. Marketing and Communication
9.4.3.2.2. Information Technology
9.4.3.2.3. Architecture and Construction
9.4.3.2.4. Research Organizations
9.4.3.2.5. Accounting Firms
9.4.4. Southeast Asia
9.4.4.1. Southeast Asia Professional Service Automation (PSA) Software
Market Revenue (US$ Mn) and Forecasts, By Deployment Model
9.4.4.1.1. Software
9.4.4.1.2. Services
9.4.4.2. Southeast Asia Market Revenue (US$ Mn) and Forecasts, By Application
9.4.4.2.1. Marketing and Communication
9.4.4.2.2. Information Technology
9.4.4.2.3. Architecture and Construction
9.4.4.2.4. Research Organizations
9.4.4.2.5. Accounting Firms
9.4.5. Rest of Asia Pacific
9.4.5.1. Rest of Asia Pacific Professional Service Automation (PSA)
Software Market Revenue (US$ Mn) and Forecasts, By Deployment Model
9.4.5.1.1. Software
9.4.5.1.2. Services
9.4.5.2. Rest of Asia Pacific Professional Service Automation (PSA)
Software Market Revenue (US$ Mn) and Forecasts, By Application
9.4.5.2.1. Marketing and Communication
9.4.5.2.2. Information Technology
9.4.5.2.3. Architecture and Construction
9.4.5.2.4. Research Organizations
9.4.5.2.5. Accounting Firms
9.5. Key Segment for Channeling Investments
9.5.1. By Country
9.5.2. By Deployment Model
9.5.3. By Application
10. Middle East and Africa Professional Service Automation (PSA)
Software Market Analysis and Forecasts, 2018 – 2026
10.1. Overview
10.1.1. Middle East and Africa Market Revenue (US$ Mn)
10.2. Middle East and Africa Market Revenue (US$ Mn) and Forecasts,
By Deployment Model
10.2.1. Software
10.2.2. Services
10.3. Middle East and Africa Professional Service Automation (PSA)
Software Market Revenue (US$ Mn) and Forecasts, By Application
10.3.1. Marketing and Communication
10.3.2. Information Technology
10.3.3. Architecture and Construction
10.3.4. Research Organizations
10.3.5. Accounting Firms
10.4. Middle East and Africa Market Revenue (US$ Mn) and Forecasts,
By Country
10.4.1. GCC Countries
10.4.1.1. GCC Countries Professional Service Automation (PSA) Software
Market Revenue (US$ Mn) and Forecasts, By Deployment Model
10.4.1.1.1. Software
10.4.1.1.2. Services
10.4.1.2. GCC Countries Market Revenue (US$ Mn) and Forecasts, By
Application
10.4.1.2.1. Marketing and Communication
10.4.1.2.2. Information Technology
10.4.1.2.3. Architecture and Construction
10.4.1.2.4. Research Organizations
10.4.1.2.5. Accounting Firms
10.4.2. Southern Africa
10.4.2.1. Southern Africa Professional Service Automation (PSA) Software
Market Revenue (US$ Mn) and Forecasts, By Deployment Model
10.4.2.1.1. Software
10.4.2.1.2. Services
10.4.2.2. Southern Africa Market Revenue (US$ Mn) and Forecasts, By
Application
10.4.2.2.1. Marketing and Communication
10.4.2.2.2. Information Technology
10.4.2.2.3. Architecture and Construction
10.4.2.2.4. Research Organizations
10.4.2.2.5. Accounting Firms
10.4.3. Rest of MEA
10.4.3.1. Rest of MEA Professional Service Automation (PSA) Software
Market Revenue (US$ Mn) and Forecasts, By Deployment Model
10.4.3.1.1. Software
10.4.3.1.2. Services
10.4.3.2. Rest of MEA Market Revenue (US$ Mn) and Forecasts, By
Application
10.4.3.2.1. Marketing and Communication
10.4.3.2.2. Information Technology
10.4.3.2.3. Architecture and Construction
10.4.3.2.4. Research Organizations
10.4.3.2.5. Accounting Firms
10.5. Key Segment for Channeling Investments
10.5.1. By Country
10.5.2. By Deployment Model
10.5.3. By Application
11. Latin America Professional Service Automation (PSA) Software
Market Analysis and Forecasts, 2018 – 2026
11.1. Overview
11.1.1. Latin America Market Revenue (US$ Mn)
11.2. Latin America Professional Service Automation (PSA) Software
Market Revenue (US$ Mn) and Forecasts, By Deployment Model
11.2.1. Software
11.2.2. Services
11.3. Latin America Market Revenue (US$ Mn) and Forecasts, By
Application
11.3.1. Marketing and Communication
11.3.2. Information Technology
11.3.3. Architecture and Construction
11.3.4. Research Organizations
11.3.5. Accounting Firms
11.4. Latin America Professional Service Automation (PSA) Software
Market Revenue (US$ Mn) and Forecasts, By Country
11.4.1. Brazil
11.4.1.1. Brazil Professional Service Automation (PSA) Software Market
Revenue (US$ Mn) and Forecasts, By Deployment Model
11.4.1.1.1. Software
11.4.1.1.2. Services
11.4.1.2. Brazil Market Revenue (US$ Mn) and Forecasts, By Application
11.4.1.2.1. Marketing and Communication
11.4.1.2.2. Information Technology
11.4.1.2.3. Architecture and Construction
11.4.1.2.4. Research Organizations
11.4.1.2.5. Accounting Firms
11.4.2. Rest of Latin America
11.4.2.1. Rest of Latin America Professional Service Automation (PSA)
Software Market Revenue (US$ Mn) and Forecasts, By Deployment Model
11.4.2.1.1. Software
11.4.2.1.2. Services
11.4.2.2. Rest of Latin America Market Revenue (US$ Mn) and Forecasts,
By Application
11.4.2.2.1. Marketing and Communication
11.4.2.2.2. Information Technology
11.4.2.2.3. Architecture and Construction
11.4.2.2.4. Research Organizations
11.4.2.2.5. Accounting Firms
11.5. Key Segment for Channeling Investments
11.5.1. By Country
11.5.2. By Deployment Model
11.5.3. By Application
12. Competitive Benchmarking
12.1. Player Positioning Analysis
12.2. Global Presence and Growth Strategies
13. Player Profiles
13.1. Atera Networks Ltd.
13.1.1. Company Details
13.1.2. Company Overview
13.1.3. Product Offerings
13.1.4. Key Developments
13.1.5. Financial Analysis
13.1.6. SWOT Analysis
13.1.7. Business Strategies
13.2. Changepoint Corporation
13.2.1. Company Details
13.2.2. Company Overview
13.2.3. Product Offerings
13.2.4. Key Developments
13.2.5. Financial Analysis
13.2.6. SWOT Analysis
13.2.7. Business Strategies
13.3. Clarizen
13.3.1. Company Details
13.3.2. Company Overview
13.3.3. Product Offerings
13.3.4. Key Developments
13.3.5. Financial Analysis
13.3.6. SWOT Analysis
13.3.7. Business Strategies
13.4. ConnectWise, Inc.
13.4.1. Company Details
13.4.2. Company Overview
13.4.3. Product Offerings
13.4.4. Key Developments
13.4.5. Financial Analysis
13.4.6. SWOT Analysis
13.4.7. Business Strategies
13.5. Deltek, inc
13.5.1. Company Details
13.5.2. Company Overview
13.5.3. Product Offerings
13.5.4. Key Developments
13.5.5. Financial Analysis
13.5.6. SWOT Analysis
13.5.7. Business Strategies
13.6. FinancialForce.com, Inc.
13.6.1. Company Details
13.6.2. Company Overview
13.6.3. Product Offerings
13.6.4. Key Developments
13.6.5. Financial Analysis
13.6.6. SWOT Analysis
13.6.7. Business Strategies
13.7. Harmony Business Systems Ltd.
13.7.1. Company Details
13.7.2. Company Overview
13.7.3. Product Offerings
13.7.4. Key Developments
13.7.5. Financial Analysis
13.7.6. SWOT Analysis
13.7.7. Business Strategies
13.8. Infor
13.8.1. Company Details
13.8.2. Company Overview
13.8.3. Product Offerings
13.8.4. Key Developments
13.8.5. Financial Analysis
13.8.6. SWOT Analysis
13.8.7. Business Strategies
13.9. Kaseya Limited
13.9.1. Company Details
13.9.2. Company Overview
13.9.3. Product Offerings
13.9.4. Key Developments
13.9.5. Financial Analysis
13.9.6. SWOT Analysis
13.9.7. Business Strategies
13.10. Kimble Applications Inc.
13.10.1. Company Details
13.10.2. Company Overview
13.10.3. Product Offerings
13.10.4. Key Developments
13.10.5. Financial Analysis
13.10.6. SWOT Analysis
13.10.7. Business Strategies
13.11. Mavenlink, LLC
13.11.1.
Company Details
13.11.2.
Company Overview
13.11.3.
Product Offerings
13.11.4.
Key Developments
13.11.5.
Financial Analysis
13.11.6.
SWOT Analysis
13.11.7. Business Strategies
13.12. Oracle Corporation
13.12.1.
Company Details
13.12.2.
Company Overview
13.12.3.
Product Offerings
13.12.4. Key Developments
13.12.5.
Financial Analysis
13.12.6.
SWOT Analysis
13.12.7. Business Strategies
13.13. Projector PSA
13.13.1.
Company Details
13.13.2.
Company Overview
13.13.3.
Product Offerings
13.13.4.
Key Developments
13.13.5.
Financial Analysis
13.13.6.
SWOT Analysis
13.13.7. Business Strategies
13.14. Promys PSA
13.14.1.
Company Details
13.14.2.
Company Overview
13.14.3.
Product Offerings
13.14.4.
Key Developments
13.14.5.
Financial Analysis
13.14.6.
SWOT Analysis
13.14.7. Business Strategies
13.15. SOFTRAX, Inc. (a subsidiary of AFS Technologies, Inc.)
13.15.1.
Company Details
13.15.2.
Company Overview
13.15.3.
Product Offerings
13.15.4.
Key Developments
13.15.5.
Financial Analysis
13.15.6.
SWOT Analysis
13.15.7. Business Strategies
13.16. Unanet Technologies, Inc.
13.16.1.
Company Details
13.16.2.
Company Overview
13.16.3.
Product Offerings
13.16.4.
Key Developments
13.16.5.
Financial Analysis
13.16.6.
SWOT Analysis
13.16.7.
Business Strategies
13.17. Upland Software, Inc.
13.17.1.
Company Details
13.17.2.
Company Overview
13.17.3.
Product Offerings
13.17.4.
Key Developments
13.17.5.
Financial Analysis
13.17.6.
SWOT Analysis
13.17.7. Business Strategies
13.18. Vista Equity Partners LLC (Autotask Corporation)
13.18.1.
Company Details
13.18.2.
Company Overview
13.18.3.
Product Offerings
13.18.4.
Key Developments
13.18.5.
Financial Analysis
13.18.6.
SWOT Analysis
13.18.7. Business Strategies
13.19. Workday, Inc.
13.19.1.
Company Details
13.19.2.
Company Overview
13.19.3.
Product Offerings
13.19.4.
Key Developments
13.19.5.
Financial Analysis
13.19.6.
SWOT Analysis
13.19.7. Business Strategies
Note: This ToC is
tentative and can be changed according to the research study conducted during
the course of report completion.
At Absolute Markets Insights, we are engaged in building both global as well as country specific reports. As a result, the approach taken for deriving the estimation and forecast for a specific country is a bit unique and different in comparison to the global research studies. In this case, we not only study the concerned market factors & trends prevailing in a particular country (from secondary research) but we also tend to calculate the actual market size & forecast from the revenue generated from the market participants involved in manufacturing or distributing the any concerned product. These companies can also be service providers. For analyzing any country specifically, we do consider the growth factors prevailing under the states/cities/county for the same. For instance, if we are analyzing an industry specific to United States, we primarily need to study about the states present under the same(where the product/service has the highest growth). Similar analysis will be followed by other countries. Our scope of the report changes with different markets.
Our research study is mainly implement through a mix of both secondary and primary research. Various sources such as industry magazines, trade journals, and government websites and trade associations are reviewed for gathering precise data. Primary interviews are conducted to validate the market size derived from secondary research. Industry experts, major manufacturers and distributors are contacted for further validation purpose on the current market penetration and growth trends.
Prominent participants in our primary research process include:
- Key Opinion Leaders namely the CEOs, CSOs, VPs, purchasing managers, amongst others
- Research and development participants, distributors/suppliers and subject matter experts
Secondary Research includes data extracted from paid data sources:
- Reuters
- Factiva
- Bloomberg
- One Source
- Hoovers
Research Methodology

Key Inclusions


