
Rainfall and Run-off Software Market, by Deployment (Cloud based, On Premises), by Operating System (Windows, Linux, Mac); by End User (Construction, Educational Institutes, Government, Media and Journalism, Oil and Gas, Power, Others);by Organization size ( small and medium Enterprise and Large Enterprise); by Region (United States, Canada, Mexico, France, The UK, Spain, Germany, Italy, Nordic Countries, Benelux Union, Rest of Europe, China, Japan, India, New Zealand, Australia, South Korea, Southeast Asia, Rest of Asia Pacific, Brazil, Argentina, Rest of Latin America, Saudi Arabia, UAE, Egypt, Kuwait, South Africa, Rest of Middle East & Africa) — Global Insights, Growth, Size, Comparative Analysis, Trends and Forecast, 2019–2027
Market Overview/Industry Trends
Run-off refers to the part of the water cycle that flows over land as surface water instead of being absorbed into groundwater or evaporation. The rainfall and run-off denotes the relation between rainfall and displacements of rain-water through the water channels. Modeling run-off helps to understand, control, and monitor the quality and quantity of water resources. This model uses mathematical relationships to define the transfer of moisture. It uses variables, which change with time, and parameters to decide on which solution to implement. The rainfall and run-off software offers prediction and forecasting of water resource planning, flood protection and mitigation of contamination. The software provides simulation produced through analysis of input variables carried out on the basis of hydrology laws. The rainwater is transformed into water-recharge resource by routing through a holding reservoir from which water escapes depending on predetermined characteristics such as storage capacity, initial storage and maximum rate of escape. As soon as the first reservoir gives the indication as overflow, the directed rainwater is routed through a second, non-linear, reservoir with a reaction factor whose value depends on the storage level. Thus, the conversion of rainwater into run-off helps in controlling situation like flooding and drainage choking. Based on this model, many local bodies are reviewing their strategies towards precipitation objectives, which is helping them to manage run-offs associated with flash floods and intense rains. The rainfall and run-off software market is expected to witness lucrative growth over the forecast period owing to its growing adoption by the government agencies to tackle precipitation challenges across various countries. For instances, on 10th February 2020, a general rain advisory was issued by Diego county department of environmental health, urging people to avoid contact to all coastal beaches and bays as the urban run-off contained elevated levels of bacteria from animal waste, decomposing vegetation and soil.
Many organizations, including local bodies, specifically are struggling with the implementation of rainfall and runoff software because of lack of awareness regarding the merits of this software, which is observed across various developing countries. It is challenging to integrate runoff models into practice. The data required for the optimal functioning of the software algorithm is not fulfilled due to the limited availability of technology for data capturing, which is one of the factor that might hinder the rainfall and run-off software market.
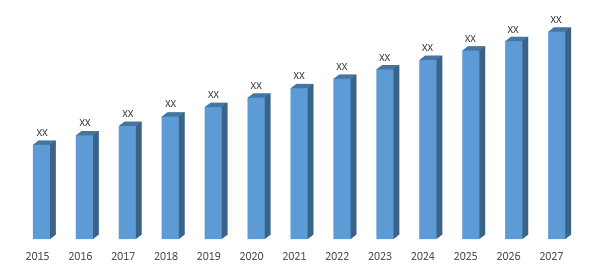
In terms of revenue, the global rainfall and run-off software market was estimated to be US$ 403.1 Mn in 2018 and is expected to reach US$ 671.5 Mn by 2027. The study analyzes the market in terms of revenue across all the major regions, which has been further bifurcated into countries.
Rainfall and Run-Off Software Market Revenue & Forecast, (US$ Million), 2015–2027
Deployment Outlook
The advancement of cloud technology has opened many channels for IT organizations to deploy their solutions. Based on deployment the rainfall and run-off software market can be segmented by cloud and on premise. Cloud-based software is deployed on the software vendor’s infrastructure, while on premise solutions are installed on the user’s local system. The on-premise segment accounted for 64.7% of the total rainfall and run-off software market share in 2018.However, cloud segment is expected to witness lucrative growth over the forecast period growing at a CAGR of 6.9% owing to flexible and cost effective support provided by these solutions. For instance, Water Resource Associates LLP, an American hydrological firm, offers a cloud based rainfall and run-off software to analyze precipitation behavior based on the provided data, thus various organizations across the globe are providing cloud based solutions.
Operating System Outlook
Based on the operating system, the rainfall and run-off software market can be segmented by windows, Linux and Mac. In 2018, window segment accounted for the maximum share under the operating system category. The larger share of this segment is attributed to universal acceptance of windows operating system across all domains. Following up windows, Linux accounted for the second highest share in the 2018 owing to the incorporation of Linux operating system with major applications utilized for various operation by representative bodies. For instances, Aquatic Informatics Inc., offers water data management software for both windows and Linux operating system.
End Users Outlook
Based on end users the rainfall and run-off software market can by segmented by construction, educational institutes, government, media and journalism, oil and gas and power. In 2018, the government segment accounted for the maximum share of 34.3% and is likely to grow at a CAGR of 6.4% over the forecast period (2019 – 2027). The highest market share of this segment is attributed to its optimal use by government to prevent natural disasters. Government in developing countries are increasing the investment on disaster management that includes mainly weather forecasting and flood simulation to reduce the scale of destruction in terms of human lives and infrastructure during calamities. For instance, Indian government has approved USD 39 Million for modernization and anticipation of flood forecasting and also setup three days’ advisory forecast at some of the locations using rainfall-runoff modeling, which is aiding for the growth of the rainfall and run-off software market.
Organization Size Outlook
Based on the organization size, the rainfall and run-off software market can be segmented by small and medium enterprises and large enterprises. The large enterprise segment accounted for 66.1% of the total market share in 2018. The highest market of this segment is attributed to the growing adoption by the local authorities to formulate their drainage trajectory. Modeling with run-off gives the opportunity of predicting the hydrology of the catchment area, flood forecasting as well as simulating discharge and water table height in subsurface drainage systems.
Regional Outlook
North America has been at the forefront in adopting technologies across various industry verticals ranging from construction, educational institutes, government, media and journalism, oil and gas amongst others. The civic authorities in the region are utilizing the run-off model to plan, analyze and design measures related to storm water runoff, combined and sanitary sewers, and other drainage systems. For instance, the Environmental Protection Agency of United States, developed Storm Water Management Model (SWMM), that helps to evaluate gray infrastructure storm water control strategies, such as pipes and storm drains, and is a useful tool for creating cost-effective green/gray hybrid storm water control solutions. Moreover, the presence of major market participants in the U.S., and Canada is also playing a major role in propelling the growth of rainfall and run-off software market in this region.
Competitive Landscape
The report provides both qualitative and quantitative research of rainfall and run-off software market as well as provides comprehensive insights and development methods adopted by the prominent market players. Some of the key market participants in the rainfall and run-off software market are Aquatic Informatics Inc., Bentley System Incorporated, FLO-2D Software, INC, HydroCAD Software Solutions LLC, Innovyze, J.F. Sabourin and Associates Inc., KISTERS AG, Rehm Software GmbH, SoilVision Systems Ltd., Vieux & Associates INC, Water Resource Associates LLP. Major market players are offering their solution with new technologies and integrated point of sales solutions to the construction, educational institutes, government, oil and gas etc. These players have launched customized rainfall software for its clients and are also partnering with major providers of water management systems vendors to enhance the integration of its products with other systems. For each company, the report studies their global presence, competitors, and product offerings, among others.

Rainfall and Run-off Software Market:
- By Deployment
- Cloud
- On Premises
- By Operating System
- Windows
- Linux
- Mac
- By End Users
- Construction
- Educational Institutes
- Government
- Media and Journalism
- Oil and Gas
- Power
- Others
- By Organization Size
- Small and Medium Enterprises
- Large Enterprises
- By Geography
- North America
- United States
- Canada
- Mexico
- Europe
- France
- The UK
- Spain
- Germany
- Italy
- Nordic Countries
- Denmark
- Finland
- Iceland
- Sweden
- Norway
- Benelux Union
- Belgium
- The Netherlands
- Luxembourg
- Rest of Europe
- Asia Pacific
- China
- Japan
- India
- New Zealand
- Australia
- South Korea
- Southeast Asia
- Indonesia
- Thailand
- Malaysia
- Singapore
- Rest of Southeast Asia
- Rest of Asia Pacific
- Latin America
- Brazil
- Argentina
- Rest of Latin America
- Middle East and Africa
- Saudi Arabia
- UAE
- Egypt
- Kuwait
- South Africa
- Rest of Middle East & Africa
- North America
Table of Contents
![]()
1. Market
Scope
1.1. Market
Segmentation
1.2. Years
Considered
1.2.1. Historic
Years: 2013 - 2017
1.2.2. Base
Year: 2018
1.2.3. Forecast
Years: 2019 – 2027
2. Key Target
Audiences
3. Research
Methodology
3.1. Primary
Research
3.1.1. Research
Questionnaire
3.1.2. Global
Percentage Breakdown
3.1.3. Primary
Interviews: Key Opinion Leaders (KOLs)
3.2. Secondary
Research
3.2.1. Paid
Databases
3.2.2. Secondary
Sources
3.3. Market
Size Estimates
3.3.1. Top-Down
Approach
3.3.2. Bottom-Up
Approach
3.4. Data
Triangulation Methodology
3.5. Research
Assumptions
4. Recommendations
and Insights from AMI’s Perspective**
5. Holistic
Overview of Rainfall and Run-off Software Market
6. Market
Synopsis: Rainfall and Run-off Software
Market
7. Rainfall
and Run-off Software Market Analysis: Qualitative Perspective
7.1. Introduction
7.1.1. Product
Definition
7.1.2. Industry
Development
7.2. Market Dynamics
7.2.1. Drivers
7.2.2. Restraints
7.2.3. Opportunities
7.3. Trends in
Rainfall and Run-off Software Market
7.4. Market
Determinants Radar Chart
7.5. Macro-Economic
and Micro-Economic Indicators: Rainfall and Run-off Software Market
7.6. Porter’s
Five Force Analysis
8. Global
Rainfall and Run-off Software Market Analysis and Forecasts, 2019 – 2027
8.1. Overview
8.1.1. Global
Rainfall and Run-off Software Market Revenue (US$ Mn)
8.2. Global
Rainfall and Run-off Software Market Revenue (US$ Mn) and Forecasts, By
Deployment
8.2.1. Cloud
Based
8.2.1.1. Definition
8.2.1.2. Market
Estimation and Penetration, 2013 – 2018
8.2.1.3. Market
Forecast, 2019 – 2027
8.2.1.4. Compound
Annual Growth Rate (CAGR)
8.2.1.5. Regional
Bifurcation
8.2.1.5.1. North
America
8.2.1.5.1.1. Market
Estimation, 2013 – 2018
8.2.1.5.1.2. Market
Forecast, 2019 – 2027
8.2.1.5.2. Europe
8.2.1.5.2.1. Market
Estimation, 2013 – 2018
8.2.1.5.2.2. Market
Forecast, 2019 – 2027
8.2.1.5.3. Asia
Pacific
8.2.1.5.3.1. Market
Estimation, 2013 – 2018
8.2.1.5.3.2. Market
Forecast, 2019 – 2027
8.2.1.5.4. Middle
East and Africa
8.2.1.5.4.1. Market
Estimation, 2013 – 2018
8.2.1.5.4.2. Market
Forecast, 2019 – 2027
8.2.1.5.5. Latin
America
8.2.1.5.5.1. Market
Estimation, 2013 – 2018
8.2.1.5.5.2. Market
Forecast, 2019 – 2027
8.2.2. On
Premises
8.2.2.1. Definition
8.2.2.2. Market
Estimation and Penetration, 2013 – 2018
8.2.2.3. Market
Forecast, 2019 – 2027
8.2.2.4. Compound
Annual Growth Rate (CAGR)
8.2.2.5. Regional
Bifurcation
8.2.2.5.1. North
America
8.2.2.5.1.1. Market
Estimation, 2013 – 2018
8.2.2.5.1.2. Market
Forecast, 2019 – 2027
8.2.2.5.2. Europe
8.2.2.5.2.1. Market
Estimation, 2013 – 2018
8.2.2.5.2.2. Market
Forecast, 2019 – 2027
8.2.2.5.3. Asia
Pacific
8.2.2.5.3.1. Market
Estimation, 2013 – 2018
8.2.2.5.3.2. Market
Forecast, 2019 – 2027
8.2.2.5.4. Middle
East and Africa
8.2.2.5.4.1. Market
Estimation, 2013 – 2018
8.2.2.5.4.2. Market
Forecast, 2019 – 2027
8.2.2.5.5. Latin
America
8.2.2.5.5.1. Market
Estimation, 2013 – 2018
8.2.2.5.5.2. Market
Forecast, 2019 – 2027
8.3. Key
Segment for Channeling Investments
8.3.1. By
Deployment
9. Global
Rainfall and Run-off Software Market Analysis and Forecasts, 2019 – 2027
9.1. Overview
9.2. Global
Rainfall and Run-off Software Market Revenue (US$ Mn) and Forecasts, By
Operating System
9.2.1. Windows
9.2.1.1. Definition
9.2.1.2. Market
Estimation and Penetration, 2013 – 2018
9.2.1.3. Market
Forecast, 2019 – 2027
9.2.1.4. Compound
Annual Growth Rate (CAGR)
9.2.1.5. Regional
Bifurcation
9.2.1.5.1. North
America
9.2.1.5.1.1. Market
Estimation, 2013 – 2018
9.2.1.5.1.2. Market
Forecast, 2019 – 2027
9.2.1.5.2. Europe
9.2.1.5.2.1. Market
Estimation, 2013 – 2018
9.2.1.5.2.2. Market
Forecast, 2019 – 2027
9.2.1.5.3. Asia
Pacific
9.2.1.5.3.1. Market
Estimation, 2013 – 2018
9.2.1.5.3.2. Market
Forecast, 2019 – 2027
9.2.1.5.4. Middle
East and Africa
9.2.1.5.4.1. Market
Estimation, 2013 – 2018
9.2.1.5.4.2. Market
Forecast, 2019 – 2027
9.2.1.5.5. Latin
America
9.2.1.5.5.1. Market
Estimation, 2013 – 2018
9.2.1.5.5.2. Market
Forecast, 2019 – 2027
9.2.2. Linux
9.2.2.1. Definition
9.2.2.2. Market
Estimation and Penetration, 2013 – 2018
9.2.2.3. Market
Forecast, 2019 – 2027
9.2.2.4. Compound
Annual Growth Rate (CAGR)
9.2.2.5. Regional
Bifurcation
9.2.2.5.1. North
America
9.2.2.5.1.1. Market
Estimation, 2013 – 2018
9.2.2.5.1.2. Market
Forecast, 2019 – 2027
9.2.2.5.2. Europe
9.2.2.5.2.1. Market
Estimation, 2013 – 2018
9.2.2.5.2.2. Market
Forecast, 2019 – 2027
9.2.2.5.3. Asia
Pacific
9.2.2.5.3.1. Market
Estimation, 2013 – 2018
9.2.2.5.3.2. Market
Forecast, 2019 – 2027
9.2.2.5.4. Middle
East and Africa
9.2.2.5.4.1. Market
Estimation, 2013 – 2018
9.2.2.5.4.2. Market
Forecast, 2019 – 2027
9.2.2.5.5. Latin
America
9.2.2.5.5.1. Market
Estimation, 2013 – 2018
9.2.2.5.5.2. Market
Forecast, 2019 – 2027
9.2.3. Mac
9.2.3.1. Definition
9.2.3.2. Market
Estimation and Penetration, 2013 – 2018
9.2.3.3. Market
Forecast, 2019 – 2027
9.2.3.4. Compound
Annual Growth Rate (CAGR)
9.2.3.5. Regional
Bifurcation
9.2.3.5.1. North
America
9.2.3.5.1.1. Market
Estimation, 2013 – 2018
9.2.3.5.1.2. Market
Forecast, 2019 – 2027
9.2.3.5.2. Europe
9.2.3.5.2.1. Market
Estimation, 2013 – 2018
9.2.3.5.2.2. Market
Forecast, 2019 – 2027
9.2.3.5.3. Asia
Pacific
9.2.3.5.3.1. Market
Estimation, 2013 – 2018
9.2.3.5.3.2. Market
Forecast, 2019 – 2027
9.2.3.5.4. Middle
East and Africa
9.2.3.5.4.1. Market
Estimation, 2013 – 2018
9.2.3.5.4.2. Market
Forecast, 2019 – 2027
9.2.3.5.5. Latin
America
9.2.3.5.5.1. Market
Estimation, 2013 – 2018
9.2.3.5.5.2. Market
Forecast, 2019 – 2027
9.3. Key
Segment for Channeling Investments
9.3.1. By
Operating System
10. Global
Rainfall and Run-off Software Market Analysis and Forecasts, 2019 – 2027
10.1. Overview
10.2. Global
Rainfall and Run-off Software Market Revenue (US$ Mn) and Forecasts, By End
Users
10.2.1. Construction
10.2.1.1. Definition
10.2.1.2. Market
Estimation and Penetration, 2013 – 2018
10.2.1.3. Market
Forecast, 2019 – 2027
10.2.1.4. Compound
Annual Growth Rate (CAGR)
10.2.1.5. Regional
Bifurcation
10.2.1.5.1. North
America
10.2.1.5.1.1. Market
Estimation, 2013 – 2018
10.2.1.5.1.2. Market
Forecast, 2019 – 2027
10.2.1.5.2. Europe
10.2.1.5.2.1. Market
Estimation, 2013 – 2018
10.2.1.5.2.2. Market
Forecast, 2019 – 2027
10.2.1.5.3. Asia
Pacific
10.2.1.5.3.1. Market
Estimation, 2013 – 2018
10.2.1.5.3.2. Market
Forecast, 2019 – 2027
10.2.1.5.4. Middle
East and Africa
10.2.1.5.4.1. Market
Estimation, 2013 – 2018
10.2.1.5.4.2. Market
Forecast, 2019 – 2027
10.2.1.5.5. Latin
America
10.2.1.5.5.1. Market
Estimation, 2013 – 2018
10.2.1.5.5.2. Market
Forecast, 2019 – 2027
10.2.2. Educational
Institutes
10.2.2.1. Definition
10.2.2.2. Market
Estimation and Penetration, 2013 – 2018
10.2.2.3. Market
Forecast, 2019 – 2027
10.2.2.4. Compound
Annual Growth Rate (CAGR)
10.2.2.5. Regional
Bifurcation
10.2.2.5.1. North
America
10.2.2.5.1.1. Market
Estimation, 2013 – 2018
10.2.2.5.1.2. Market
Forecast, 2019 – 2027
10.2.2.5.2. Europe
10.2.2.5.2.1. Market
Estimation, 2013 – 2018
10.2.2.5.2.2. Market
Forecast, 2019 – 2027
10.2.2.5.3. Asia
Pacific
10.2.2.5.3.1. Market
Estimation, 2013 – 2018
10.2.2.5.3.2. Market
Forecast, 2019 – 2027
10.2.2.5.4. Middle
East and Africa
10.2.2.5.4.1. Market
Estimation, 2013 – 2018
10.2.2.5.4.2. Market
Forecast, 2019 – 2027
10.2.2.5.5. Latin
America
10.2.2.5.5.1. Market
Estimation, 2013 – 2018
10.2.2.5.5.2. Market
Forecast, 2019 – 2027
10.2.3. Government
10.2.3.1. Definition
10.2.3.2. Market
Estimation and Penetration, 2013 – 2018
10.2.3.3. Market
Forecast, 2019 – 2027
10.2.3.4. Compound
Annual Growth Rate (CAGR)
10.2.3.5. Regional
Bifurcation
10.2.3.5.1. North
America
10.2.3.5.1.1. Market
Estimation, 2013 – 2018
10.2.3.5.1.2. Market
Forecast, 2019 – 2027
10.2.3.5.2. Europe
10.2.3.5.2.1. Market
Estimation, 2013 – 2018
10.2.3.5.2.2. Market
Forecast, 2019 – 2027
10.2.3.5.3. Asia
Pacific
10.2.3.5.3.1. Market
Estimation, 2013 – 2018
10.2.3.5.3.2. Market
Forecast, 2019 – 2027
10.2.3.5.4. Middle
East and Africa
10.2.3.5.4.1. Market
Estimation, 2013 – 2018
10.2.3.5.4.2. Market
Forecast, 2019 – 2027
10.2.3.5.5. Latin
America
10.2.3.5.5.1. Market
Estimation, 2013 – 2018
10.2.3.5.5.2. Market
Forecast, 2019 – 2027
10.2.4. Media
and Journalism
10.2.4.1. Definition
10.2.4.2. Market
Estimation and Penetration, 2013 – 2018
10.2.4.3. Market
Forecast, 2019 – 2027
10.2.4.4. Compound
Annual Growth Rate (CAGR)
10.2.4.5. Regional
Bifurcation
10.2.4.5.1. North
America
10.2.4.5.1.1. Market
Estimation, 2013 – 2018
10.2.4.5.1.2. Market
Forecast, 2019 – 2027
10.2.4.5.2. Europe
10.2.4.5.2.1. Market
Estimation, 2013 – 2018
10.2.4.5.2.2. Market
Forecast, 2019 – 2027
10.2.4.5.3. Asia
Pacific
10.2.4.5.3.1. Market
Estimation, 2013 – 2018
10.2.4.5.3.2. Market
Forecast, 2019 – 2027
10.2.4.5.4. Middle
East and Africa
10.2.4.5.4.1. Market
Estimation, 2013 – 2018
10.2.4.5.4.2. Market
Forecast, 2019 – 2027
10.2.4.5.5. Latin
America
10.2.4.5.5.1. Market
Estimation, 2013 – 2018
10.2.4.5.5.2. Market
Forecast, 2019 – 2027
10.2.5. Oil and
Gas
10.2.5.1. Definition
10.2.5.2. Market
Estimation and Penetration, 2013 – 2018
10.2.5.3. Market
Forecast, 2019 – 2027
10.2.5.4. Compound
Annual Growth Rate (CAGR)
10.2.5.5. Regional
Bifurcation
10.2.5.5.1. North
America
10.2.5.5.1.1. Market
Estimation, 2013 – 2018
10.2.5.5.1.2. Market
Forecast, 2019 – 2027
10.2.5.5.2. Europe
10.2.5.5.2.1. Market
Estimation, 2013 – 2018
10.2.5.5.2.2. Market
Forecast, 2019 – 2027
10.2.5.5.3. Asia
Pacific
10.2.5.5.3.1. Market
Estimation, 2013 – 2018
10.2.5.5.3.2. Market
Forecast, 2019 – 2027
10.2.5.5.4. Middle
East and Africa
10.2.5.5.4.1. Market
Estimation, 2013 – 2018
10.2.5.5.4.2. Market
Forecast, 2019 – 2027
10.2.5.5.5. Latin
America
10.2.5.5.5.1. Market
Estimation, 2013 – 2018
10.2.5.5.5.2. Market
Forecast, 2019 – 2027
10.2.6. Power
10.2.6.1. Definition
10.2.6.2. Market
Estimation and Penetration, 2013 – 2018
10.2.6.3. Market
Forecast, 2019 – 2027
10.2.6.4. Compound
Annual Growth Rate (CAGR)
10.2.6.5. Regional
Bifurcation
10.2.6.5.1. North
America
10.2.6.5.1.1. Market
Estimation, 2013 – 2018
10.2.6.5.1.2. Market
Forecast, 2019 – 2027
10.2.6.5.2. Europe
10.2.6.5.2.1. Market
Estimation, 2013 – 2018
10.2.6.5.2.2. Market
Forecast, 2019 – 2027
10.2.6.5.3. Asia
Pacific
10.2.6.5.3.1. Market
Estimation, 2013 – 2018
10.2.6.5.3.2. Market
Forecast, 2019 – 2027
10.2.6.5.4. Middle
East and Africa
10.2.6.5.4.1. Market
Estimation, 2013 – 2018
10.2.6.5.4.2. Market
Forecast, 2019 – 2027
10.2.6.5.5. Latin
America
10.2.6.5.5.1. Market
Estimation, 2013 – 2018
10.2.6.5.5.2. Market
Forecast, 2019 – 2027
10.2.7. Others
10.2.7.1. Definition
10.2.7.2. Market
Estimation and Penetration, 2013 – 2018
10.2.7.3. Market
Forecast, 2019 – 2027
10.2.7.4. Compound
Annual Growth Rate (CAGR)
10.2.7.5. Regional
Bifurcation
10.2.7.5.1. North
America
10.2.7.5.1.1. Market
Estimation, 2013 – 2018
10.2.7.5.1.2. Market
Forecast, 2019 – 2027
10.2.7.5.2. Europe
10.2.7.5.2.1. Market
Estimation, 2013 – 2018
10.2.7.5.2.2. Market
Forecast, 2019 – 2027
10.2.7.5.3. Asia
Pacific
10.2.7.5.3.1. Market
Estimation, 2013 – 2018
10.2.7.5.3.2. Market
Forecast, 2019 – 2027
10.2.7.5.4. Middle
East and Africa
10.2.7.5.4.1. Market
Estimation, 2013 – 2018
10.2.7.5.4.2. Market
Forecast, 2019 – 2027
10.2.7.5.5. Latin
America
10.2.7.5.5.1. Market
Estimation, 2013 – 2018
10.2.7.5.5.2. Market
Forecast, 2019 – 2027
10.3. Key
Segment for Channeling Investments
10.3.1. By End
Users
11. Global
Rainfall and Run-off Software Market Analysis and Forecasts, 2019 – 2027
11.1. Overview
11.2. Global
Rainfall and Run-off Software Market Revenue (US$ Mn) and Forecasts, By
Organization Size
11.2.1. Small
and Medium Enterprises
11.2.1.1. Definition
11.2.1.2. Market
Estimation and Penetration, 2013 – 2018
11.2.1.3. Market
Forecast, 2019 – 2027
11.2.1.4. Compound
Annual Growth Rate (CAGR)
11.2.1.5. Regional
Bifurcation
11.2.1.5.1. North
America
11.2.1.5.1.1. Market
Estimation, 2013 – 2018
11.2.1.5.1.2. Market
Forecast, 2019 – 2027
11.2.1.5.2. Europe
11.2.1.5.2.1. Market
Estimation, 2013 – 2018
11.2.1.5.2.2. Market
Forecast, 2019 – 2027
11.2.1.5.3. Asia
Pacific
11.2.1.5.3.1. Market
Estimation, 2013 – 2018
11.2.1.5.3.2. Market
Forecast, 2019 – 2027
11.2.1.5.4. Middle
East and Africa
11.2.1.5.4.1. Market
Estimation, 2013 – 2018
11.2.1.5.4.2. Market
Forecast, 2019 – 2027
11.2.1.5.5. Latin
America
11.2.1.5.5.1. Market
Estimation, 2013 – 2018
11.2.1.5.5.2. Market
Forecast, 2019 – 2027
11.2.2. Large
Enterprises
11.2.2.1. Definition
11.2.2.2. Market
Estimation and Penetration, 2013 – 2018
11.2.2.3. Market
Forecast, 2019 – 2027
11.2.2.4. Compound
Annual Growth Rate (CAGR)
11.2.2.5. Regional
Bifurcation
11.2.2.5.1. North
America
11.2.2.5.1.1. Market
Estimation, 2013 – 2018
11.2.2.5.1.2. Market
Forecast, 2019 – 2027
11.2.2.5.2. Europe
11.2.2.5.2.1. Market
Estimation, 2013 – 2018
11.2.2.5.2.2. Market
Forecast, 2019 – 2027
11.2.2.5.3. Asia
Pacific
11.2.2.5.3.1. Market
Estimation, 2013 – 2018
11.2.2.5.3.2. Market
Forecast, 2019 – 2027
11.2.2.5.4. Middle
East and Africa
11.2.2.5.4.1. Market
Estimation, 2013 – 2018
11.2.2.5.4.2. Market
Forecast, 2019 – 2027
11.2.2.5.5. Latin
America
11.2.2.5.5.1. Market
Estimation, 2013 – 2018
11.2.2.5.5.2. Market
Forecast, 2019 – 2027
11.3. Key
Segment for Channeling Investments
11.3.1. By
Organization Size
12. North
America Rainfall and Run-off Software Market Analysis and Forecasts, 2019 -
2027
12.1. Overview
12.1.1. North
America Rainfall and Run-off Software Market Revenue (US$ Mn)
12.2. North
America Rainfall and Run-off Software Market Revenue (US$ Mn) and Forecasts, By
Deployment
12.2.1. Cloud
Based
12.2.2. On
Premises
12.3. North
America Rainfall and Run-off Software Market Revenue (US$ Mn) and Forecasts, By
Operating System
12.3.1. Windows
12.3.2. Linux
12.3.3. Mac
12.4. North
America Rainfall and Run-off Software Market Revenue (US$ Mn) and Forecasts, By
End Users
12.4.1. Construction
12.4.2. Educational
Institutes
12.4.3. Government
12.4.4. Media
and Journalism
12.4.5. Oil and
Gas
12.4.6. Power
12.4.7. Others
12.5. North
America Rainfall and Run-off Software Market Revenue (US$ Mn) and Forecasts, By
Organization Size
12.5.1. Small
and Medium Enterprises
12.5.2. Large
Enterprises
12.6. North
America Rainfall and Run-off Software Market Revenue (US$ Mn) and Forecasts, By
Country
12.6.1. U.S
12.6.1.1. U.S
Rainfall and Run-off Software Market Revenue (US$ Mn) and Forecasts, By
Deployment
12.6.1.1.1. Cloud
Based
12.6.1.1.2. On
Premises
12.6.1.2. U.S
Rainfall and Run-off Software Market Revenue (US$ Mn) and Forecasts, By
Operating System
12.6.1.2.1. Windows
12.6.1.2.2. Linux
12.6.1.2.3. Mac
12.6.1.3. U.S
Rainfall and Run-off Software Market Revenue (US$ Mn) and Forecasts, By End
Users
12.6.1.3.1. Construction
12.6.1.3.2. Educational
Institutes
12.6.1.3.3. Government
12.6.1.3.4. Media
and Journalism
12.6.1.3.5. Oil
and Gas
12.6.1.3.6. Power
12.6.1.3.7. Others
12.6.1.4. U.S
Rainfall and Run-off Software Market Revenue (US$ Mn) and Forecasts, By
Organization Size
12.6.1.4.1. Small
and Medium Enterprises
12.6.1.4.2. Large
Enterprises
12.6.2. Canada
12.6.2.1. Canada
Rainfall and Run-off Software Market Revenue (US$ Mn) and Forecasts, By
Deployment
12.6.2.1.1. Cloud
Based
12.6.2.1.2. On
Premises
12.6.2.2. Canada
Rainfall and Run-off Software Market Revenue (US$ Mn) and Forecasts, By
Operating System
12.6.2.2.1. Windows
12.6.2.2.2. Linux
12.6.2.2.3. Mac
12.6.2.3. Canada
Rainfall and Run-off Software Market Revenue (US$ Mn) and Forecasts, By End
Users
12.6.2.3.1. Construction
12.6.2.3.2. Educational
Institutes
12.6.2.3.3. Government
12.6.2.3.4. Media
and Journalism
12.6.2.3.5. Oil
and Gas
12.6.2.3.6. Power
12.6.2.3.7. Others
12.6.2.4. Canada
Rainfall and Run-off Software Market Revenue (US$ Mn) and Forecasts, By
Organization Size
12.6.2.4.1. Small
and Medium Enterprises
12.6.2.4.2. Large
Enterprises
12.6.3. Mexico
12.6.3.1. Mexico
Rainfall and Run-off Software Market Revenue (US$ Mn) and Forecasts, By
Deployment
12.6.3.1.1. Cloud
Based
12.6.3.1.2. On
Premises
12.6.3.2. Mexico
Rainfall and Run-off Software Market Revenue (US$ Mn) and Forecasts, By
Operating System
12.6.3.2.1. Windows
12.6.3.2.2. Linux
12.6.3.2.3. Mac
12.6.3.3. Mexico
Rainfall and Run-off Software Market Revenue (US$ Mn) and Forecasts, By End
Users
12.6.3.3.1. Construction
12.6.3.3.2. Educational
Institutes
12.6.3.3.3. Government
12.6.3.3.4. Media
and Journalism
12.6.3.3.5. Oil
and Gas
12.6.3.3.6. Power
12.6.3.3.7. Others
12.6.3.4. Mexico
Rainfall and Run-off Software Market Revenue (US$ Mn) and Forecasts, By
Organization Size
12.6.3.4.1. Small
and Medium Enterprises
12.6.3.4.2. Large
Enterprises
12.6.4. Rest of
North America
12.6.4.1. Rest
of North America Rainfall and Run-off Software Market Revenue (US$ Mn) and
Forecasts, By Deployment
12.6.4.1.1. Cloud
Based
12.6.4.1.2. On
Premises
12.6.4.2. Rest
of North America Rainfall and Run-off Software Market Revenue (US$ Mn) and
Forecasts, By Operating System
12.6.4.2.1. Windows
12.6.4.2.2. Linux
12.6.4.2.3. Mac
12.6.4.3. Rest
of North America Rainfall and Run-off Software Market Revenue (US$ Mn) and
Forecasts, By End Users
12.6.4.3.1. Construction
12.6.4.3.2. Educational
Institutes
12.6.4.3.3. Government
12.6.4.3.4. Media
and Journalism
12.6.4.3.5. Oil
and Gas
12.6.4.3.6. Power
12.6.4.3.7. Others
12.6.4.4. Rest
of North America Rainfall and Run-off Software Market Revenue (US$ Mn) and
Forecasts, By Organization Size
12.6.4.4.1. Small
and Medium Enterprises
12.6.4.4.2. Large
Enterprises
12.7. Key
Segment for Channeling Investments
12.7.1. By
Country
12.7.2. By
Deployment
12.7.3. By
Operating System
12.7.4. By End
Users
12.7.5. By
Organization Size
13. Europe
Rainfall and Run-off Software Market Analysis and Forecasts, 2019 - 2027
13.1. Overview
13.1.1. Europe
Rainfall and Run-off Software Market Revenue (US$ Mn)
13.2. Europe
Rainfall and Run-off Software Market Revenue (US$ Mn) and Forecasts, By
Deployment
13.2.1. Cloud
Based
13.2.2. On
Premises
13.3. Europe
Rainfall and Run-off Software Market Revenue (US$ Mn) and Forecasts, By
Operating System
13.3.1. Windows
13.3.2. Linux
13.3.3. Mac
13.4. Europe
Rainfall and Run-off Software Market Revenue (US$ Mn) and Forecasts, By End
Users
13.4.1. Construction
13.4.2. Educational
Institutes
13.4.3. Government
13.4.4. Media
and Journalism
13.4.5. Oil and
Gas
13.4.6. Power
13.4.7. Others
13.5. Europe Rainfall
and Run-off Software Market Revenue (US$ Mn) and Forecasts, By Organization
Size
13.5.1. Small
and Medium Enterprises
13.5.2. Large
Enterprises
13.6. Europe
Rainfall and Run-off Software Market Revenue (US$ Mn) and Forecasts, By Country
13.6.1. France
13.6.1.1. France
Rainfall and Run-off Software Market Revenue (US$ Mn) and Forecasts, By
Deployment
13.6.1.1.1. Cloud
Based
13.6.1.1.2. On
Premises
13.6.1.2. France
Rainfall and Run-off Software Market Revenue (US$ Mn) and Forecasts, By
Operating System
13.6.1.2.1. Windows
13.6.1.2.2. Linux
13.6.1.2.3. Mac
13.6.1.3. France
Rainfall and Run-off Software Market Revenue (US$ Mn) and Forecasts, By End
Users
13.6.1.3.1. Construction
13.6.1.3.2. Educational
Institutes
13.6.1.3.3. Government
13.6.1.3.4. Media
and Journalism
13.6.1.3.5. Oil
and Gas
13.6.1.3.6. Power
13.6.1.3.7. Others
13.6.1.4. France
Rainfall and Run-off Software Market Revenue (US$ Mn) and Forecasts, By
Organization Size
13.6.1.4.1. Small
and Medium Enterprises
13.6.1.4.2. Large
Enterprises
13.6.2. The UK
13.6.2.1. The
UK Rainfall and Run-off Software Market Revenue (US$ Mn) and Forecasts, By
Deployment
13.6.2.1.1. Cloud
Based
13.6.2.1.2. On
Premises
13.6.2.2. The
UK Rainfall and Run-off Software Market Revenue (US$ Mn) and Forecasts, By
Operating System
13.6.2.2.1. Windows
13.6.2.2.2. Linux
13.6.2.2.3. Mac
13.6.2.3. The
UK Rainfall and Run-off Software Market Revenue (US$ Mn) and Forecasts, By End
Users
13.6.2.3.1. Construction
13.6.2.3.2. Educational
Institutes
13.6.2.3.3. Government
13.6.2.3.4. Media
and Journalism
13.6.2.3.5. Oil
and Gas
13.6.2.3.6. Power
13.6.2.3.7. Others
13.6.2.4. The
UK Rainfall and Run-off Software Market Revenue (US$ Mn) and Forecasts, By
Organization Size
13.6.2.4.1. Small
and Medium Enterprises
13.6.2.4.2. Large
Enterprises
13.6.3. Spain
13.6.3.1. Spain
Rainfall and Run-off Software Market Revenue (US$ Mn) and Forecasts, By
Deployment
13.6.3.1.1. Cloud
Based
13.6.3.1.2. On
Premises
13.6.3.2. Spain
Rainfall and Run-off Software Market Revenue (US$ Mn) and Forecasts, By
Operating System
13.6.3.2.1. Windows
13.6.3.2.2. Linux
13.6.3.2.3. Mac
13.6.3.3. Spain
Rainfall and Run-off Software Market Revenue (US$ Mn) and Forecasts, By End
Users
13.6.3.3.1. Construction
13.6.3.3.2. Educational
Institutes
13.6.3.3.3. Government
13.6.3.3.4. Media
and Journalism
13.6.3.3.5. Oil
and Gas
13.6.3.3.6. Power
13.6.3.3.7. Others
13.6.3.4. Spain
Rainfall and Run-off Software Market Revenue (US$ Mn) and Forecasts, By
Organization Size
13.6.3.4.1. Small
and Medium Enterprises
13.6.3.4.2. Large
Enterprises
13.6.4. Germany
13.6.4.1. Germany
Rainfall and Run-off Software Market Revenue (US$ Mn) and Forecasts, By
Deployment
13.6.4.1.1. Cloud
Based
13.6.4.1.2. On
Premises
13.6.4.2. Germany
Rainfall and Run-off Software Market Revenue (US$ Mn) and Forecasts, By
Operating System
13.6.4.2.1. Windows
13.6.4.2.2. Linux
13.6.4.2.3. Mac
13.6.4.3. Germany
Rainfall and Run-off Software Market Revenue (US$ Mn) and Forecasts, By End
Users
13.6.4.3.1. Construction
13.6.4.3.2. Educational
Institutes
13.6.4.3.3. Government
13.6.4.3.4. Media
and Journalism
13.6.4.3.5. Oil
and Gas
13.6.4.3.6. Power
13.6.4.3.7. Others
13.6.4.4. Germany
Rainfall and Run-off Software Market Revenue (US$ Mn) and Forecasts, By
Organization Size
13.6.4.4.1. Small
and Medium Enterprises
13.6.4.4.2. Large
Enterprises
13.6.5. Italy
13.6.5.1. Italy
Rainfall and Run-off Software Market Revenue (US$ Mn) and Forecasts, By Deployment
13.6.5.1.1. Cloud
Based
13.6.5.1.2. On
Premises
13.6.5.2. Italy
Rainfall and Run-off Software Market Revenue (US$ Mn) and Forecasts, By
Operating System
13.6.5.2.1. Windows
13.6.5.2.2. Linux
13.6.5.2.3. Mac
13.6.5.3. Italy
Rainfall and Run-off Software Market Revenue (US$ Mn) and Forecasts, By End
Users
13.6.5.3.1. Construction
13.6.5.3.2. Educational
Institutes
13.6.5.3.3. Government
13.6.5.3.4. Media
and Journalism
13.6.5.3.5. Oil
and Gas
13.6.5.3.6. Power
13.6.5.3.7. Others
13.6.5.4. Italy
Rainfall and Run-off Software Market Revenue (US$ Mn) and Forecasts, By
Organization Size
13.6.5.4.1. Small
and Medium Enterprises
13.6.5.4.2. Large
Enterprises
13.6.6. Nordic
Countries
13.6.6.1. Nordic
Countries Rainfall and Run-off Software Market Revenue (US$ Mn) and Forecasts,
By Deployment
13.6.6.1.1. Cloud
Based
13.6.6.1.2. On
Premises
13.6.6.2. Nordic
Countries Rainfall and Run-off Software Market Revenue (US$ Mn) and Forecasts,
By Operating System
13.6.6.2.1. Windows
13.6.6.2.2. Linux
13.6.6.2.3. Mac
13.6.6.3. Nordic
Countries Rainfall and Run-off Software Market Revenue (US$ Mn) and Forecasts,
By End Users
13.6.6.3.1. Construction
13.6.6.3.2. Educational
Institutes
13.6.6.3.3. Government
13.6.6.3.4. Media
and Journalism
13.6.6.3.5. Oil
and Gas
13.6.6.3.6. Power
13.6.6.3.7. Others
13.6.6.4. Nordic
Countries Rainfall and Run-off Software Market Revenue (US$ Mn) and Forecasts,
By Organization Size
13.6.6.4.1. Small
and Medium Enterprises
13.6.6.4.2. Large
Enterprises
13.6.6.5. Nordic
Countries Rainfall and Run-off Software Market Revenue (US$ Mn) and Forecasts,
By Country
13.6.6.5.1. Denmark
13.6.6.5.2. Finland
13.6.6.5.3. Iceland
13.6.6.5.4. Sweden
13.6.6.5.5. Norway
13.6.7. Benelux
Union
13.6.7.1. Benelux
Union Rainfall and Run-off Software Market Revenue (US$ Mn) and Forecasts, By
Deployment
13.6.7.1.1. Cloud
Based
13.6.7.1.2. On
Premises
13.6.7.2. Benelux
Union Rainfall and Run-off Software Market Revenue (US$ Mn) and Forecasts, By
Operating System
13.6.7.2.1. Windows
13.6.7.2.2. Linux
13.6.7.2.3. Mac
13.6.7.3. Benelux
Union Rainfall and Run-off Software Market Revenue (US$ Mn) and Forecasts, By
End Users
13.6.7.3.1. Construction
13.6.7.3.2. Educational
Institutes
13.6.7.3.3. Government
13.6.7.3.4. Media
and Journalism
13.6.7.3.5. Oil
and Gas
13.6.7.3.6. Power
13.6.7.3.7. Others
13.6.7.4. Benelux
Union Rainfall and Run-off Software Market Revenue (US$ Mn) and Forecasts, By
Organization Size
13.6.7.4.1. Small
and Medium Enterprises
13.6.7.4.2. Large
Enterprises
13.6.7.5. Benelux
Union Rainfall and Run-off Software Market Revenue (US$ Mn) and Forecasts, By
Country
13.6.7.5.1. Belgium
13.6.7.5.2. The
Netherlands
13.6.7.5.3. Luxembourg
13.6.8. Rest of
Europe
13.6.8.1. Rest
of Europe Rainfall and Run-off Software Market Revenue (US$ Mn) and Forecasts,
By Deployment
13.6.8.1.1. Cloud
Based
13.6.8.1.2. On
Premises
13.6.8.2. Rest
of Europe Rainfall and Run-off Software Market Revenue (US$ Mn) and Forecasts,
By Operating System
13.6.8.2.1. Windows
13.6.8.2.2. Linux
13.6.8.2.3. Mac
13.6.8.3. Rest
of Europe Rainfall and Run-off Software Market Revenue (US$ Mn) and Forecasts,
By End Users
13.6.8.3.1. Construction
13.6.8.3.2. Educational
Institutes
13.6.8.3.3. Government
13.6.8.3.4. Media
and Journalism
13.6.8.3.5. Oil
and Gas
13.6.8.3.6. Power
13.6.8.3.7. Others
13.6.8.4. Rest
of Europe Rainfall and Run-off Software Market Revenue (US$ Mn) and Forecasts,
By Organization Size
13.6.8.4.1. Small
and Medium Enterprises
13.6.8.4.2. Large
Enterprises
13.7. Key
Segment for Channeling Investments
13.7.1. By
Country
13.7.2. By
Deployment
13.7.3. By
Operating System
13.7.4. By End
Users
13.7.5. By
Organization Size
14. Asia
Pacific Rainfall and Run-off Software Market Analysis and Forecasts, 2019 -
2027
14.1. Overview
14.1.1. Asia
Pacific Rainfall and Run-off Software Market Revenue (US$ Mn)
14.2. Asia
Pacific Rainfall and Run-off Software Market Revenue (US$ Mn) and Forecasts, By
Deployment
14.2.1. Cloud
Based
14.2.2. On
Premises
14.3. Asia
Pacific Rainfall and Run-off Software Market Revenue (US$ Mn) and Forecasts, By
Operating System
14.3.1. Windows
14.3.2. Linux
14.3.3. Mac
14.4. Asia
Pacific Rainfall and Run-off Software Market Revenue (US$ Mn) and Forecasts, By
End Users
14.4.1. Construction
14.4.2. Educational
Institutes
14.4.3. Government
14.4.4. Media
and Journalism
14.4.5. Oil and
Gas
14.4.6. Power
14.4.7. Others
14.5. Asia
Pacific Rainfall and Run-off Software Market Revenue (US$ Mn) and Forecasts, By
Organization Size
14.5.1. Small
and Medium Enterprises
14.5.2. Large
Enterprises
14.6. Asia
Pacific Rainfall and Run-off Software Market Revenue (US$ Mn) and Forecasts, By
Country
14.6.1. China
14.6.1.1. China
Rainfall and Run-off Software Market Revenue (US$ Mn) and Forecasts, By
Deployment
14.6.1.1.1. Cloud
Based
14.6.1.1.2. On
Premises
14.6.1.2. China
Rainfall and Run-off Software Market Revenue (US$ Mn) and Forecasts, By
Operating System
14.6.1.2.1. Windows
14.6.1.2.2. Linux
14.6.1.2.3. Mac
14.6.1.3. China
Rainfall and Run-off Software Market Revenue (US$ Mn) and Forecasts, By End
Users
14.6.1.3.1. Construction
14.6.1.3.2. Educational
Institutes
14.6.1.3.3. Government
14.6.1.3.4. Media
and Journalism
14.6.1.3.5. Oil
and Gas
14.6.1.3.6. Power
14.6.1.3.7. Others
14.6.1.4. China
Rainfall and Run-off Software Market Revenue (US$ Mn) and Forecasts, By
Organization Size
14.6.1.4.1. Small
and Medium Enterprises
14.6.1.4.2. Large
Enterprises
14.6.2. Japan
14.6.2.1. Japan
Rainfall and Run-off Software Market Revenue (US$ Mn) and Forecasts, By
Deployment
14.6.2.1.1. Cloud
Based
14.6.2.1.2. On
Premises
14.6.2.2. Japan
Rainfall and Run-off Software Market Revenue (US$ Mn) and Forecasts, By
Operating System
14.6.2.2.1. Windows
14.6.2.2.2. Linux
14.6.2.2.3. Mac
14.6.2.3. Japan
Rainfall and Run-off Software Market Revenue (US$ Mn) and Forecasts, By End
Users
14.6.2.3.1. Construction
14.6.2.3.2. Educational
Institutes
14.6.2.3.3. Government
14.6.2.3.4. Media
and Journalism
14.6.2.3.5. Oil
and Gas
14.6.2.3.6. Power
14.6.2.3.7. Others
14.6.2.4. Japan
Rainfall and Run-off Software Market Revenue (US$ Mn) and Forecasts, By
Organization Size
14.6.2.4.1. Small
and Medium Enterprises
14.6.2.4.2. Large
Enterprises
14.6.3. India
14.6.3.1. India
Rainfall and Run-off Software Market Revenue (US$ Mn) and Forecasts, By
Deployment
14.6.3.1.1. Cloud
Based
14.6.3.1.2. On
Premises
14.6.3.2. India
Rainfall and Run-off Software Market Revenue (US$ Mn) and Forecasts, By
Operating System
14.6.3.2.1. Windows
14.6.3.2.2. Linux
14.6.3.2.3. Mac
14.6.3.3. India
Rainfall and Run-off Software Market Revenue (US$ Mn) and Forecasts, By End
Users
14.6.3.3.1. Construction
14.6.3.3.2. Educational
Institutes
14.6.3.3.3. Government
14.6.3.3.4. Media
and Journalism
14.6.3.3.5. Oil
and Gas
14.6.3.3.6. Power
14.6.3.3.7. Others
14.6.3.4. India
Rainfall and Run-off Software Market Revenue (US$ Mn) and Forecasts, By Organization
Size
14.6.3.4.1. Small
and Medium Enterprises
14.6.3.4.2. Large
Enterprises
14.6.4. New
Zealand
14.6.4.1. New
Zealand Rainfall and Run-off Software Market Revenue (US$ Mn) and Forecasts, By
Deployment
14.6.4.1.1. Cloud
Based
14.6.4.1.2. On
Premises
14.6.4.2. New
Zealand Rainfall and Run-off Software Market Revenue (US$ Mn) and Forecasts, By
Operating System
14.6.4.2.1. Windows
14.6.4.2.2. Linux
14.6.4.2.3. Mac
14.6.4.3. New
Zealand Rainfall and Run-off Software Market Revenue (US$ Mn) and Forecasts, By
End Users
14.6.4.3.1. Construction
14.6.4.3.2. Educational
Institutes
14.6.4.3.3. Government
14.6.4.3.4. Media
and Journalism
14.6.4.3.5. Oil
and Gas
14.6.4.3.6. Power
14.6.4.3.7. Others
14.6.4.4. New Zealand
Rainfall and Run-off Software Market Revenue (US$ Mn) and Forecasts, By
Organization Size
14.6.4.4.1. Small
and Medium Enterprises
14.6.4.4.2. Large
Enterprises
14.6.5. Australia
14.6.5.1. Australia
Rainfall and Run-off Software Market Revenue (US$ Mn) and Forecasts, By
Deployment
14.6.5.1.1. Cloud
Based
14.6.5.1.2. On
Premises
14.6.5.2. Australia
Rainfall and Run-off Software Market Revenue (US$ Mn) and Forecasts, By
Operating System
14.6.5.2.1. Windows
14.6.5.2.2. Linux
14.6.5.2.3. Mac
14.6.5.3. Australia
Rainfall and Run-off Software Market Revenue (US$ Mn) and Forecasts, By End
Users
14.6.5.3.1. Construction
14.6.5.3.2. Educational
Institutes
14.6.5.3.3. Government
14.6.5.3.4. Media
and Journalism
14.6.5.3.5. Oil
and Gas
14.6.5.3.6. Power
14.6.5.3.7. Others
14.6.5.4. Australia
Rainfall and Run-off Software Market Revenue (US$ Mn) and Forecasts, By
Organization Size
14.6.5.4.1. Small
and Medium Enterprises
14.6.5.4.2. Large
Enterprises
14.6.6. South
Korea
14.6.6.1. South
Korea Rainfall and Run-off Software Market Revenue (US$ Mn) and Forecasts, By
Deployment
14.6.6.1.1. Cloud
Based
14.6.6.1.2. On
Premises
14.6.6.2. South
Korea Rainfall and Run-off Software Market Revenue (US$ Mn) and Forecasts, By
Operating System
14.6.6.2.1. Windows
14.6.6.2.2. Linux
14.6.6.2.3. Mac
14.6.6.3. South
Korea Rainfall and Run-off Software Market Revenue (US$ Mn) and Forecasts, By
End Users
14.6.6.3.1. Construction
14.6.6.3.2. Educational
Institutes
14.6.6.3.3. Government
14.6.6.3.4. Media
and Journalism
14.6.6.3.5. Oil
and Gas
14.6.6.3.6. Power
14.6.6.3.7. Others
14.6.6.4. South
Korea Rainfall and Run-off Software Market Revenue (US$ Mn) and Forecasts, By
Organization Size
14.6.6.4.1. Small
and Medium Enterprises
14.6.6.4.2. Large
Enterprises
14.6.7. Southeast
Asia
14.6.7.1. Southeast
Asia Rainfall and Run-off Software Market Revenue (US$ Mn) and Forecasts, By
Deployment
14.6.7.1.1. Cloud
Based
14.6.7.1.2. On
Premises
14.6.7.2. Southeast
Asia Rainfall and Run-off Software Market Revenue (US$ Mn) and Forecasts, By Operating
System
14.6.7.2.1. Windows
14.6.7.2.2. Linux
14.6.7.2.3. Mac
14.6.7.3. Southeast
Asia Rainfall and Run-off Software Market Revenue (US$ Mn) and Forecasts, By
End Users
14.6.7.3.1. Construction
14.6.7.3.2. Educational
Institutes
14.6.7.3.3. Government
14.6.7.3.4. Media
and Journalism
14.6.7.3.5. Oil
and Gas
14.6.7.3.6. Power
14.6.7.3.7. Others
14.6.7.4. Southeast
Asia Rainfall and Run-off Software Market Revenue (US$ Mn) and Forecasts, By
Organization Size
14.6.7.4.1. Small
and Medium Enterprises
14.6.7.4.2. Large
Enterprises
14.6.7.5. Southeast
Asia Rainfall and Run-off Software Market Revenue (US$ Mn) and Forecasts, By
Country
14.6.7.5.1. Indonesia
14.6.7.5.2. Thailand
14.6.7.5.3. Malaysia
14.6.7.5.4. Singapore
14.6.7.5.5. Rest
of Southeast Asia
14.6.8. Rest of
Asia Pacific
14.6.8.1. Rest
of Asia Pacific Rainfall and Run-off Software Market Revenue (US$ Mn) and
Forecasts, By Deployment
14.6.8.1.1. Cloud
Based
14.6.8.1.2. On
Premises
14.6.8.2. Rest
of Asia Pacific Rainfall and Run-off Software Market Revenue (US$ Mn) and Forecasts,
By Operating System
14.6.8.2.1. Windows
14.6.8.2.2. Linux
14.6.8.2.3. Mac
14.6.8.3. Rest
of Asia Pacific Rainfall and Run-off Software Market Revenue (US$ Mn) and
Forecasts, By End Users
14.6.8.3.1. Construction
14.6.8.3.2. Educational
Institutes
14.6.8.3.3. Government
14.6.8.3.4. Media
and Journalism
14.6.8.3.5. Oil
and Gas
14.6.8.3.6. Power
14.6.8.3.7. Others
14.6.8.4. Rest
of Asia Pacific Rainfall and Run-off Software Market Revenue (US$ Mn) and
Forecasts, By Organization Size
14.6.8.4.1. Small
and Medium Enterprises
14.6.8.4.2. Large
Enterprises
14.7. Key
Segment for Channeling Investments
14.7.1. By
Country
14.7.2. By
Deployment
14.7.3. By
Operating System
14.7.4. By End
Users
14.7.5. By
Organization Size
15. Middle
East and Africa Rainfall and Run-off Software Market Analysis and Forecasts,
2019 - 2027
15.1. Overview
15.1.1. Middle
East and Africa Rainfall and Run-off Software Market Revenue (US$ Mn)
15.2. Middle
East and Africa Rainfall and Run-off Software Market Revenue (US$ Mn) and
Forecasts, By Deployment
15.2.1. Cloud
Based
15.2.2. On
Premises
15.3. Middle
East and Africa Rainfall and Run-off Software Market Revenue (US$ Mn) and
Forecasts, By Operating System
15.3.1. Windows
15.3.2. Linux
15.3.3. Mac
15.4. Middle
East and Africa Rainfall and Run-off Software Market Revenue (US$ Mn) and
Forecasts, By End Users
15.4.1. Construction
15.4.2. Educational
Institutes
15.4.3. Government
15.4.4. Media
and Journalism
15.4.5. Oil and
Gas
15.4.6. Power
15.4.7. Others
15.5. Middle
East and Africa Rainfall and Run-off Software Market Revenue (US$ Mn) and
Forecasts, By Organization Size
15.5.1. Small
and Medium Enterprises
15.5.2. Large
Enterprises
15.6. Middle
East and Africa Rainfall and Run-off Software Market Revenue (US$ Mn) and
Forecasts, By Country
15.6.1. Saudi
Arabia
15.6.1.1. Saudi
Arabia Rainfall and Run-off Software Market Revenue (US$ Mn) and Forecasts, By
Deployment
15.6.1.1.1. Cloud
Based
15.6.1.1.2. On
Premises
15.6.1.2. Saudi
Arabia Rainfall and Run-off Software Market Revenue (US$ Mn) and Forecasts, By
Operating System
15.6.1.2.1. Windows
15.6.1.2.2. Linux
15.6.1.2.3. Mac
15.6.1.3. Saudi
Arabia Rainfall and Run-off Software Market Revenue (US$ Mn) and Forecasts, By
End Users
15.6.1.3.1. Construction
15.6.1.3.2. Educational
Institutes
15.6.1.3.3. Government
15.6.1.3.4. Media
and Journalism
15.6.1.3.5. Oil
and Gas
15.6.1.3.6. Power
15.6.1.3.7. Others
15.6.1.4. Saudi
Arabia Rainfall and Run-off Software Market Revenue (US$ Mn) and Forecasts, By
Organization Size
15.6.1.4.1. Small
and Medium Enterprises
15.6.1.4.2. Large
Enterprises
15.6.2. UAE
15.6.2.1. UAE
Rainfall and Run-off Software Market Revenue (US$ Mn) and Forecasts, By
Deployment
15.6.2.1.1. Cloud
Based
15.6.2.1.2. On
Premises
15.6.2.2. UAE
Rainfall and Run-off Software Market Revenue (US$ Mn) and Forecasts, By
Operating System
15.6.2.2.1. Windows
15.6.2.2.2. Linux
15.6.2.2.3. Mac
15.6.2.3. UAE
Rainfall and Run-off Software Market Revenue (US$ Mn) and Forecasts, By End
Users
15.6.2.3.1. Construction
15.6.2.3.2. Educational
Institutes
15.6.2.3.3. Government
15.6.2.3.4. Media
and Journalism
15.6.2.3.5. Oil
and Gas
15.6.2.3.6. Power
15.6.2.3.7. Others
15.6.2.4. UAE
Rainfall and Run-off Software Market Revenue (US$ Mn) and Forecasts, By
Organization Size
15.6.2.4.1. Small
and Medium Enterprises
15.6.2.4.2. Large
Enterprises
15.6.3. Egypt
15.6.3.1. Egypt
Rainfall and Run-off Software Market Revenue (US$ Mn) and Forecasts, By
Deployment
15.6.3.1.1. Cloud
Based
15.6.3.1.2. On
Premises
15.6.3.2. Egypt
Rainfall and Run-off Software Market Revenue (US$ Mn) and Forecasts, By
Operating System
15.6.3.2.1. Windows
15.6.3.2.2. Linux
15.6.3.2.3. Mac
15.6.3.3. Egypt
Rainfall and Run-off Software Market Revenue (US$ Mn) and Forecasts, By End
Users
15.6.3.3.1. Construction
15.6.3.3.2. Educational
Institutes
15.6.3.3.3. Government
15.6.3.3.4. Media
and Journalism
15.6.3.3.5. Oil
and Gas
15.6.3.3.6. Power
15.6.3.3.7. Others
15.6.3.4. Egypt
Rainfall and Run-off Software Market Revenue (US$ Mn) and Forecasts, By Organization
Size
15.6.3.4.1. Small
and Medium Enterprises
15.6.3.4.2. Large
Enterprises
15.6.4. Kuwait
15.6.4.1. Kuwait
Rainfall and Run-off Software Market Revenue (US$ Mn) and Forecasts, By
Deployment
15.6.4.1.1. Cloud
Based
15.6.4.1.2. On
Premises
15.6.4.2. Kuwait
Rainfall and Run-off Software Market Revenue (US$ Mn) and Forecasts, By
Operating System
15.6.4.2.1. Windows
15.6.4.2.2. Linux
15.6.4.2.3. Mac
15.6.4.3. Kuwait
Rainfall and Run-off Software Market Revenue (US$ Mn) and Forecasts, By End
Users
15.6.4.3.1. Construction
15.6.4.3.2. Educational
Institutes
15.6.4.3.3. Government
15.6.4.3.4. Media
and Journalism
15.6.4.3.5. Oil
and Gas
15.6.4.3.6. Power
15.6.4.3.7. Others
15.6.4.4. Kuwait
Rainfall and Run-off Software Market Revenue (US$ Mn) and Forecasts, By
Organization Size
15.6.4.4.1. Small
and Medium Enterprises
15.6.4.4.2. Large
Enterprises
15.6.5. South
Africa
15.6.5.1. South
Africa Rainfall and Run-off Software Market Revenue (US$ Mn) and Forecasts, By
Deployment
15.6.5.1.1. Cloud
Based
15.6.5.1.2. On
Premises
15.6.5.2. South
Africa Rainfall and Run-off Software Market Revenue (US$ Mn) and Forecasts, By
Operating System
15.6.5.2.1. Windows
15.6.5.2.2. Linux
15.6.5.2.3. Mac
15.6.5.3. South
Africa Rainfall and Run-off Software Market Revenue (US$ Mn) and Forecasts, By
End Users
15.6.5.3.1. Construction
15.6.5.3.2. Educational
Institutes
15.6.5.3.3. Government
15.6.5.3.4. Media
and Journalism
15.6.5.3.5. Oil
and Gas
15.6.5.3.6. Power
15.6.5.3.7. Others
15.6.5.4. South
Africa Rainfall and Run-off Software Market Revenue (US$ Mn) and Forecasts, By
Organization Size
15.6.5.4.1. Small
and Medium Enterprises
15.6.5.4.2. Large
Enterprises
15.6.6. Rest of
Middle East & Africa
15.6.6.1. Rest
of Middle East & Africa Rainfall and Run-off Software Market Revenue (US$
Mn) and Forecasts, By Deployment
15.6.6.1.1. Cloud
Based
15.6.6.1.2. On
Premises
15.6.6.2. Rest
of Middle East & Africa Rainfall and Run-off Software Market Revenue (US$
Mn) and Forecasts, By Operating System
15.6.6.2.1. Windows
15.6.6.2.2. Linux
15.6.6.2.3. Mac
15.6.6.3. Rest of
Middle East & Africa Rainfall and Run-off Software Market Revenue (US$ Mn)
and Forecasts, By End Users
15.6.6.3.1. Construction
15.6.6.3.2. Educational
Institutes
15.6.6.3.3. Government
15.6.6.3.4. Media
and Journalism
15.6.6.3.5. Oil
and Gas
15.6.6.3.6. Power
15.6.6.3.7. Others
15.6.6.4. Rest
of Middle East & Africa Rainfall and Run-off Software Market Revenue (US$
Mn) and Forecasts, By Organization Size
15.6.6.4.1. Small
and Medium Enterprises
15.6.6.4.2. Large
Enterprises
15.7. Key
Segment for Channeling Investments
15.7.1. By
Country
15.7.2. By
Deployment
15.7.3. By
Operating System
15.7.4. By End
Users
15.7.5. By
Organization Size
16. Latin
America Rainfall and Run-off Software Market Analysis and Forecasts, 2019 -
2027
16.1. Overview
16.1.1. Latin
America Rainfall and Run-off Software Market Revenue (US$ Mn)
16.2. Latin
America Rainfall and Run-off Software Market Revenue (US$ Mn) and Forecasts, By
Deployment
16.2.1. Cloud
Based
16.2.2. On
Premises
16.3. Latin
America Rainfall and Run-off Software Market Revenue (US$ Mn) and Forecasts, By
Operating System
16.3.1. Windows
16.3.2. Linux
16.3.3. Mac
16.4. Latin
America Rainfall and Run-off Software Market Revenue (US$ Mn) and Forecasts, By
End Users
16.4.1. Construction
16.4.2. Educational
Institutes
16.4.3. Government
16.4.4. Media
and Journalism
16.4.5. Oil and
Gas
16.4.6. Power
16.4.7. Others
16.5. Latin
America Rainfall and Run-off Software Market Revenue (US$ Mn) and Forecasts, By
Organization Size
16.5.1. Small
and Medium Enterprises
16.5.2. Large
Enterprises
16.6. Latin
America Rainfall and Run-off Software Market Revenue (US$ Mn) and Forecasts, By
Country
16.6.1. Brazil
16.6.1.1. Brazil
Rainfall and Run-off Software Market Revenue (US$ Mn) and Forecasts, By
Deployment
16.6.1.1.1. Cloud
Based
16.6.1.1.2. On
Premises
16.6.1.2. Brazil
Rainfall and Run-off Software Market Revenue (US$ Mn) and Forecasts, By
Operating System
16.6.1.2.1. Windows
16.6.1.2.2. Linux
16.6.1.2.3. Mac
16.6.1.3. Brazil
Rainfall and Run-off Software Market Revenue (US$ Mn) and Forecasts, By End
Users
16.6.1.3.1. Construction
16.6.1.3.2. Educational
Institutes
16.6.1.3.3. Government
16.6.1.3.4. Media
and Journalism
16.6.1.3.5. Oil
and Gas
16.6.1.3.6. Power
16.6.1.3.7. Others
16.6.1.4. Brazil
Rainfall and Run-off Software Market Revenue (US$ Mn) and Forecasts, By
Organization Size
16.6.1.4.1. Small
and Medium Enterprises
16.6.1.4.2. Large
Enterprises
16.6.2. Argentina
16.6.2.1. Argentina
Rainfall and Run-off Software Market Revenue (US$ Mn) and Forecasts, By
Deployment
16.6.2.1.1. Cloud
Based
16.6.2.1.2. On
Premises
16.6.2.2. Argentina
Rainfall and Run-off Software Market Revenue (US$ Mn) and Forecasts, By
Operating System
16.6.2.2.1. Windows
16.6.2.2.2. Linux
16.6.2.2.3. Mac
16.6.2.3. Argentina
Rainfall and Run-off Software Market Revenue (US$ Mn) and Forecasts, By End
Users
16.6.2.3.1. Construction
16.6.2.3.2. Educational
Institutes
16.6.2.3.3. Government
16.6.2.3.4. Media
and Journalism
16.6.2.3.5. Oil
and Gas
16.6.2.3.6. Power
16.6.2.3.7. Others
16.6.2.4. Argentina
Rainfall and Run-off Software Market Revenue (US$ Mn) and Forecasts, By
Organization Size
16.6.2.4.1. Small
and Medium Enterprises
16.6.2.4.2. Large
Enterprises
16.6.3. Rest of
Latin America
16.6.3.1. Rest
of Latin America Rainfall and Run-off Software Market Revenue (US$ Mn) and
Forecasts, By Deployment
16.6.3.1.1. Cloud
Based
16.6.3.1.2. On
Premises
16.6.3.2. Rest
of Latin America Rainfall and Run-off Software Market Revenue (US$ Mn) and
Forecasts, By Operating System
16.6.3.2.1. Windows
16.6.3.2.2. Linux
16.6.3.2.3. Mac
16.6.3.3. Rest
of Latin America Rainfall and Run-off Software Market Revenue (US$ Mn) and
Forecasts, By End Users
16.6.3.3.1. Construction
16.6.3.3.2. Educational
Institutes
16.6.3.3.3. Government
16.6.3.3.4. Media
and Journalism
16.6.3.3.5. Oil
and Gas
16.6.3.3.6. Power
16.6.3.3.7. Others
16.6.3.4. Rest
of Latin America Rainfall and Run-off Software Market Revenue (US$ Mn) and
Forecasts, By Organization Size
16.6.3.4.1. Small
and Medium Enterprises
16.6.3.4.2. Large
Enterprises
16.7. Key
Segment for Channeling Investments
16.7.1. By
Country
16.7.2. By
Deployment
16.7.3. By
Operating System
16.7.4. By End
Users
16.7.5. By
Organization Size
17. Competitive
Benchmarking
17.1. Brand
Benchmarking
17.2. Market
Share Analysis, 2018
17.3. Global
Presence and Growth Strategies
17.3.1. Mergers
and Acquisitions
17.3.2. Product
Launches
17.3.3. Investments
Trends
17.3.4. R&D
Initiatives
18. Player
Profiles
18.1. Aquatic
Informatics Inc.
18.1.1. Company
Details
18.1.2. Company
Overview
18.1.3. Product
Offerings
18.1.4. Key
Developments
18.1.5. Financial
Analysis
18.1.6. SWOT
Analysis
18.1.7. Business
Strategies
18.2. Bentley
System Incorporated
18.2.1. Company
Details
18.2.2. Company
Overview
18.2.3. Product
Offerings
18.2.4. Key
Developments
18.2.5. Financial
Analysis
18.2.6. SWOT
Analysis
18.2.7. Business
Strategies
18.3. FLO-2D
Software
18.3.1. Company
Details
18.3.2. Company
Overview
18.3.3. Product
Offerings
18.3.4. Key
Developments
18.3.5. Financial
Analysis
18.3.6. SWOT
Analysis
18.3.7. Business
Strategies
18.4. HydroCAD
Software Solutions LLC
18.4.1. Company
Details
18.4.2. Company
Overview
18.4.3. Product
Offerings
18.4.4. Key
Developments
18.4.5. Financial
Analysis
18.4.6. SWOT
Analysis
18.4.7. Business
Strategies
18.5. Innovyze
18.5.1. Company
Details
18.5.2. Company
Overview
18.5.3. Product
Offerings
18.5.4. Key Developments
18.5.5. Financial
Analysis
18.5.6. SWOT
Analysis
18.5.7. Business
Strategies
18.6. J.F.
Sabourin and Associates Inc.
18.6.1. Company
Details
18.6.2. Company
Overview
18.6.3. Product
Offerings
18.6.4. Key
Developments
18.6.5. Financial
Analysis
18.6.6. SWOT
Analysis
18.6.7. Business
Strategies
18.7. KISTERS
AG
18.7.1. Company
Details
18.7.2. Company
Overview
18.7.3. Product
Offerings
18.7.4. Key
Developments
18.7.5. Financial
Analysis
18.7.6. SWOT
Analysis
18.7.7. Business
Strategies
18.8. Rehm
Software GmbH
18.8.1. Company
Details
18.8.2. Company
Overview
18.8.3. Product
Offerings
18.8.4. Key
Developments
18.8.5. Financial
Analysis
18.8.6. SWOT
Analysis
18.8.7. Business
Strategies
18.9. SoilVision
Systems Ltd.
18.9.1. Company
Details
18.9.2. Company
Overview
18.9.3. Product
Offerings
18.9.4. Key
Developments
18.9.5. Financial
Analysis
18.9.6. SWOT
Analysis
18.9.7. Business
Strategies
18.10. Vieux X
Associates INC
18.10.1. Company
Details
18.10.2. Company
Overview
18.10.3. Product
Offerings
18.10.4. Key
Developments
18.10.5. Financial
Analysis
18.10.6. SWOT
Analysis
18.10.7. Business
Strategies
18.11. Water
Resource Associates LLP
18.11.1. Company
Details
18.11.2. Company
Overview
18.11.3. Product
Offerings
18.11.4. Key
Developments
18.11.5. Financial
Analysis
18.11.6. SWOT
Analysis
18.11.7. Business Strategies
18.12. Other
Market Participants
19. Key Findings
Note: This ToC is tentative and can
be changed according to the research study conducted during the course of
report completion.
**Exclusive for Multi-User and
Enterprise User.
At Absolute Markets Insights, we are engaged in building both global as well as country specific reports. As a result, the approach taken for deriving the estimation and forecast for a specific country is a bit unique and different in comparison to the global research studies. In this case, we not only study the concerned market factors & trends prevailing in a particular country (from secondary research) but we also tend to calculate the actual market size & forecast from the revenue generated from the market participants involved in manufacturing or distributing the any concerned product. These companies can also be service providers. For analyzing any country specifically, we do consider the growth factors prevailing under the states/cities/county for the same. For instance, if we are analyzing an industry specific to United States, we primarily need to study about the states present under the same(where the product/service has the highest growth). Similar analysis will be followed by other countries. Our scope of the report changes with different markets.
Our research study is mainly implement through a mix of both secondary and primary research. Various sources such as industry magazines, trade journals, and government websites and trade associations are reviewed for gathering precise data. Primary interviews are conducted to validate the market size derived from secondary research. Industry experts, major manufacturers and distributors are contacted for further validation purpose on the current market penetration and growth trends.
Prominent participants in our primary research process include:
- Key Opinion Leaders namely the CEOs, CSOs, VPs, purchasing managers, amongst others
- Research and development participants, distributors/suppliers and subject matter experts
Secondary Research includes data extracted from paid data sources:
- Reuters
- Factiva
- Bloomberg
- One Source
- Hoovers
Research Methodology

Key Inclusions


