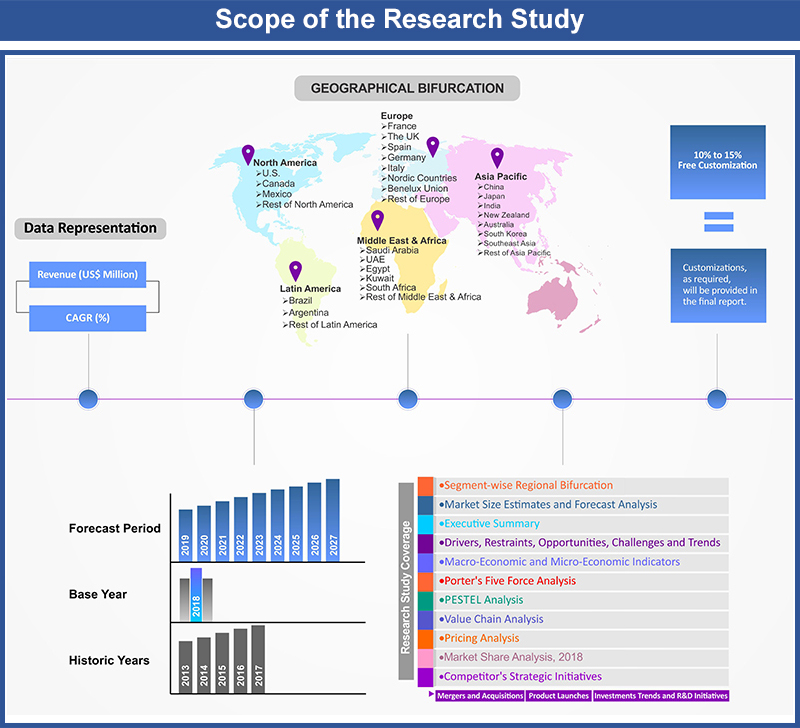
Recycled PET Chips Market by Type (Clear Chip, Brown Chip, Green Chip, Blue Chip, Others); by Applications (Bottles, Sheet, Fiber, Strapping); by Region (U.S., Rest of North America, France, UK, Germany, Spain, Italy, Rest of Europe, China, Japan, India, Southeast Asia, Rest of Asia Pacific, GCC Countries, Southern Africa, Rest of MEA, Brazil, Rest of Latin America) – Global Insights, Growth, Size, Comparative Analysis, Trends and Forecast, 2018-2026.
Industry Trends
Polyethylene terephthalate also called as PET, is basically the most widely used plastic, among various other types. These are extensively used in food and beverage and several other industries. In food and beverage industry, this mainly finds application as packaging materials, in the form of bottles, and other containers. PET chips are prepared from these used plastic bottles and containers, by recycling them. These chips are re-used for making plastic bags, bottles, packaging plastics and others.
Numerous researches have demonstrated that the degradation rate of the polymer is enhanced when the size of the polymer is small. The recently growing interest for environmentally sustainable products has found new applications of recycled PET chips in developing sheet and film, new containers for both food and non-food products and in industrial strapping. The increasing awareness regarding the adverse effects of using polyethylene terephthalate for packaging and transportation has resulted in the widespread of a well-established logistic chain including bottles collection, flake production and pellet production.
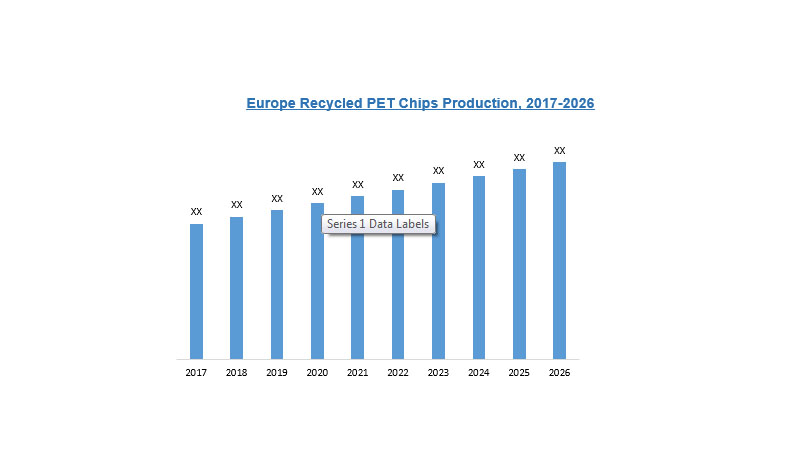
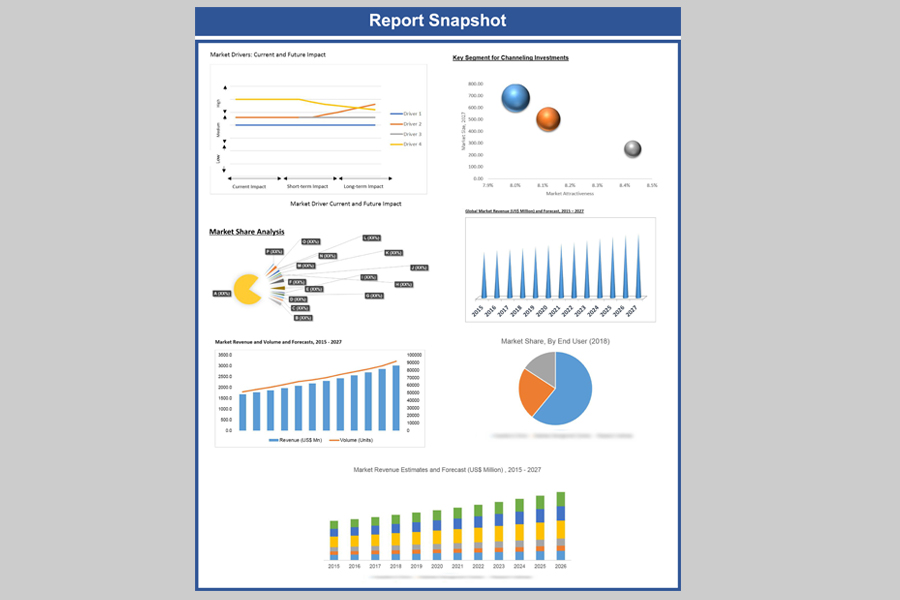
Global Recycled PET Chips Market is expected to grow with a CAGR of 4.5% during the forecast period of 2018 to 2026. The study analyzes the market in terms of revenue and sales volume across all the major markets.
Competitive Landscape
The Recycled PET Chips Market report provides both, qualitative and quantitative research of the market, as well as provides worthy insights into the rational scenario and favored development methods adopted by the key contenders. The report also offers extensive research on the key players in this market and detailed insights on the competitiveness of these players. Key business strategies such as mergers and acquisitions (M&A), affiliations, collaborations, and contracts adopted by major players are also recognized and analyzed in Recycled PET Chips Market report. For each company, the report recognizes their headquarter, competitors, product/service type, application and specification, pricing, and gross margin. Participants operating in this market are Clean Tech Incorporated, Clear Path Recycling, MOHAWK INDUSTRIES, INC., CarbonLITE Industries, Visy, Evergreen Plastics, Extrupet, PolyQuest, Phoenix Technologies Ltd., Verdeco Recycling Inc., 4PET Recycling, Far Eastern Group, KYOEI INDUSTORY CO.,LTD. and WELLPINE PLASTIC INDUSTRIAL CO.,LTD. amongst others.
Table of Contents
![]()
1. Introduction
1.1. Market Scope
1.2. Market Segmentation
1.3. Methodology
1.4. Assumptions
2. Recycled PET Chips Market Snapshot
3. Executive Summary: Recycled PET Chips Market
4. Qualitative Analysis: Recycled PET Chips Market
4.1. Introduction
4.1.1. Product Definition
4.1.2. Industry Development
4.2. Market Dynamics
4.2.1. Drivers
4.2.2. Restraints
4.2.3. Opportunities
4.3. Trends in Recycled PET Chips Market
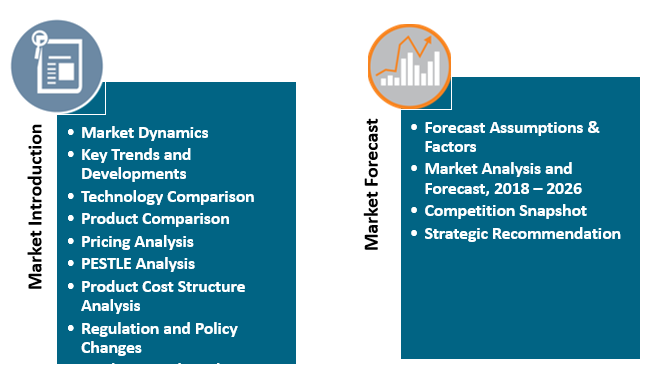
5. Global Recycled PET Chips Market Analysis and Forecasts, 2018
– 2026
5.1. Overview
5.1.1. Global Recycled PET Chips Market Revenue (US$ Mn) and
Forecasts
5.2. Global Recycled PET Chips Market Revenue (US$ Mn) and
Forecasts, By Type
5.2.1. Clear Chip
5.2.1.1. Definition
5.2.1.2. Market Penetration
5.2.1.3. Market Revenue Expected to Increase by 2026
5.2.1.4. Compound Annual Growth Rate (CAGR)
5.2.2. Brown Chip
5.2.2.1. Definition
5.2.2.2. Market Penetration
5.2.2.3. Market Revenue Expected to Increase by 2026
5.2.2.4. Compound Annual Growth Rate (CAGR)
5.2.3. Green Chip
5.2.3.1. Definition
5.2.3.2. Market Penetration
5.2.3.3. Market Revenue Expected to Increase by 2026
5.2.3.4. Compound Annual Growth Rate (CAGR)
5.2.4. Blue Chip
5.2.4.1. Definition
5.2.4.2. Market Penetration
5.2.4.3. Market Revenue Expected to Increase by 2026
5.2.4.4. Compound Annual Growth Rate (CAGR)
5.2.5. Others
5.2.5.1. Definition
5.2.5.2. Market Penetration
5.2.5.3. Market Revenue Expected to Increase by 2026
5.2.5.4. Compound Annual Growth Rate (CAGR)
5.3. Key Segment for Channeling Investments
5.3.1. By Type
6. Global Recycled PET Chips Market Analysis and Forecasts, 2018
– 2026
6.1. Overview
6.2. Global Recycled PET Chips Market Revenue (US$ Mn) and
Forecasts, By Applications
6.2.1. Bottles
6.2.1.1. Definition
6.2.1.2. Market Penetration
6.2.1.3. Market Revenue Expected to Increase by 2026
6.2.1.4. Compound Annual Growth Rate (CAGR)
6.2.2. Sheet
6.2.2.1. Definition
6.2.2.2. Market Penetration
6.2.2.3. Market Revenue Expected to Increase by 2026
6.2.2.4. Compound Annual Growth Rate (CAGR)
6.2.3. Fiber
6.2.3.1. Definition
6.2.3.2. Market Penetration
6.2.3.3. Market Revenue Expected to Increase by 2026
6.2.3.4. Compound Annual Growth Rate (CAGR)
6.2.4. Strapping
6.2.4.1. Definition
6.2.4.2. Market Penetration
6.2.4.3. Market Revenue Expected to Increase by 2026
6.2.4.4. Compound Annual Growth Rate (CAGR)
6.3. Key Segment for Channeling Investments
6.3.1.
By Applications
7. North America Recycled PET Chips Market Analysis and
Forecasts, 2018 – 2026
7.1. Overview
7.1.1. North America Recycled PET Chips Market Revenue (US$ Mn)
7.2. North America Recycled PET Chips Market Revenue (US$ Mn) and
Forecasts, By Type
7.2.1. Clear Chip
7.2.2. Brown Chip
7.2.3. Green Chip
7.2.4. Blue Chip
7.2.5. Others
7.3. North America Recycled PET Chips Market Revenue (US$ Mn) and
Forecasts, By Applications
7.3.1. Bottles
7.3.2. Sheet
7.3.3. Fiber
7.3.4. Strapping
7.4. North America Recycled PET Chips Market Revenue (US$ Mn) and
Forecasts, By Country
7.4.1. U.S.
7.4.1.1. U.S. Recycled PET Chips Market Revenue (US$ Mn) and Forecasts,
By Type
7.4.1.1.1. Clear Chip
7.4.1.1.2. Brown Chip
7.4.1.1.3. Green Chip
7.4.1.1.4. Blue Chip
7.4.1.1.5. Others
7.4.1.2. U.S. Recycled PET Chips Market Revenue (US$ Mn) and Forecasts,
By Applications
7.4.1.2.1. Bottles
7.4.1.2.2. Sheet
7.4.1.2.3. Fiber
7.4.1.2.4. Strapping
7.4.2. Rest of North America
7.4.2.1. Rest of North America Recycled PET Chips Market Revenue (US$
Mn) and Forecasts, By Type
7.4.2.1.1. Clear Chip
7.4.2.1.2. Brown Chip
7.4.2.1.3. Green Chip
7.4.2.1.4. Blue Chip
7.4.2.1.5. Others
7.4.2.2. Rest of North America Recycled PET Chips Market Revenue (US$
Mn) and Forecasts, By Applications
7.4.2.2.1. Bottles
7.4.2.2.2. Sheet
7.4.2.2.3. Fiber
7.4.2.2.4. Strapping
7.5. Key Segment for Channeling Investments
7.5.1. By Country
7.5.2. By Type
7.5.3. By Applications
8. Europe Recycled PET Chips Market Analysis and Forecasts, 2018
– 2026
8.1. Overview
8.1.1. Europe Recycled PET Chips Market Revenue (US$ Mn)
8.2. Europe Recycled PET Chips Market Revenue (US$ Mn) and
Forecasts, By Type
8.2.1. Clear Chip
8.2.2. Brown Chip
8.2.3. Green Chip
8.2.4. Blue Chip
8.2.5. Others
8.3. Europe Recycled PET Chips Market Revenue (US$ Mn) and
Forecasts, By Applications
8.3.1. Bottles
8.3.2. Sheet
8.3.3. Fiber
8.3.4. Strapping
8.4. Europe Recycled PET Chips Market Revenue (US$ Mn) and
Forecasts, By Country
8.4.1. France
8.4.1.1. France Recycled PET Chips Market Revenue (US$ Mn) and
Forecasts, By Type
8.4.1.1.1. Clear Chip
8.4.1.1.2. Brown Chip
8.4.1.1.3. Green Chip
8.4.1.1.4. Blue Chip
8.4.1.1.5. Others
8.4.1.2. France Recycled PET Chips Market Revenue (US$ Mn) and
Forecasts, By Applications
8.4.1.2.1. Bottles
8.4.1.2.2. Sheet
8.4.1.2.3. Fiber
8.4.1.2.4.
Strapping
8.4.2. The UK
8.4.2.1. The UK Recycled PET Chips Market Revenue (US$ Mn) and
Forecasts, By Type
8.4.2.1.1. Clear Chip
8.4.2.1.2. Brown Chip
8.4.2.1.3. Green Chip
8.4.2.1.4. Blue Chip
8.4.2.1.5. Others
8.4.2.2. The UK Recycled PET Chips Market Revenue (US$ Mn) and
Forecasts, By Applications
8.4.2.2.1. Bottles
8.4.2.2.2. Sheet
8.4.2.2.3. Fiber
8.4.2.2.4. Strapping
8.4.3. Spain
8.4.3.1. Spain Recycled PET Chips Market Revenue (US$ Mn) and
Forecasts, By Type
8.4.3.1.1. Clear Chip
8.4.3.1.2. Brown Chip
8.4.3.1.3. Green Chip
8.4.3.1.4. Blue Chip
8.4.3.1.5. Others
8.4.3.2. Spain Recycled PET Chips Market Revenue (US$ Mn) and
Forecasts, By Applications
8.4.3.2.1. Bottles
8.4.3.2.2. Sheet
8.4.3.2.3. Fiber
8.4.3.2.4. Strapping
8.4.4. Germany
8.4.4.1. Germany Recycled PET Chips Market Revenue (US$ Mn) and
Forecasts, By Type
8.4.4.1.1. Clear Chip
8.4.4.1.2. Brown Chip
8.4.4.1.3. Green Chip
8.4.4.1.4. Blue Chip
8.4.4.1.5. Others
8.4.4.2. Germany Recycled PET Chips Market Revenue (US$ Mn) and
Forecasts, By Applications
8.4.4.2.1. Bottles
8.4.4.2.2. Sheet
8.4.4.2.3. Fiber
8.4.4.2.4. Strapping
8.4.5. Italy
8.4.5.1. Italy Recycled PET Chips Market Revenue (US$ Mn) and
Forecasts, By Type
8.4.5.1.1. Clear Chip
8.4.5.1.2. Brown Chip
8.4.5.1.3. Green Chip
8.4.5.1.4. Blue Chip
8.4.5.1.5. Others
8.4.5.2. Italy Recycled PET Chips Market Revenue (US$ Mn) and
Forecasts, By Applications
8.4.5.2.1. Bottles
8.4.5.2.2. Sheet
8.4.5.2.3. Fiber
8.4.5.2.4. Strapping
8.4.6. Rest of Europe
8.4.6.1. Rest of Europe Recycled PET Chips Market Revenue (US$ Mn) and
Forecasts, By Type
8.4.6.1.1. Clear Chip
8.4.6.1.2. Brown Chip
8.4.6.1.3. Green Chip
8.4.6.1.4. Blue Chip
8.4.6.1.5. Others
8.4.6.2. Rest of Europe Recycled PET Chips Market Revenue (US$ Mn) and
Forecasts, By Applications
8.4.6.2.1. Bottles
8.4.6.2.2. Sheet
8.4.6.2.3. Fiber
8.4.6.2.4. Strapping
8.5. Key Segment for Channeling Investments
8.5.1. By Country
8.5.2. By Type
8.5.3. By Applications
9. Asia Pacific Recycled PET Chips Market Analysis and
Forecasts, 2018 – 2026
9.1. Overview
9.1.1. Asia Pacific Recycled PET Chips Market Revenue (US$ Mn)
9.2. Asia Pacific Recycled PET Chips Market Revenue (US$ Mn) and
Forecasts, By Type
9.2.1. Clear Chip
9.2.2. Brown Chip
9.2.3. Green Chip
9.2.4. Blue Chip
9.2.5. Others
9.3. Asia Pacific Recycled PET Chips Market Revenue (US$ Mn) and
Forecasts, By Applications
9.3.1. Bottles
9.3.2. Sheet
9.3.3. Fiber
9.3.4. Strapping
9.4. Asia Pacific Recycled PET Chips Market Revenue (US$ Mn) and
Forecasts, By Country
9.4.1. China
9.4.1.1. China Recycled PET Chips Market Revenue (US$ Mn) and
Forecasts, By Type
9.4.1.1.1. Clear Chip
9.4.1.1.2. Brown Chip
9.4.1.1.3. Green Chip
9.4.1.1.4. Blue Chip
9.4.1.1.5. Others
9.4.1.2. China Recycled PET Chips Market Revenue (US$ Mn) and Forecasts,
By Applications
9.4.1.2.1. Bottles
9.4.1.2.2. Sheet
9.4.1.2.3. Fiber
9.4.1.2.4. Strapping
9.4.2. Japan
9.4.2.1. Japan Recycled PET Chips Market Revenue (US$ Mn) and
Forecasts, By Type
9.4.2.1.1. Clear Chip
9.4.2.1.2. Brown Chip
9.4.2.1.3. Green Chip
9.4.2.1.4. Blue Chip
9.4.2.1.5. Others
9.4.2.2. Japan Recycled PET Chips Market Revenue (US$ Mn) and
Forecasts, By Applications
9.4.2.2.1. Bottles
9.4.2.2.2. Sheet
9.4.2.2.3. Fiber
9.4.2.2.4.
Strapping
9.4.3. India
9.4.3.1. India Recycled PET Chips Market Revenue (US$ Mn) and
Forecasts, By Type
9.4.3.1.1. Clear Chip
9.4.3.1.2. Brown Chip
9.4.3.1.3. Green Chip
9.4.3.1.4. Blue Chip
9.4.3.1.5. Others
9.4.3.2. India Recycled PET Chips Market Revenue (US$ Mn) and
Forecasts, By Applications
9.4.3.2.1. Bottles
9.4.3.2.2. Sheet
9.4.3.2.3. Fiber
9.4.3.2.4. Strapping
9.4.4. Southeast Asia
9.4.4.1. Southeast Asia Recycled PET Chips Market Revenue (US$ Mn) and
Forecasts, By Type
9.4.4.1.1. Clear Chip
9.4.4.1.2. Brown Chip
9.4.4.1.3. Green Chip
9.4.4.1.4. Blue Chip
9.4.4.1.5. Others
9.4.4.2. Southeast Asia Recycled PET Chips Market Revenue (US$ Mn) and
Forecasts, By Applications
9.4.4.2.1. Bottles
9.4.4.2.2. Sheet
9.4.4.2.3. Fiber
9.4.4.2.4. Strapping
9.4.5. Rest of Asia Pacific
9.4.5.1. Rest of Asia Pacific Recycled PET Chips Market Revenue (US$
Mn) and Forecasts, By Type
9.4.5.1.1. Clear Chip
9.4.5.1.2. Brown Chip
9.4.5.1.3. Green Chip
9.4.5.1.4. Blue Chip
9.4.5.1.5. Others
9.4.5.2. Rest of Asia Pacific Recycled PET Chips Market Revenue (US$
Mn) and Forecasts, By Applications
9.4.5.2.1. Bottles
9.4.5.2.2. Sheet
9.4.5.2.3. Fiber
9.4.5.2.4. Strapping
9.5. Key Segment for Channeling Investments
9.5.1. By Country
9.5.2. By Type
9.5.3. By Applications
10. Middle East and Africa Recycled PET Chips Market Analysis and
Forecasts, 2018 – 2026
10.1. Overview
10.1.1. Middle East and Africa Recycled PET Chips Market Revenue (US$
Mn)
10.2. Middle East and Africa Recycled PET Chips Market Revenue (US$
Mn) and Forecasts, By Type
10.2.1. Clear Chip
10.2.2. Brown Chip
10.2.3. Green Chip
10.2.4. Blue Chip
10.2.5. Others
10.3. Middle East and Africa Recycled PET Chips Market Revenue (US$
Mn) and Forecasts, By Applications
10.3.1. Bottles
10.3.2. Sheet
10.3.3. Fiber
10.3.4. Strapping
10.4. Middle East and Africa Recycled PET Chips Market Revenue (US$
Mn) and Forecasts, By Country
10.4.1. GCC Countries
10.4.1.1. GCC Countries Recycled PET Chips Market Revenue (US$ Mn) and
Forecasts, By Type
10.4.1.1.1. Clear Chip
10.4.1.1.2. Brown Chip
10.4.1.1.3. Green Chip
10.4.1.1.4. Blue Chip
10.4.1.1.5. Others
10.4.1.2. GCC Countries Recycled PET Chips Market Revenue (US$ Mn) and
Forecasts, By Applications
10.4.1.2.1. Bottles
10.4.1.2.2. Sheet
10.4.1.2.3. Fiber
10.4.1.2.4.
Strapping
10.4.2. Southern Africa
10.4.2.1. Southern Africa Recycled PET Chips Market Revenue (US$ Mn) and
Forecasts, By Type
10.4.2.1.1. Clear Chip
10.4.2.1.2. Brown Chip
10.4.2.1.3. Green Chip
10.4.2.1.4. Blue Chip
10.4.2.1.5. Others
10.4.2.2. Southern Africa Recycled PET Chips Market Revenue (US$ Mn) and
Forecasts, By Applications
10.4.2.2.1. Bottles
10.4.2.2.2. Sheet
10.4.2.2.3. Fiber
10.4.2.2.4. Strapping
10.4.3. Rest of MEA
10.4.3.1. Rest of MEA Recycled PET Chips Market Revenue (US$ Mn) and
Forecasts, By Type
10.4.3.1.1. Clear Chip
10.4.3.1.2. Brown Chip
10.4.3.1.3. Green Chip
10.4.3.1.4. Blue Chip
10.4.3.1.5. Others
10.4.3.2. Rest of MEA Recycled PET Chips Market Revenue (US$ Mn) and
Forecasts, By Applications
10.4.3.2.1. Bottles
10.4.3.2.2. Sheet
10.4.3.2.3. Fiber
10.4.3.2.4. Strapping
10.5. Key Segment for Channeling Investments
10.5.1. By Country
10.5.2. By Type
10.5.3. By Applications
11. Latin America Recycled PET Chips Market Analysis and
Forecasts, 2018 – 2026
11.1. Overview
11.1.1. Latin America Recycled PET Chips Market Revenue (US$ Mn)
11.2. Latin America Recycled PET Chips Market Revenue (US$ Mn) and
Forecasts, By Type
11.2.1. Clear Chip
11.2.2. Brown Chip
11.2.3. Green Chip
11.2.4. Blue Chip
11.2.5. Others
11.3. Latin America Recycled PET Chips Market Revenue (US$ Mn) and
Forecasts, By Applications
11.3.1. Bottles
11.3.2. Sheet
11.3.3. Fiber
11.3.4. Strapping
11.4. Latin America Recycled PET Chips Market Revenue (US$ Mn) and
Forecasts, By Country
11.4.1. Brazil
11.4.1.1. Brazil Recycled PET Chips Market Revenue (US$ Mn) and
Forecasts, By Type
11.4.1.1.1. Clear Chip
11.4.1.1.2. Brown Chip
11.4.1.1.3. Green Chip
11.4.1.1.4. Blue Chip
11.4.1.1.5. Others
11.4.1.2. Brazil Recycled PET Chips Market Revenue (US$ Mn) and
Forecasts, By Applications
11.4.1.2.1. Bottles
11.4.1.2.2. Sheet
11.4.1.2.3. Fiber
11.4.1.2.4. Strapping
11.4.2. Rest of Latin America
11.4.2.1. Rest of Latin America Recycled PET Chips Market Revenue (US$
Mn) and Forecasts, By Type
11.4.2.1.1. Clear Chip
11.4.2.1.2. Brown Chip
11.4.2.1.3. Green Chip
11.4.2.1.4. Blue Chip
11.4.2.1.5. Others
11.4.2.2. Rest of Latin America Recycled PET Chips Market Revenue (US$
Mn) and Forecasts, By Applications
11.4.2.2.1. Bottles
11.4.2.2.2. Sheet
11.4.2.2.3. Fiber
11.4.2.2.4.
Strapping
11.5. Key Segment for Channeling Investments
11.5.1. By Country
11.5.2. By Type
11.5.3. By Applications
12. Competitive Benchmarking
12.1. Player Positioning Analysis
12.2. Global Presence and Growth Strategies
13. Player Profiles
13.1. Clean Tech Incorporated
13.1.1. Company Details
13.1.2. Company Overview
13.1.3. Product Offerings
13.1.4. Key Developments
13.1.5. Financial Analysis
13.1.6. SWOT Analysis
13.1.7. Business Strategies
13.2. Clear Path Recycling
13.2.1. Company Details
13.2.2. Company Overview
13.2.3. Product Offerings
13.2.4. Key Developments
13.2.5. Financial Analysis
13.2.6. SWOT Analysis
13.2.7. Business Strategies
13.3. MOHAWK INDUSTRIES, INC.
13.3.1. Company Details
13.3.2. Company Overview
13.3.3. Product Offerings
13.3.4. Key Developments
13.3.5. Financial Analysis
13.3.6. SWOT Analysis
13.3.7. Business Strategies
13.4. CarbonLITE Industries
13.4.1. Company Details
13.4.2. Company Overview
13.4.3. Product Offerings
13.4.4. Key Developments
13.4.5. Financial Analysis
13.4.6. SWOT Analysis
13.4.7. Business Strategies
13.5. Visy
13.5.1. Company Details
13.5.2. Company Overview
13.5.3. Product Offerings
13.5.4. Key Developments
13.5.5. Financial Analysis
13.5.6. SWOT Analysis
13.5.7. Business Strategies
13.6. Evergreen Plastics
13.6.1. Company Details
13.6.2. Company Overview
13.6.3. Product Offerings
13.6.4. Key Developments
13.6.5. Financial Analysis
13.6.6. SWOT Analysis
13.6.7. Business Strategies
13.7. Extrupet, PolyQuest
13.7.1. Company Details
13.7.2. Company Overview
13.7.3. Product Offerings
13.7.4. Key Developments
13.7.5. Financial Analysis
13.7.6. SWOT Analysis
13.7.7. Business Strategies
13.8. Phoenix Technologies Ltd.
13.8.1. Company Details
13.8.2. Company Overview
13.8.3. Product Offerings
13.8.4. Key Developments
13.8.5. Financial Analysis
13.8.6. SWOT Analysis
13.8.7. Business Strategies
13.9. Verdeco Recycling Inc.
13.9.1. Company Details
13.9.2. Company Overview
13.9.3. Product Offerings
13.9.4. Key Developments
13.9.5. Financial Analysis
13.9.6. SWOT Analysis
13.9.7. Business Strategies
13.10. 4PET
Recycling
13.10.1. Company Details
13.10.2. Company Overview
13.10.3. Product Offerings
13.10.4. Key Developments
13.10.5. Financial Analysis
13.10.6. SWOT Analysis
13.10.7. Business Strategies
13.11. Far
Eastern Group
13.11.1. Company
Details
13.11.2. Company
Overview
13.11.3. Product
Offerings
13.11.4. Key
Developments
13.11.5. Financial
Analysis
13.11.6. SWOT
Analysis
13.11.7. Business Strategies
13.12. KYOEI
INDUSTORY CO., LTD.
13.12.1. Company Details
13.12.2. Company Overview
13.12.3. Product Offerings
13.12.4. Key Developments
13.12.5. Financial Analysis
13.12.6. SWOT Analysis
13.12.7. Business Strategies
13.13. WELLPINE
PLASTIC INDUSTRIAL CO., LTD.
13.13.1. Company Details
13.13.2. Company Overview
13.13.3. Product Offerings
13.13.4. Key Developments
13.13.5. Financial Analysis
13.13.6. SWOT Analysis
13.13.7. Business
Strategies
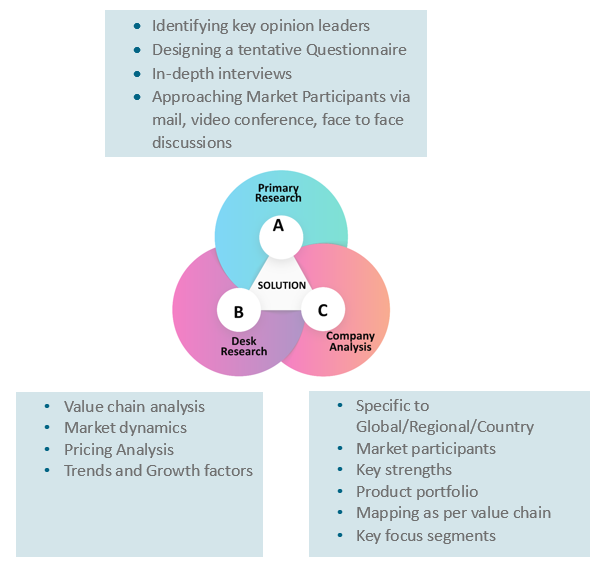
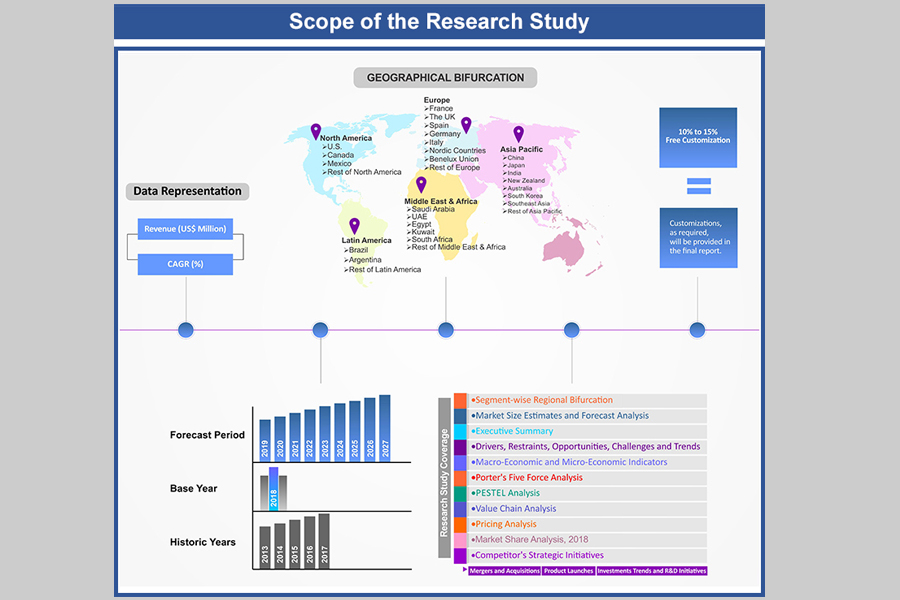
At Absolute Markets Insights, we are engaged in building both global as well as country specific reports. As a result, the approach taken for deriving the estimation and forecast for a specific country is a bit unique and different in comparison to the global research studies. In this case, we not only study the concerned market factors & trends prevailing in a particular country (from secondary research) but we also tend to calculate the actual market size & forecast from the revenue generated from the market participants involved in manufacturing or distributing the any concerned product. These companies can also be service providers. For analyzing any country specifically, we do consider the growth factors prevailing under the states/cities/county for the same. For instance, if we are analyzing an industry specific to United States, we primarily need to study about the states present under the same(where the product/service has the highest growth). Similar analysis will be followed by other countries. Our scope of the report changes with different markets.
Our research study is mainly implement through a mix of both secondary and primary research. Various sources such as industry magazines, trade journals, and government websites and trade associations are reviewed for gathering precise data. Primary interviews are conducted to validate the market size derived from secondary research. Industry experts, major manufacturers and distributors are contacted for further validation purpose on the current market penetration and growth trends.
Prominent participants in our primary research process include:
- Key Opinion Leaders namely the CEOs, CSOs, VPs, purchasing managers, amongst others
- Research and development participants, distributors/suppliers and subject matter experts
Secondary Research includes data extracted from paid data sources:
- Reuters
- Factiva
- Bloomberg
- One Source
- Hoovers
Research Methodology
Key Inclusions
Reach to us
Call us on
+91-74002-42424
Drop us an email at
sales@absolutemarketsinsights.com
Why Absolute Markets Insights?
An effective strategy is the entity that influences a business to stand out of the crowd. An organization with a phenomenal strategy for success dependably has the edge over the rivals in the market. It offers the organizations a head start in planning their strategy. Absolute Market Insights is the new initiation in the industry that will furnish you with the lead your business needs. Absolute Market Insights is the best destination for your business intelligence and analytical solutions; essentially because our qualitative and quantitative sources of information are competent to give one-stop solutions. We inventively combine qualitative and quantitative research in accurate proportions to have the best report, which not only gives the most recent insights but also assists you to grow.
