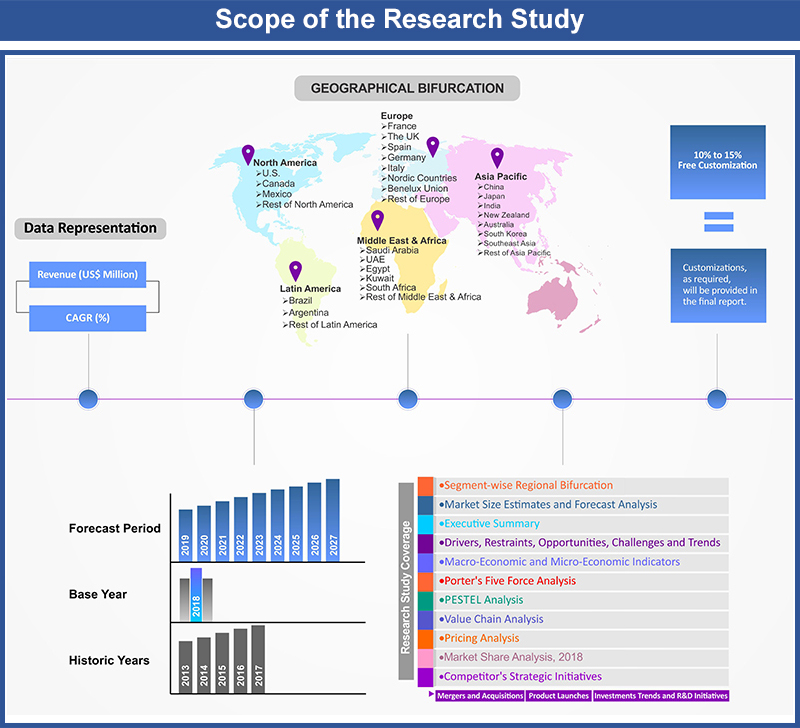
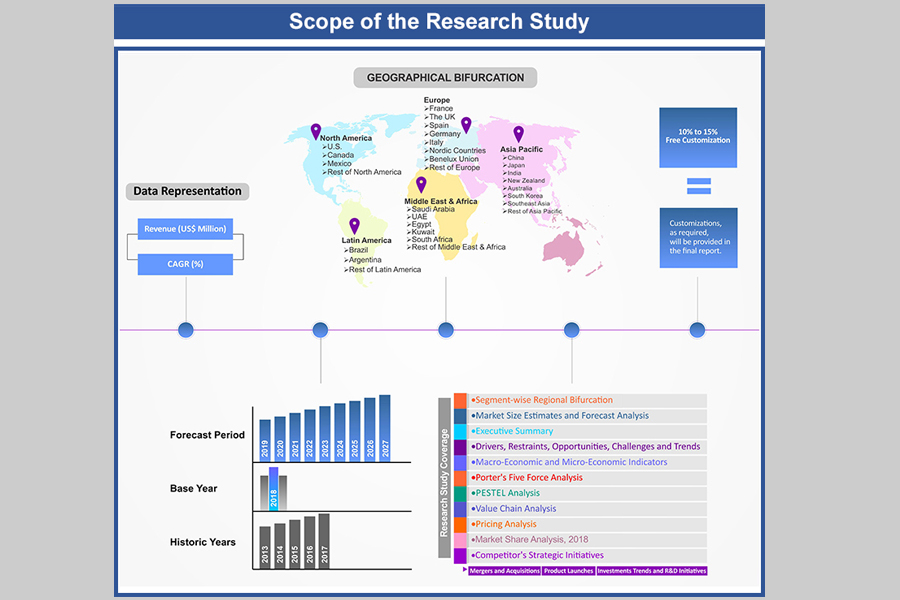
Shipbroking Market By Services (Charting(Container Vessels, Tankers, Dry Bulk), Sales and Purchase(Valuations, Recycling), Offshore, New Buildings, Salvage and Towage); By Vertical (Oil and Gas, Manufacturing, Aerospace and Defense, Government, Others); By Region (U.S., Canada, Mexico, Rest of North America, France, The UK, Spain, Germany, Italy, Nordic Countries, Benelux Union, Rest of Europe, China, Japan, India, New Zealand, Australia, South Korea, Southeast Asia, Rest of Asia Pacific, Saudi Arabia, UAE, Egypt, Kuwait, South Africa, Rest of Middle East & Africa, Brazil, Argentina, Rest of Latin America) – Global Insights, Growth, Size, Comparative Analysis, Trends and Forecast, 2019 – 2027
Industry Trends
Shipping companies have undergone major structural changes since its inception. Earlier these companies were involved in operations related to shipbuilding contract, staffing, technical and all commercial activities. With the increase in complexities in documentations related to financing of the ships and its security, the commercial activities have now been recognized as a separate entity and are generally carried out by brokers who are commonly known as ship brokers who act as intermediaries between the cargo operators and the ship owners. This in turn has increased the demand for shipbrokers across all shipping companies which is directly influencing the growth of the shipbroking market.
The shipbroking market is majorly driven by stringent government norms that safeguard companies and brokers from any unforeseen claims and liabilities. For instance, government bodies across various geographies such as United States and Europe have made insurance policies to save charterers from any loss due to sinking or other activities on a long term charter. There are two types of commission covers, one where the charter is destroyed or cancelled due to various marine perils like bad weather, fire, and theft amongst others and the other where the vessels suffer a major loss due to the negligence of the master or crew of the vessel. These insurance policies cover the overall risk of the shipbrokers thereby influencing the growth of the shipbroking market. On the other hand, the manufacturing segment contributes to the maximum revenue of the shipbroking market. This is attributed to the increased production capacities across industries like fashion and steel owing to the implementation of internet of things in areas like supply chain management, safety and security management amongst others. This is enabling countries like India and France to produce at larger scale and export across the globe. This in turn is rising the demand for shipbroking services for a smooth flow of cross border movement of the manufactured products.
According to the research carried out by Absolute Market Insights, maximum share of revenue for the shipbroking market is derived from chartering services segment. These services include vessel charting services and custom sea freight services across container vessels, tankers and dry cargoes. The documentation process involved in sending cargos cross borders are complex and extensive and requires thorough knowledge of the same. Due to lack of this professional knowledge in vessel owners they hire charterer for the process which in turn is rising the demand for charting services in the shipping industry. In terms of regional bifurcation Asia Pacific is contributing for the maximum share followed by Europe and North America in 2018. The growth of Asia Pacific is attributed by the presence of major players in the region like Howe Robinson Partners and Interocean Shipping Company. Both of these companies are involved in offering a wide range of shipbroking services such as marine evaluations, sales & purchase and specialized tankers amongst others. Thus, such factors are anticipated to propel the shipbroking market during the forecast period.
In terms of revenue, the shipbroking market was valued at US$ 1,237.7 Mn in 2018 and is growing at a CAGR of 2.9% over the forecast period. The study analyzes the market in terms of revenue across all the major regions, which is further bifurcated into countries.
Shipbroking Market Revenue & Forecast, (US$ Million), 2015 – 2027
Competitive Landscape
The report provides both, qualitative and quantitative research of shipbroking market, as well as provides comprehensive insights and development methods adopted by the key contenders. The report also offers extensive research on the key players in this market and details on the competitiveness of these players. Key business strategies such as mergers and acquisitions (M&A), affiliations, collaborations, and contracts adopted by these major market participants are also recognized and analyzed in the report. For each company, the report studies their global presence, competitors, service offerings and specification amongst others.
Some of the players operating in the shipbroking market are Barry Rogliano Salles International S.A, Braemar Shipping Services PLC, Bright Cook & Co (S&P) Limited, Charles R. Weber Company, Inc, CLARKSON PLC, Compass Maritime Services, LLC, E.A. Gibson Shipbrokers Ltd, Howe Robinson Partners, INTEROCEAN SHIPPING COMPANY, Maersk Broker K/S, McQuilling Partners, Inc, Poten and Partners Group, Inc, Simpson Spence Young, SPI Marine, and Velian Ship Brokers amongst others.
Shipbroking Market:
- By Services
- Charting
- Container Vessels
- Tankers
- Dry Bulk
- Sales and Purchase
- Valuations
- Recycling
- Offshore
- New buildings
- Salvage and Towage
- Charting
- By Vertical
- Oil and Gas
- Manufacturing
- Aerospace and Defense
- Government
- Others
- By Geography
- North America
- US
- Canada
- Mexico
- Rest of North America
- Europe
- France
- The UK
- Spain
- Germany
- Italy
- Nordic Countries
- Denmark
- Finland
- Iceland
- Sweden
- Norway
- Benelux Union
- Belgium
- The Netherlands
- Luxembourg
- Rest of Europe
- Asia Pacific
- China
- Japan
- India
- New Zealand
- Australia
- South Korea
- Southeast Asia
- Indonesia
- Thailand
- Malaysia
- Singapore
- Rest of Southeast Asia
- Rest of Asia Pacific
- Middle East and Africa
- Saudi Arabia
- UAE
- Egypt
- Kuwait
- South Africa
- Rest of Middle East & Africa
- Latin America
- Brazil
- Argentina
- Rest of Latin America
- North America
Table of Contents
![]()
1. Market Scope
1.1. Market
Segmentation
1.2. Years
Considered
1.2.1. Historic
Years: 2013 - 2017
1.2.2. Base
Year: 2018
1.2.3. Forecast
Years: 2019 – 2027
2. Key Target Audiences
3. Research Methodology
3.1. Primary
Research
3.1.1. Research
Questionnaire
3.1.2. Global
Percentage Breakdown
3.1.3. Primary
Interviews: Key Opinion Leaders (KOLs)
3.2. Secondary
Research
3.2.1. Paid
Databases
3.2.2. Secondary
Sources
3.3. Market
Size Estimates
3.3.1. Top-Down
Approach
3.3.2. Bottom-Up
Approach
3.4. Data
Triangulation Methodology
3.5. Research
Assumptions
4. Recommendations and Insights from AMI’s Perspective**
5. Holistic Overview of Shipbroking Market
6. Market Synopsis:
Shipbroking Market
7. Shipbroking Market Analysis: Qualitative Perspective
7.1. Introduction
7.1.1. Product
Definition
7.1.2. Industry
Development
7.2. Market
Dynamics
7.2.1. Drivers
7.2.2. Restraints
7.2.3. Opportunities
7.3. Trends in Shipbroking
Market
7.4. Market
Determinants Radar Chart
7.5. Macro-Economic
and Micro-Economic Indicators: Shipbroking Market
7.6. Porter’s
Five Force Analysis
8. Global Shipbroking Market Analysis and Forecasts, 2019 – 2027
8.1. Overview
8.1.1. Global
Shipbroking Market Revenue (US$ Mn)
8.2. Global
Shipbroking Market Revenue (US$ Mn) and Forecasts, By Services
8.2.1. Chartering
(Definition, Market Estimation and Penetration, 2013 – 2018, Market Estimation
(2013 – 2018), Market Forecast (2019 – 2027), Compound Annual Growth Rate
(CAGR), Regional Bifurcation (North America, Europe, Asia Pacific, Middle East
and Africa, Latin America) and Information on Container Vessels, Tankers , Dry
Bulk)
8.2.1.1. Container
Vessels
8.2.1.2. Tankers
8.2.1.3. Dry
Bulk
8.2.2. Sale and
Purchase (Definition, Market Estimation and Penetration, 2013 – 2018, Market
Estimation (2013 – 2018), Market Forecast (2019 – 2027), Compound Annual Growth
Rate (CAGR), Regional Bifurcation (North America, Europe, Asia Pacific, Middle
East and Africa, Latin America) and Information on Valuations, Recycling)
8.2.2.1. Valuations
8.2.2.2. Recycling
8.2.3. Offshore
8.2.3.1. Definition
8.2.3.2. Market
Estimation and Penetration, 2013 – 2018
8.2.3.3. Market
Forecast, 2019 – 2027
8.2.3.4. Compound
Annual Growth Rate (CAGR)
8.2.3.5. Regional
Bifurcation
8.2.3.5.1. North
America
8.2.3.5.1.1. Market
Estimation, 2013 – 2018
8.2.3.5.1.2. Market
Forecast, 2019 – 2027
8.2.3.5.2. Europe
8.2.3.5.2.1. Market
Estimation, 2013 – 2018
8.2.3.5.2.2. Market
Forecast, 2019 – 2027
8.2.3.5.3. Asia
Pacific
8.2.3.5.3.1. Market
Estimation, 2013 – 2018
8.2.3.5.3.2. Market
Forecast, 2019 – 2027
8.2.3.5.4. Middle
East and Africa
8.2.3.5.4.1. Market
Estimation, 2013 – 2018
8.2.3.5.4.2. Market
Forecast, 2019 – 2027
8.2.3.5.5. Latin
America
8.2.3.5.5.1. Market
Estimation, 2013 – 2018
8.2.3.5.5.2. Market
Forecast, 2019 – 2027
8.2.4. New
Buildings
8.2.4.1. Definition
8.2.4.2. Market
Estimation and Penetration, 2013 – 2018
8.2.4.3. Market
Forecast, 2019 – 2027
8.2.4.4. Compound
Annual Growth Rate (CAGR)
8.2.4.5. Regional
Bifurcation
8.2.4.5.1. North
America
8.2.4.5.1.1. Market
Estimation, 2013 – 2018
8.2.4.5.1.2. Market
Forecast, 2019 – 2027
8.2.4.5.2. Europe
8.2.4.5.2.1. Market
Estimation, 2013 – 2018
8.2.4.5.2.2. Market
Forecast, 2019 – 2027
8.2.4.5.3. Asia
Pacific
8.2.4.5.3.1. Market
Estimation, 2013 – 2018
8.2.4.5.3.2. Market
Forecast, 2019 – 2027
8.2.4.5.4. Middle
East and Africa
8.2.4.5.4.1. Market
Estimation, 2013 – 2018
8.2.4.5.4.2. Market
Forecast, 2019 – 2027
8.2.4.5.5. Latin
America
8.2.4.5.5.1. Market
Estimation, 2013 – 2018
8.2.4.5.5.2. Market
Forecast, 2019 – 2027
8.2.5. Salvage
and Towage
8.2.5.1. Definition
8.2.5.2. Market
Estimation and Penetration, 2013 – 2018
8.2.5.3. Market
Forecast, 2019 – 2027
8.2.5.4. Compound
Annual Growth Rate (CAGR)
8.2.5.5. Regional
Bifurcation
8.2.5.5.1. North
America
8.2.5.5.1.1. Market
Estimation, 2013 – 2018
8.2.5.5.1.2. Market
Forecast, 2019 – 2027
8.2.5.5.2. Europe
8.2.5.5.2.1. Market
Estimation, 2013 – 2018
8.2.5.5.2.2. Market
Forecast, 2019 – 2027
8.2.5.5.3. Asia
Pacific
8.2.5.5.3.1. Market
Estimation, 2013 – 2018
8.2.5.5.3.2. Market
Forecast, 2019 – 2027
8.2.5.5.4. Middle
East and Africa
8.2.5.5.4.1. Market
Estimation, 2013 – 2018
8.2.5.5.4.2. Market
Forecast, 2019 – 2027
8.2.5.5.5. Latin
America
8.2.5.5.5.1. Market
Estimation, 2013 – 2018
8.2.5.5.5.2. Market
Forecast, 2019 – 2027
8.3. Key
Segment for Channeling Investments
8.3.1. By
Services
9. Global Shipbroking Market Analysis and Forecasts, 2019 – 2027
9.1. Overview
9.2. Global
Shipbroking Market Revenue (US$ Mn) and Forecasts, By Vertical Analysis
9.2.1. Oil and
Gas
9.2.1.1. Definition
9.2.1.2. Market
Estimation and Penetration, 2013 – 2018
9.2.1.3. Market
Forecast, 2019 – 2027
9.2.1.4. Compound
Annual Growth Rate (CAGR)
9.2.1.5. Regional
Bifurcation
9.2.1.5.1. North
America
9.2.1.5.1.1. Market
Estimation, 2013 – 2018
9.2.1.5.1.2. Market
Forecast, 2019 – 2027
9.2.1.5.2. Europe
9.2.1.5.2.1. Market
Estimation, 2013 – 2018
9.2.1.5.2.2. Market
Forecast, 2019 – 2027
9.2.1.5.3. Asia
Pacific
9.2.1.5.3.1. Market
Estimation, 2013 – 2018
9.2.1.5.3.2. Market
Forecast, 2019 – 2027
9.2.1.5.4. Middle
East and Africa
9.2.1.5.4.1. Market
Estimation, 2013 – 2018
9.2.1.5.4.2. Market
Forecast, 2019 – 2027
9.2.1.5.5. Latin
America
9.2.1.5.5.1. Market
Estimation, 2013 – 2018
9.2.1.5.5.2. Market
Forecast, 2019 – 2027
9.2.2. Manufacturing
9.2.2.1. Definition
9.2.2.2. Market
Estimation and Penetration, 2013 – 2018
9.2.2.3. Market
Forecast, 2019 – 2027
9.2.2.4. Compound
Annual Growth Rate (CAGR)
9.2.2.5. Regional
Bifurcation
9.2.2.5.1. North
America
9.2.2.5.1.1. Market
Estimation, 2013 – 2018
9.2.2.5.1.2. Market
Forecast, 2019 – 2027
9.2.2.5.2. Europe
9.2.2.5.2.1. Market
Estimation, 2013 – 2018
9.2.2.5.2.2. Market
Forecast, 2019 – 2027
9.2.2.5.3. Asia
Pacific
9.2.2.5.3.1. Market
Estimation, 2013 – 2018
9.2.2.5.3.2. Market
Forecast, 2019 – 2027
9.2.2.5.4. Middle
East and Africa
9.2.2.5.4.1. Market
Estimation, 2013 – 2018
9.2.2.5.4.2. Market
Forecast, 2019 – 2027
9.2.2.5.5. Latin
America
9.2.2.5.5.1. Market
Estimation, 2013 – 2018
9.2.2.5.5.2. Market
Forecast, 2019 – 2027
9.2.3. Aerospace
and Defense
9.2.3.1. Definition
9.2.3.2. Market
Estimation and Penetration, 2013 – 2018
9.2.3.3. Market
Forecast, 2019 – 2027
9.2.3.4. Compound
Annual Growth Rate (CAGR)
9.2.3.5. Regional
Bifurcation
9.2.3.5.1. North
America
9.2.3.5.1.1. Market
Estimation, 2013 – 2018
9.2.3.5.1.2. Market
Forecast, 2019 – 2027
9.2.3.5.2. Europe
9.2.3.5.2.1. Market
Estimation, 2013 – 2018
9.2.3.5.2.2. Market
Forecast, 2019 – 2027
9.2.3.5.3. Asia
Pacific
9.2.3.5.3.1. Market
Estimation, 2013 – 2018
9.2.3.5.3.2. Market
Forecast, 2019 – 2027
9.2.3.5.4. Middle
East and Africa
9.2.3.5.4.1. Market
Estimation, 2013 – 2018
9.2.3.5.4.2. Market
Forecast, 2019 – 2027
9.2.3.5.5. Latin
America
9.2.3.5.5.1. Market
Estimation, 2013 – 2018
9.2.3.5.5.2. Market
Forecast, 2019 – 2027
9.2.4. Government
9.2.4.1. Definition
9.2.4.2. Market
Estimation and Penetration, 2013 – 2018
9.2.4.3. Market
Forecast, 2019 – 2027
9.2.4.4. Compound
Annual Growth Rate (CAGR)
9.2.4.5. Regional
Bifurcation
9.2.4.5.1. North
America
9.2.4.5.1.1. Market
Estimation, 2013 – 2018
9.2.4.5.1.2. Market
Forecast, 2019 – 2027
9.2.4.5.2. Europe
9.2.4.5.2.1. Market
Estimation, 2013 – 2018
9.2.4.5.2.2. Market
Forecast, 2019 – 2027
9.2.4.5.3. Asia
Pacific
9.2.4.5.3.1. Market
Estimation, 2013 – 2018
9.2.4.5.3.2. Market
Forecast, 2019 – 2027
9.2.4.5.4. Middle
East and Africa
9.2.4.5.4.1. Market
Estimation, 2013 – 2018
9.2.4.5.4.2. Market
Forecast, 2019 – 2027
9.2.4.5.5. Latin
America
9.2.4.5.5.1. Market
Estimation, 2013 – 2018
9.2.4.5.5.2. Market
Forecast, 2019 – 2027
9.2.5. Others
9.2.5.1. Definition
9.2.5.2. Market
Estimation and Penetration, 2013 – 2018
9.2.5.3. Market
Forecast, 2019 – 2027
9.2.5.4. Compound
Annual Growth Rate (CAGR)
9.2.5.5. Regional
Bifurcation
9.2.5.5.1. North
America
9.2.5.5.1.1. Market
Estimation, 2013 – 2018
9.2.5.5.1.2. Market
Forecast, 2019 – 2027
9.2.5.5.2. Europe
9.2.5.5.2.1. Market
Estimation, 2013 – 2018
9.2.5.5.2.2. Market
Forecast, 2019 – 2027
9.2.5.5.3. Asia
Pacific
9.2.5.5.3.1. Market
Estimation, 2013 – 2018
9.2.5.5.3.2. Market
Forecast, 2019 – 2027
9.2.5.5.4. Middle
East and Africa
9.2.5.5.4.1. Market
Estimation, 2013 – 2018
9.2.5.5.4.2. Market
Forecast, 2019 – 2027
9.2.5.5.5. Latin
America
9.2.5.5.5.1. Market
Estimation, 2013 – 2018
9.2.5.5.5.2. Market
Forecast, 2019 – 2027
9.3. Key
Segment for Channeling Investments
9.3.1. By
Vertical Analysis
10. North America Shipbroking Market Analysis and Forecasts, 2019
- 2027
10.1. Overview
10.1.1. North
America Shipbroking Market Revenue (US$ Mn)
10.2. North
America Shipbroking Market Revenue (US$ Mn) and Forecasts, By Services
10.2.1. Chartering
10.2.1.1. Container
Vessels
10.2.1.2. Tankers
10.2.1.3. Dry
Bulk
10.2.2. Sale
and Purchase
10.2.2.1. Valuations
10.2.2.2. Recycling
10.2.3. Offshore
10.2.4. New
Buildings
10.2.5. Salvage
and Towage
10.3. North
America Shipbroking Market Revenue (US$ Mn) and Forecasts, By Vertical Analysis
10.3.1. Oil and
Gas
10.3.2. Manufacturing
10.3.3. Aerospace
and Defense
10.3.4. Government
10.3.5. Others
10.4. North
America Shipbroking Market Revenue (US$ Mn) and Forecasts, By Country
10.4.1. U.S
10.4.1.1. U.S
Shipbroking Market Revenue (US$ Mn) and Forecasts, By Services
10.4.1.1.1. Chartering
10.4.1.1.1.1. Container
Vessels
10.4.1.1.1.2. Tankers
10.4.1.1.1.3. Dry
Bulk
10.4.1.1.2. Sale
and Purchase
10.4.1.1.2.1. Valuations
10.4.1.1.2.2. Recycling
10.4.1.1.3. Offshore
10.4.1.1.4. New
Buildings
10.4.1.1.5. Salvage
and Towage
10.4.1.2. U.S
Shipbroking Market Revenue (US$ Mn) and Forecasts, By Vertical Analysis
10.4.1.2.1. Oil
and Gas
10.4.1.2.2. Manufacturing
10.4.1.2.3. Aerospace
and Defense
10.4.1.2.4. Government
10.4.1.2.5. Others
10.4.2. Canada
10.4.2.1. Canada
Shipbroking Market Revenue (US$ Mn) and Forecasts, By Services
10.4.2.1.1. Chartering
10.4.2.1.1.1. Container
Vessels
10.4.2.1.1.2. Tankers
10.4.2.1.1.3. Dry
Bulk
10.4.2.1.2. Sale
and Purchase
10.4.2.1.2.1. Valuations
10.4.2.1.2.2. Recycling
10.4.2.1.3. Offshore
10.4.2.1.4. New
Buildings
10.4.2.1.5. Salvage
and Towage
10.4.2.2. Canada
Shipbroking Market Revenue (US$ Mn) and Forecasts, By Vertical Analysis
10.4.2.2.1. Oil
and Gas
10.4.2.2.2. Manufacturing
10.4.2.2.3. Aerospace
and Defense
10.4.2.2.4. Government
10.4.2.2.5. Others
10.4.3. Mexico
10.4.3.1. Mexico
Shipbroking Market Revenue (US$ Mn) and Forecasts, By Services
10.4.3.1.1. Chartering
10.4.3.1.1.1. Container
Vessels
10.4.3.1.1.2. Tankers
10.4.3.1.1.3. Dry
Bulk
10.4.3.1.2. Sale
and Purchase
10.4.3.1.2.1. Valuations
10.4.3.1.2.2. Recycling
10.4.3.1.3. Offshore
10.4.3.1.4. New
Buildings
10.4.3.1.5. Salvage
and Towage
10.4.3.2. Mexico
Shipbroking Market Revenue (US$ Mn) and Forecasts, By Vertical Analysis
10.4.3.2.1. Oil
and Gas
10.4.3.2.2. Manufacturing
10.4.3.2.3. Aerospace
and Defense
10.4.3.2.4. Government
10.4.3.2.5. Others
10.4.4. Rest of
North America
10.4.4.1. Rest
of North America Shipbroking Market Revenue (US$ Mn) and Forecasts, By Services
10.4.4.1.1. Chartering
10.4.4.1.1.1. Container
Vessels
10.4.4.1.1.2. Tankers
10.4.4.1.1.3. Dry
Bulk
10.4.4.1.2. Sale
and Purchase
10.4.4.1.2.1. Valuations
10.4.4.1.2.2. Recycling
10.4.4.1.3. Offshore
10.4.4.1.4. New
Buildings
10.4.4.1.5. Salvage
and Towage
10.4.4.2. Rest
of North America Shipbroking Market Revenue (US$ Mn) and Forecasts, By Vertical
Analysis
10.4.4.2.1. Oil
and Gas
10.4.4.2.2. Manufacturing
10.4.4.2.3. Aerospace
and Defense
10.4.4.2.4. Government
10.4.4.2.5. Others
10.5. Key
Segment for Channeling Investments
10.5.1. By
Country
10.5.2. By
Services
10.5.3. By
Vertical Analysis
11. Europe Shipbroking Market Analysis and Forecasts, 2019 - 2027
11.1. Overview
11.1.1. Europe
Shipbroking Market Revenue (US$ Mn)
11.2. Europe
Shipbroking Market Revenue (US$ Mn) and Forecasts, By Services
11.2.1. Chartering
11.2.1.1. Container
Vessels
11.2.1.2. Tankers
11.2.1.3. Dry
Bulk
11.2.2. Sale
and Purchase
11.2.2.1. Valuations
11.2.2.2. Recycling
11.2.3. Offshore
11.2.4. New
Buildings
11.2.5. Salvage
and Towage
11.3. Europe
Shipbroking Market Revenue (US$ Mn) and Forecasts, By Vertical Analysis
11.3.1. Oil and
Gas
11.3.2. Manufacturing
11.3.3. Aerospace
and Defense
11.3.4. Government
11.3.5. Others
11.4. Europe
Shipbroking Market Revenue (US$ Mn) and Forecasts, By Country
11.4.1. France
11.4.1.1. France
Shipbroking Market Revenue (US$ Mn) and Forecasts, By Services
11.4.1.1.1. Chartering
11.4.1.1.1.1. Container
Vessels
11.4.1.1.1.2. Tankers
11.4.1.1.1.3. Dry
Bulk
11.4.1.1.2. Sale
and Purchase
11.4.1.1.2.1. Valuations
11.4.1.1.2.2. Recycling
11.4.1.1.3. Offshore
11.4.1.1.4. New
Buildings
11.4.1.1.5. Salvage
and Towage
11.4.1.2. France
Shipbroking Market Revenue (US$ Mn) and Forecasts, By Vertical Analysis
11.4.1.2.1. Oil
and Gas
11.4.1.2.2. Manufacturing
11.4.1.2.3. Aerospace
and Defense
11.4.1.2.4. Government
11.4.1.2.5. Others
11.4.2. The UK
11.4.2.1. The
UK Shipbroking Market Revenue (US$ Mn) and Forecasts, By Services
11.4.2.1.1. Chartering
11.4.2.1.1.1. Container
Vessels
11.4.2.1.1.2. Tankers
11.4.2.1.1.3. Dry
Bulk
11.4.2.1.2. Sale
and Purchase
11.4.2.1.2.1. Valuations
11.4.2.1.2.2. Recycling
11.4.2.1.3. Offshore
11.4.2.1.4. New
Buildings
11.4.2.1.5. Salvage
and Towage
11.4.2.2. The
UK Shipbroking Market Revenue (US$ Mn) and Forecasts, By Vertical Analysis
11.4.2.2.1. Oil
and Gas
11.4.2.2.2. Manufacturing
11.4.2.2.3. Aerospace
and Defense
11.4.2.2.4. Government
11.4.2.2.5. Others
11.4.3. Spain
11.4.3.1. Spain
Shipbroking Market Revenue (US$ Mn) and Forecasts, By Services
11.4.3.1.1. Chartering
11.4.3.1.1.1. Container
Vessels
11.4.3.1.1.2. Tankers
11.4.3.1.1.3. Dry
Bulk
11.4.3.1.2. Sale
and Purchase
11.4.3.1.2.1. Valuations
11.4.3.1.2.2. Recycling
11.4.3.1.3. Offshore
11.4.3.1.4. New
Buildings
11.4.3.1.5. Salvage
and Towage
11.4.3.2. Spain
Shipbroking Market Revenue (US$ Mn) and Forecasts, By Vertical Analysis
11.4.3.2.1. Oil
and Gas
11.4.3.2.2. Manufacturing
11.4.3.2.3. Aerospace
and Defense
11.4.3.2.4. Government
11.4.3.2.5. Others
11.4.4. Germany
11.4.4.1. Germany
Shipbroking Market Revenue (US$ Mn) and Forecasts, By Services
11.4.4.1.1. Chartering
11.4.4.1.1.1. Container
Vessels
11.4.4.1.1.2. Tankers
11.4.4.1.1.3. Dry
Bulk
11.4.4.1.2. Sale
and Purchase
11.4.4.1.2.1. Valuations
11.4.4.1.2.2. Recycling
11.4.4.1.3. Offshore
11.4.4.1.4. New
Buildings
11.4.4.1.5. Salvage
and Towage
11.4.4.2. Germany
Shipbroking Market Revenue (US$ Mn) and Forecasts, By Vertical Analysis
11.4.4.2.1. Oil
and Gas
11.4.4.2.2. Manufacturing
11.4.4.2.3. Aerospace
and Defense
11.4.4.2.4. Government
11.4.4.2.5. Others
11.4.5. Italy
11.4.5.1. Italy
Shipbroking Market Revenue (US$ Mn) and Forecasts, By Services
11.4.5.1.1. Chartering
11.4.5.1.1.1. Container
Vessels
11.4.5.1.1.2. Tankers
11.4.5.1.1.3. Dry
Bulk
11.4.5.1.2. Sale
and Purchase
11.4.5.1.2.1. Valuations
11.4.5.1.2.2. Recycling
11.4.5.1.3. Offshore
11.4.5.1.4. New
Buildings
11.4.5.1.5. Salvage
and Towage
11.4.5.2. Italy
Shipbroking Market Revenue (US$ Mn) and Forecasts, By Vertical Analysis
11.4.5.2.1. Oil
and Gas
11.4.5.2.2. Manufacturing
11.4.5.2.3. Aerospace
and Defense
11.4.5.2.4. Government
11.4.5.2.5. Others
11.4.6. Nordic
Countries
11.4.6.1. Nordic
Countries Shipbroking Market Revenue (US$ Mn) and Forecasts, By Services
11.4.6.1.1. Chartering
11.4.6.1.1.1. Container
Vessels
11.4.6.1.1.2. Tankers
11.4.6.1.1.3. Dry
Bulk
11.4.6.1.2. Sale
and Purchase
11.4.6.1.2.1. Valuations
11.4.6.1.2.2. Recycling
11.4.6.1.3. Offshore
11.4.6.1.4. New
Buildings
11.4.6.1.5. Salvage
and Towage
11.4.6.2. Nordic
Countries Shipbroking Market Revenue (US$ Mn) and Forecasts, By Vertical
Analysis
11.4.6.2.1. Oil
and Gas
11.4.6.2.2. Manufacturing
11.4.6.2.3. Aerospace
and Defense
11.4.6.2.4. Government
11.4.6.2.5. Others
11.4.6.3. Nordic
Countries Shipbroking Market Revenue (US$ Mn) and Forecasts, By Country
11.4.6.3.1. Denmark
11.4.6.3.2. Finland
11.4.6.3.3. Iceland
11.4.6.3.4. Sweden
11.4.6.3.5. Norway
11.4.7. Benelux
Union
11.4.7.1. Benelux
Union Shipbroking Market Revenue (US$ Mn) and Forecasts, By Services
11.4.7.1.1. Chartering
11.4.7.1.1.1. Container
Vessels
11.4.7.1.1.2. Tankers
11.4.7.1.1.3. Dry
Bulk
11.4.7.1.2. Sale
and Purchase
11.4.7.1.2.1. Valuations
11.4.7.1.2.2. Recycling
11.4.7.1.3. Offshore
11.4.7.1.4. New
Buildings
11.4.7.1.5. Salvage
and Towage
11.4.7.2. Benelux
Union Shipbroking Market Revenue (US$ Mn) and Forecasts, By Vertical Analysis
11.4.7.2.1. Oil
and Gas
11.4.7.2.2. Manufacturing
11.4.7.2.3. Aerospace
and Defense
11.4.7.2.4. Government
11.4.7.2.5. Others
11.4.7.3. Benelux
Union Shipbroking Market Revenue (US$ Mn) and Forecasts, By Country
11.4.7.3.1. Belgium
11.4.7.3.2. The
Netherlands
11.4.7.3.3. Luxembourg
11.4.8. Rest of
Europe
11.4.8.1. Rest
of Europe Shipbroking Market Revenue (US$ Mn) and Forecasts, By Services
11.4.8.1.1. Chartering
11.4.8.1.1.1. Container
Vessels
11.4.8.1.1.2. Tankers
11.4.8.1.1.3. Dry
Bulk
11.4.8.1.2. Sale
and Purchase
11.4.8.1.2.1. Valuations
11.4.8.1.2.2. Recycling
11.4.8.1.3. Offshore
11.4.8.1.4. New
Buildings
11.4.8.1.5. Salvage
and Towage
11.4.8.2. Rest
of Europe Shipbroking Market Revenue (US$ Mn) and Forecasts, By Vertical
Analysis
11.4.8.2.1. Oil
and Gas
11.4.8.2.2. Manufacturing
11.4.8.2.3. Aerospace
and Defense
11.4.8.2.4. Government
11.4.8.2.5. Others
11.5. Key
Segment for Channeling Investments
11.5.1. By
Country
11.5.2. By Services
11.5.3. By
Vertical Analysis
12. Asia Pacific Shipbroking Market Analysis and Forecasts, 2019
- 2027
12.1. Overview
12.1.1. Asia
Pacific Shipbroking Market Revenue (US$ Mn)
12.2. Asia
Pacific Shipbroking Market Revenue (US$ Mn) and Forecasts, By Services
12.2.1. Chartering
12.2.1.1. Container
Vessels
12.2.1.2. Tankers
12.2.1.3. Dry
Bulk
12.2.2. Sale
and Purchase
12.2.2.1. Valuations
12.2.2.2. Recycling
12.2.3. Offshore
12.2.4. New
Buildings
12.2.5. Salvage
and Towage
12.3. Asia
Pacific Shipbroking Market Revenue (US$ Mn) and Forecasts, By Vertical Analysis
12.3.1. Oil and
Gas
12.3.2. Manufacturing
12.3.3. Aerospace
and Defense
12.3.4. Government
12.3.5. Others
12.4. Asia
Pacific Shipbroking Market Revenue (US$ Mn) and Forecasts, By Country
12.4.1. China
12.4.1.1. China
Shipbroking Market Revenue (US$ Mn) and Forecasts, By Services
12.4.1.1.1. Chartering
12.4.1.1.1.1. Container
Vessels
12.4.1.1.1.2. Tankers
12.4.1.1.1.3. Dry
Bulk
12.4.1.1.2. Sale
and Purchase
12.4.1.1.2.1. Valuations
12.4.1.1.2.2. Recycling
12.4.1.1.3. Offshore
12.4.1.1.4. New
Buildings
12.4.1.1.5. Salvage
and Towage
12.4.1.2. China
Shipbroking Market Revenue (US$ Mn) and Forecasts, By Vertical Analysis
12.4.1.2.1. Oil
and Gas
12.4.1.2.2. Manufacturing
12.4.1.2.3. Aerospace
and Defense
12.4.1.2.4. Government
12.4.1.2.5. Others
12.4.2. Japan
12.4.2.1. Japan
Shipbroking Market Revenue (US$ Mn) and Forecasts, By Services
12.4.2.1.1. Chartering
12.4.2.1.1.1. Container
Vessels
12.4.2.1.1.2. Tankers
12.4.2.1.1.3. Dry
Bulk
12.4.2.1.2. Sale
and Purchase
12.4.2.1.2.1. Valuations
12.4.2.1.2.2. Recycling
12.4.2.1.3. Offshore
12.4.2.1.4. New
Buildings
12.4.2.1.5. Salvage
and Towage
12.4.2.2. Japan
Shipbroking Market Revenue (US$ Mn) and Forecasts, By Vertical Analysis
12.4.2.2.1. Oil
and Gas
12.4.2.2.2. Manufacturing
12.4.2.2.3. Aerospace
and Defense
12.4.2.2.4. Government
12.4.2.2.5. Others
12.4.3. India
12.4.3.1. India
Shipbroking Market Revenue (US$ Mn) and Forecasts, By Services
12.4.3.1.1. Chartering
12.4.3.1.1.1. Container
Vessels
12.4.3.1.1.2. Tankers
12.4.3.1.1.3. Dry
Bulk
12.4.3.1.2. Sale
and Purchase
12.4.3.1.2.1. Valuations
12.4.3.1.2.2. Recycling
12.4.3.1.3. Offshore
12.4.3.1.4. New
Buildings
12.4.3.1.5. Salvage
and Towage
12.4.3.2. India
Shipbroking Market Revenue (US$ Mn) and Forecasts, By Vertical Analysis
12.4.3.2.1. Oil
and Gas
12.4.3.2.2. Manufacturing
12.4.3.2.3. Aerospace
and Defense
12.4.3.2.4. Government
12.4.3.2.5. Others
12.4.4. New
Zealand
12.4.4.1. New
Zealand Shipbroking Market Revenue (US$ Mn) and Forecasts, By Services
12.4.4.1.1. Chartering
12.4.4.1.1.1. Container
Vessels
12.4.4.1.1.2. Tankers
12.4.4.1.1.3. Dry
Bulk
12.4.4.1.2. Sale
and Purchase
12.4.4.1.2.1. Valuations
12.4.4.1.2.2. Recycling
12.4.4.1.3. Offshore
12.4.4.1.4. New
Buildings
12.4.4.1.5. Salvage
and Towage
12.4.4.2. New
Zealand Shipbroking Market Revenue (US$ Mn) and Forecasts, By Vertical Analysis
12.4.4.2.1. Oil
and Gas
12.4.4.2.2. Manufacturing
12.4.4.2.3. Aerospace
and Defense
12.4.4.2.4. Government
12.4.4.2.5. Others
12.4.5. Australia
12.4.5.1. Australia
Shipbroking Market Revenue (US$ Mn) and Forecasts, By Services
12.4.5.1.1. Chartering
12.4.5.1.1.1. Container
Vessels
12.4.5.1.1.2. Tankers
12.4.5.1.1.3. Dry
Bulk
12.4.5.1.2. Sale
and Purchase
12.4.5.1.2.1. Valuations
12.4.5.1.2.2. Recycling
12.4.5.1.3. Offshore
12.4.5.1.4. New
Buildings
12.4.5.1.5. Salvage
and Towage
12.4.5.2. Australia
Shipbroking Market Revenue (US$ Mn) and Forecasts, By Vertical Analysis
12.4.5.2.1. Oil
and Gas
12.4.5.2.2. Manufacturing
12.4.5.2.3. Aerospace
and Defense
12.4.5.2.4. Government
12.4.5.2.5. Others
12.4.6. South
Korea
12.4.6.1. South
Korea Shipbroking Market Revenue (US$ Mn) and Forecasts, By Services
12.4.6.1.1. Chartering
12.4.6.1.1.1. Container
Vessels
12.4.6.1.1.2. Tankers
12.4.6.1.1.3. Dry
Bulk
12.4.6.1.2. Sale
and Purchase
12.4.6.1.2.1. Valuations
12.4.6.1.2.2. Recycling
12.4.6.1.3. Offshore
12.4.6.1.4. New
Buildings
12.4.6.1.5. Salvage
and Towage
12.4.6.2. South
Korea Shipbroking Market Revenue (US$ Mn) and Forecasts, By Vertical Analysis
12.4.6.2.1. Oil
and Gas
12.4.6.2.2. Manufacturing
12.4.6.2.3. Aerospace
and Defense
12.4.6.2.4. Government
12.4.6.2.5. Others
12.4.7. Southeast
Asia
12.4.7.1. Southeast
Asia Shipbroking Market Revenue (US$ Mn) and Forecasts, By Services
12.4.7.1.1. Chartering
12.4.7.1.1.1. Container
Vessels
12.4.7.1.1.2. Tankers
12.4.7.1.1.3. Dry
Bulk
12.4.7.1.2. Sale
and Purchase
12.4.7.1.2.1. Valuations
12.4.7.1.2.2. Recycling
12.4.7.1.3. Offshore
12.4.7.1.4. New
Buildings
12.4.7.1.5. Salvage
and Towage
12.4.7.2. Southeast
Asia Shipbroking Market Revenue (US$ Mn) and Forecasts, By Vertical Analysis
12.4.7.2.1. Oil
and Gas
12.4.7.2.2. Manufacturing
12.4.7.2.3. Aerospace
and Defense
12.4.7.2.4. Government
12.4.7.2.5. Others
12.4.7.3. Southeast
Asia Shipbroking Market Revenue (US$ Mn) and Forecasts, By Country
12.4.7.3.1. Indonesia
12.4.7.3.2. Thailand
12.4.7.3.3. Malaysia
12.4.7.3.4. Singapore
12.4.7.3.5. Rest
of Southeast Asia
12.4.8. Rest of
Asia Pacific
12.4.8.1. Rest
of Asia Pacific Shipbroking Market Revenue (US$ Mn) and Forecasts, By Services
12.4.8.1.1. Chartering
12.4.8.1.1.1. Container
Vessels
12.4.8.1.1.2. Tankers
12.4.8.1.1.3. Dry
Bulk
12.4.8.1.2. Sale
and Purchase
12.4.8.1.2.1. Valuations
12.4.8.1.2.2. Recycling
12.4.8.1.3. Offshore
12.4.8.1.4. New
Buildings
12.4.8.1.5. Salvage
and Towage
12.4.8.2. Rest
of Asia Pacific Shipbroking Market Revenue (US$ Mn) and Forecasts, By Vertical
Analysis
12.4.8.2.1. Oil
and Gas
12.4.8.2.2. Manufacturing
12.4.8.2.3. Aerospace
and Defense
12.4.8.2.4. Government
12.4.8.2.5. Others
12.5. Key
Segment for Channeling Investments
12.5.1. By
Country
12.5.2. By
Services
12.5.3. By
Vertical Analysis
13. Middle East and Africa Shipbroking Market Analysis and
Forecasts, 2019 - 2027
13.1. Overview
13.1.1. Middle
East and Africa Shipbroking Market Revenue (US$ Mn)
13.2. Middle
East and Africa Shipbroking Market Revenue (US$ Mn) and Forecasts, By Services
13.2.1. Chartering
13.2.1.1. Container
Vessels
13.2.1.2. Tankers
13.2.1.3. Dry
Bulk
13.2.2. Sale
and Purchase
13.2.2.1. Valuations
13.2.2.2. Recycling
13.2.3. Offshore
13.2.4. New
Buildings
13.2.5. Salvage
and Towage
13.3. Middle
East and Africa Shipbroking Market Revenue (US$ Mn) and Forecasts, By Vertical
Analysis
13.3.1. Oil and
Gas
13.3.2. Manufacturing
13.3.3. Aerospace
and Defense
13.3.4. Government
13.3.5. Others
13.4. Middle
East and Africa Shipbroking Market Revenue (US$ Mn) and Forecasts, By Country
13.4.1. Saudi
Arabia
13.4.1.1. Saudi
Arabia Shipbroking Market Revenue (US$ Mn) and Forecasts, By Services
13.4.1.1.1. Chartering
13.4.1.1.1.1. Container
Vessels
13.4.1.1.1.2. Tankers
13.4.1.1.1.3. Dry
Bulk
13.4.1.1.2. Sale
and Purchase
13.4.1.1.2.1. Valuations
13.4.1.1.2.2. Recycling
13.4.1.1.3. Offshore
13.4.1.1.4. New
Buildings
13.4.1.1.5. Salvage
and Towage
13.4.1.2. Saudi
Arabia Shipbroking Market Revenue (US$ Mn) and Forecasts, By Vertical Analysis
13.4.1.2.1. Oil
and Gas
13.4.1.2.2. Manufacturing
13.4.1.2.3. Aerospace
and Defense
13.4.1.2.4. Government
13.4.1.2.5. Others
13.4.2. UAE
13.4.2.1. UAE
Shipbroking Market Revenue (US$ Mn) and Forecasts, By Services
13.4.2.1.1. Chartering
13.4.2.1.1.1. Container
Vessels
13.4.2.1.1.2. Tankers
13.4.2.1.1.3. Dry
Bulk
13.4.2.1.2. Sale
and Purchase
13.4.2.1.2.1. Valuations
13.4.2.1.2.2. Recycling
13.4.2.1.3. Offshore
13.4.2.1.4. New
Buildings
13.4.2.1.5. Salvage
and Towage
13.4.2.2. UAE
Shipbroking Market Revenue (US$ Mn) and Forecasts, By Vertical Analysis
13.4.2.2.1. Oil
and Gas
13.4.2.2.2. Manufacturing
13.4.2.2.3. Aerospace
and Defense
13.4.2.2.4. Government
13.4.2.2.5. Others
13.4.3. Egypt
13.4.3.1. Egypt
Shipbroking Market Revenue (US$ Mn) and Forecasts, By Services
13.4.3.1.1. Chartering
13.4.3.1.1.1. Container
Vessels
13.4.3.1.1.2. Tankers
13.4.3.1.1.3. Dry
Bulk
13.4.3.1.2. Sale
and Purchase
13.4.3.1.2.1. Valuations
13.4.3.1.2.2. Recycling
13.4.3.1.3. Offshore
13.4.3.1.4. New
Buildings
13.4.3.1.5. Salvage
and Towage
13.4.3.2. Egypt
Shipbroking Market Revenue (US$ Mn) and Forecasts, By Vertical Analysis
13.4.3.2.1. Oil
and Gas
13.4.3.2.2. Manufacturing
13.4.3.2.3. Aerospace
and Defense
13.4.3.2.4. Government
13.4.3.2.5. Others
13.4.4. Kuwait
13.4.4.1. Kuwait
Shipbroking Market Revenue (US$ Mn) and Forecasts, By Services
13.4.4.1.1. Chartering
13.4.4.1.1.1. Container
Vessels
13.4.4.1.1.2. Tankers
13.4.4.1.1.3. Dry
Bulk
13.4.4.1.2. Sale
and Purchase
13.4.4.1.2.1. Valuations
13.4.4.1.2.2. Recycling
13.4.4.1.3. Offshore
13.4.4.1.4. New
Buildings
13.4.4.1.5. Salvage
and Towage
13.4.4.2. Kuwait
Shipbroking Market Revenue (US$ Mn) and Forecasts, By Vertical Analysis
13.4.4.2.1. Oil
and Gas
13.4.4.2.2. Manufacturing
13.4.4.2.3. Aerospace
and Defense
13.4.4.2.4. Government
13.4.4.2.5. Others
13.4.5. South
Africa
13.4.5.1. South
Africa Shipbroking Market Revenue (US$ Mn) and Forecasts, By Services
13.4.5.1.1. Chartering
13.4.5.1.1.1. Container
Vessels
13.4.5.1.1.2. Tankers
13.4.5.1.1.3. Dry
Bulk
13.4.5.1.2. Sale
and Purchase
13.4.5.1.2.1. Valuations
13.4.5.1.2.2. Recycling
13.4.5.1.3. Offshore
13.4.5.1.4. New
Buildings
13.4.5.1.5. Salvage
and Towage
13.4.5.2. South
Africa Shipbroking Market Revenue (US$ Mn) and Forecasts, By Vertical Analysis
13.4.5.2.1. Oil
and Gas
13.4.5.2.2. Manufacturing
13.4.5.2.3. Aerospace
and Defense
13.4.5.2.4. Government
13.4.5.2.5. Others
13.4.6. Rest of
Middle East & Africa
13.4.6.1. Rest
of Middle East & Africa Shipbroking Market Revenue (US$ Mn) and Forecasts,
By Services
13.4.6.1.1. Chartering
13.4.6.1.1.1. Container
Vessels
13.4.6.1.1.2. Tankers
13.4.6.1.1.3. Dry
Bulk
13.4.6.1.2. Sale
and Purchase
13.4.6.1.2.1. Valuations
13.4.6.1.2.2. Recycling
13.4.6.1.3. Offshore
13.4.6.1.4. New
Buildings
13.4.6.1.5. Salvage
and Towage
13.4.6.2. Rest
of Middle East & Africa Shipbroking Market Revenue (US$ Mn) and Forecasts,
By Vertical Analysis
13.4.6.2.1. Oil
and Gas
13.4.6.2.2. Manufacturing
13.4.6.2.3. Aerospace
and Defense
13.4.6.2.4. Government
13.4.6.2.5. Others
13.5. Key
Segment for Channeling Investments
13.5.1. By
Country
13.5.2. By
Services
13.5.3. By
Vertical Analysis
14. Latin America Shipbroking Market Analysis and Forecasts, 2019
- 2027
14.1. Overview
14.1.1. Latin
America Shipbroking Market Revenue (US$ Mn)
14.2. Latin
America Shipbroking Market Revenue (US$ Mn) and Forecasts, By Services
14.2.1. Chartering
14.2.1.1. Container
Vessels
14.2.1.2. Tankers
14.2.1.3. Dry
Bulk
14.2.2. Sale
and Purchase
14.2.2.1. Valuations
14.2.2.2. Recycling
14.2.3. Offshore
14.2.4. New
Buildings
14.2.5. Salvage
and Towage
14.3. Latin
America Shipbroking Market Revenue (US$ Mn) and Forecasts, By Vertical Analysis
14.3.1. Oil and
Gas
14.3.2. Manufacturing
14.3.3. Aerospace
and Defense
14.3.4. Government
14.3.5. Others
14.4. Latin
America Shipbroking Market Revenue (US$ Mn) and Forecasts, By Country
14.4.1. Brazil
14.4.1.1. Brazil
Shipbroking Market Revenue (US$ Mn) and Forecasts, By Services
14.4.1.1.1. Chartering
14.4.1.1.1.1. Container
Vessels
14.4.1.1.1.2. Tankers
14.4.1.1.1.3. Dry
Bulk
14.4.1.1.2. Sale
and Purchase
14.4.1.1.2.1. Valuations
14.4.1.1.2.2. Recycling
14.4.1.1.3. Offshore
14.4.1.1.4. New
Buildings
14.4.1.1.5. Salvage
and Towage
14.4.1.2. Brazil
Shipbroking Market Revenue (US$ Mn) and Forecasts, By Vertical Analysis
14.4.1.2.1. Oil
and Gas
14.4.1.2.2. Manufacturing
14.4.1.2.3. Aerospace
and Defense
14.4.1.2.4. Government
14.4.1.2.5. Others
14.4.2. Argentina
14.4.2.1. Argentina
Shipbroking Market Revenue (US$ Mn) and Forecasts, By Services
14.4.2.1.1. Chartering
14.4.2.1.1.1. Container
Vessels
14.4.2.1.1.2. Tankers
14.4.2.1.1.3. Dry
Bulk
14.4.2.1.2. Sale
and Purchase
14.4.2.1.2.1. Valuations
14.4.2.1.2.2. Recycling
14.4.2.1.3. Offshore
14.4.2.1.4. New
Buildings
14.4.2.1.5. Salvage
and Towage
14.4.2.2. Argentina
Shipbroking Market Revenue (US$ Mn) and Forecasts, By Vertical Analysis
14.4.2.2.1. Oil
and Gas
14.4.2.2.2. Manufacturing
14.4.2.2.3. Aerospace
and Defense
14.4.2.2.4. Government
14.4.2.2.5. Others
14.4.3. Rest of
Latin America
14.4.3.1. Rest
of Latin America Shipbroking Market Revenue (US$ Mn) and Forecasts, By Services
14.4.3.1.1. Chartering
14.4.3.1.1.1. Container
Vessels
14.4.3.1.1.2. Tankers
14.4.3.1.1.3. Dry
Bulk
14.4.3.1.2. Sale
and Purchase
14.4.3.1.2.1. Valuations
14.4.3.1.2.2. Recycling
14.4.3.1.3. Offshore
14.4.3.1.4. New
Buildings
14.4.3.1.5. Salvage
and Towage
14.4.3.2. Rest
of Latin America Shipbroking Market Revenue (US$ Mn) and Forecasts, By Vertical
Analysis
14.4.3.2.1. Oil
and Gas
14.4.3.2.2. Manufacturing
14.4.3.2.3. Aerospace
and Defense
14.4.3.2.4. Government
14.4.3.2.5. Others
14.5. Key
Segment for Channeling Investments
14.5.1. By
Country
14.5.2. By
Services
14.5.3. By
Vertical Analysis
15. Competitive Benchmarking
15.1. Market Share
Analysis, 2018
15.2. Global
Presence and Growth Strategies
15.2.1. Mergers
and Acquisitions
15.2.2. Product
Launches
15.2.3. Investments
Trends
15.2.4. R&D
Initiatives
16. Player Profiles
16.1. Barry
Rogliano Salles International S.A
16.1.1. Company
Details
16.1.2. Company
Overview
16.1.3. Product
Offerings
16.1.4. Key Developments
16.1.5. Financial
Analysis
16.1.6. SWOT
Analysis
16.1.7. Business
Strategies
16.2. Braemar
Shipping Services PLC
16.2.1. Company
Details
16.2.2. Company
Overview
16.2.3. Product
Offerings
16.2.4. Key
Developments
16.2.5. Financial
Analysis
16.2.6. SWOT
Analysis
16.2.7. Business
Strategies
16.3. Bright
Cook & Co (S&P) Limited
16.3.1. Company
Details
16.3.2. Company
Overview
16.3.3. Product
Offerings
16.3.4. Key
Developments
16.3.5. Financial
Analysis
16.3.6. SWOT
Analysis
16.3.7. Business
Strategies
16.4. Charles
R. Weber Company, Inc.
16.4.1. Company
Details
16.4.2. Company
Overview
16.4.3. Product
Offerings
16.4.4. Key
Developments
16.4.5. Financial
Analysis
16.4.6. SWOT
Analysis
16.4.7. Business
Strategies
16.5. CLARKSON
PLC
16.5.1. Company
Details
16.5.2. Company
Overview
16.5.3. Product
Offerings
16.5.4. Key
Developments
16.5.5. Financial
Analysis
16.5.6. SWOT
Analysis
16.5.7. Business
Strategies
16.6. Compass
Maritime Services, LLC
16.6.1. Company
Details
16.6.2. Company
Overview
16.6.3. Product
Offerings
16.6.4. Key
Developments
16.6.5. Financial
Analysis
16.6.6. SWOT
Analysis
16.6.7. Business
Strategies
16.7. E.A.
Gibson Shipbrokers Ltd
16.7.1. Company
Details
16.7.2. Company
Overview
16.7.3. Product
Offerings
16.7.4. Key
Developments
16.7.5. Financial
Analysis
16.7.6. SWOT
Analysis
16.7.7. Business
Strategies
16.8. Howe
Robinson Partners
16.8.1. Company
Details
16.8.2. Company
Overview
16.8.3. Product
Offerings
16.8.4. Key
Developments
16.8.5. Financial
Analysis
16.8.6. SWOT
Analysis
16.8.7. Business
Strategies
16.9. INTEROCEAN
SHIPPING COMPANY
16.9.1. Company
Details
16.9.2. Company
Overview
16.9.3. Product
Offerings
16.9.4. Key
Developments
16.9.5. Financial
Analysis
16.9.6. SWOT
Analysis
16.9.7. Business
Strategies
16.10. Maersk
Broker K/S
16.10.1. Company
Details
16.10.2. Company
Overview
16.10.3. Product
Offerings
16.10.4. Key
Developments
16.10.5. Financial
Analysis
16.10.6. SWOT
Analysis
16.10.7. Business
Strategies
16.11. McQuilling
Partners, Inc.
16.11.1. Company
Details
16.11.2. Company
Overview
16.11.3. Product
Offerings
16.11.4. Key
Developments
16.11.5. Financial
Analysis
16.11.6. SWOT
Analysis
16.11.7. Business
Strategies
16.12. Poten
and Partners Group, Inc.
16.12.1. Company
Details
16.12.2. Company
Overview
16.12.3. Product
Offerings
16.12.4. Key
Developments
16.12.5. Financial
Analysis
16.12.6. SWOT
Analysis
16.12.7. Business
Strategies
16.13. Simpson
Spence Young
16.13.1. Company
Details
16.13.2. Company
Overview
16.13.3. Product
Offerings
16.13.4. Key
Developments
16.13.5. Financial
Analysis
16.13.6. SWOT
Analysis
16.13.7. Business
Strategies
16.14. SPI
Marine
16.14.1. Company
Details
16.14.2. Company
Overview
16.14.3. Product
Offerings
16.14.4. Key
Developments
16.14.5. Financial
Analysis
16.14.6. SWOT
Analysis
16.14.7. Business
Strategies
16.15. Velian
Ship Brokers
16.15.1. Company
Details
16.15.2. Company
Overview
16.15.3. Product
Offerings
16.15.4. Key Developments
16.15.5. Financial
Analysis
16.15.6. SWOT
Analysis
16.15.7. Business
Strategies
16.16. Other
Market Participants
17. Key Findings
Note: This ToC is tentative
and can be changed according to the research study conducted during the course
of report completion.
**Exclusive for Multi-User and
Enterprise User.
At Absolute Markets Insights, we are engaged in building both global as well as country specific reports. As a result, the approach taken for deriving the estimation and forecast for a specific country is a bit unique and different in comparison to the global research studies. In this case, we not only study the concerned market factors & trends prevailing in a particular country (from secondary research) but we also tend to calculate the actual market size & forecast from the revenue generated from the market participants involved in manufacturing or distributing the any concerned product. These companies can also be service providers. For analyzing any country specifically, we do consider the growth factors prevailing under the states/cities/county for the same. For instance, if we are analyzing an industry specific to United States, we primarily need to study about the states present under the same(where the product/service has the highest growth). Similar analysis will be followed by other countries. Our scope of the report changes with different markets.
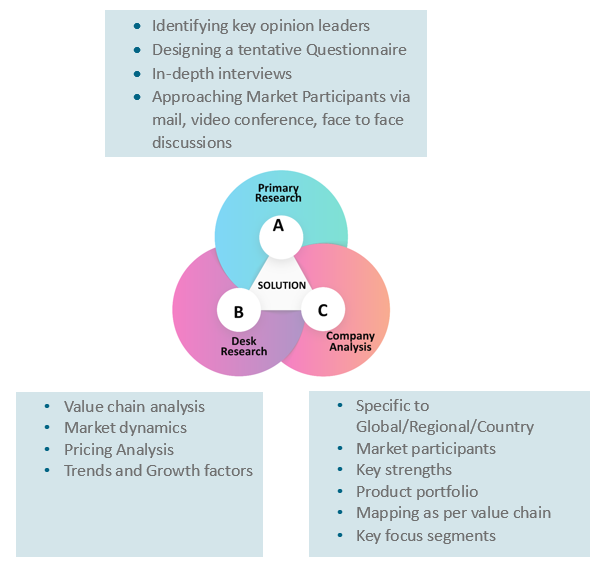
Our research study is mainly implement through a mix of both secondary and primary research. Various sources such as industry magazines, trade journals, and government websites and trade associations are reviewed for gathering precise data. Primary interviews are conducted to validate the market size derived from secondary research. Industry experts, major manufacturers and distributors are contacted for further validation purpose on the current market penetration and growth trends.
Prominent participants in our primary research process include:
- Key Opinion Leaders namely the CEOs, CSOs, VPs, purchasing managers, amongst others
- Research and development participants, distributors/suppliers and subject matter experts
Secondary Research includes data extracted from paid data sources:
- Reuters
- Factiva
- Bloomberg
- One Source
- Hoovers
Research Methodology
Key Inclusions
Why Absolute Markets Insights?
An effective strategy is the entity that influences a business to stand out of the crowd. An organization with a phenomenal strategy for success dependably has the edge over the rivals in the market. It offers the organizations a head start in planning their strategy. Absolute Market Insights is the new initiation in the industry that will furnish you with the lead your business needs. Absolute Market Insights is the best destination for your business intelligence and analytical solutions; essentially because our qualitative and quantitative sources of information are competent to give one-stop solutions. We inventively combine qualitative and quantitative research in accurate proportions to have the best report, which not only gives the most recent insights but also assists you to grow.
