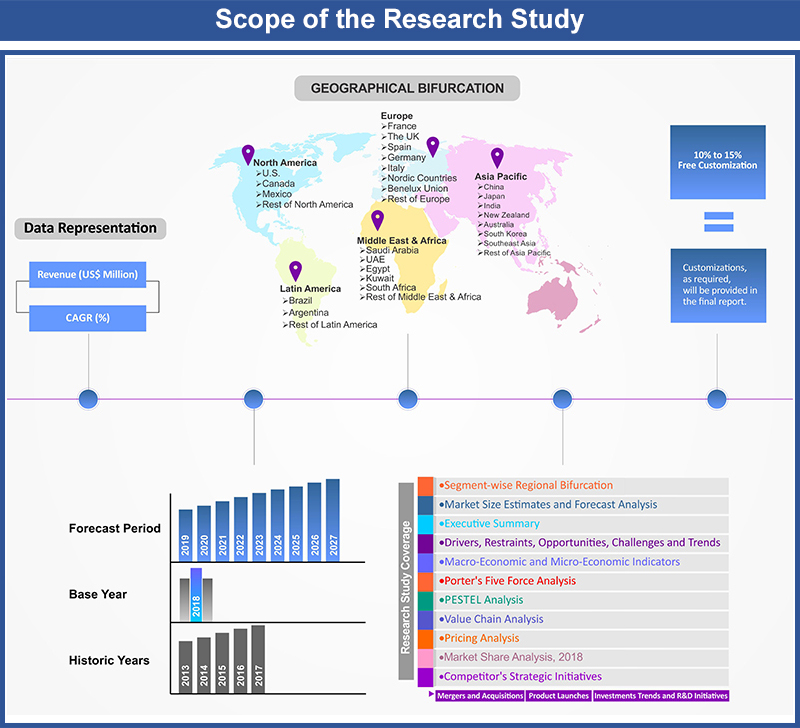
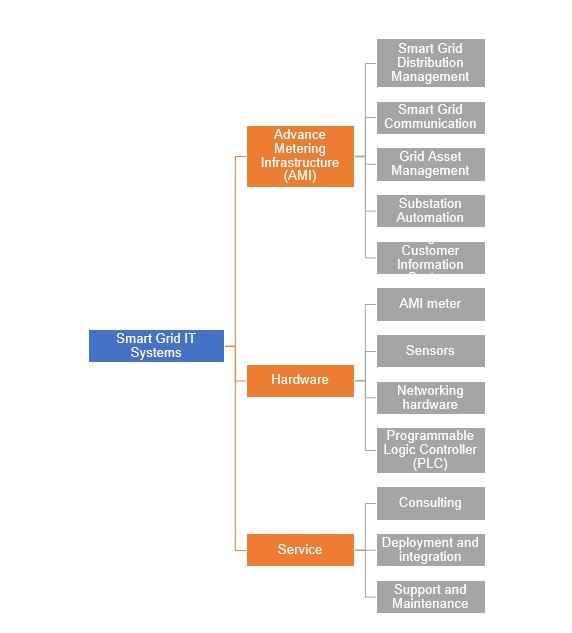
Smart Grid IT Systems Market by Software (Advance Metering Infrastructure (AMI), Smart Grid Distribution Management, Smart Grid, Communication, Grid Asset Management, Substation Automation, Billing and Customer Information System); by Hardware (AMI meter, Sensors, Networking hardware, Programmable Logic Controller (PLC)); by Service (Consulting, Deployment and integration, Support and maintenance); United States Insights, Growth, Size, Comparative Analysis, Trends and Forecast, 2018 – 2026
Industry Trends
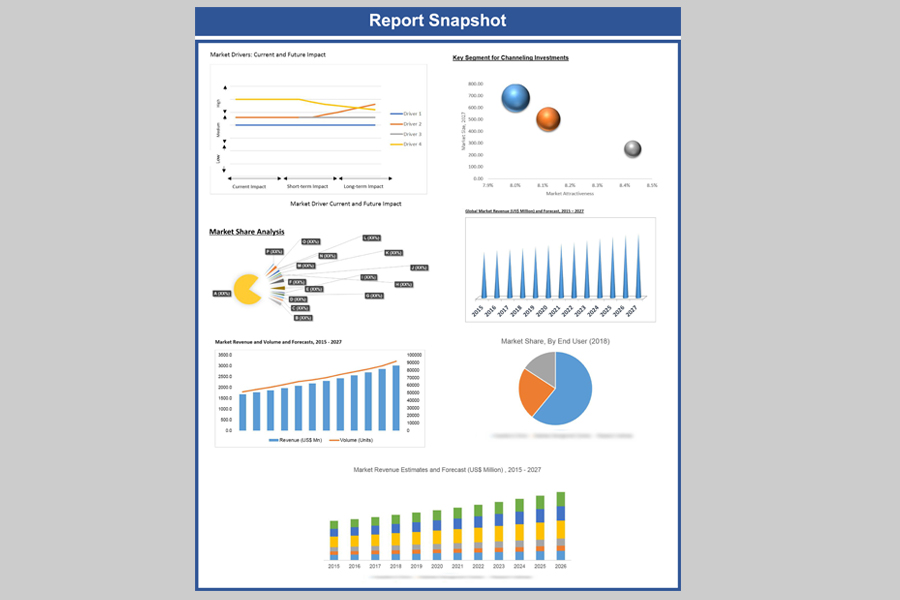
A smart grid is a modern power generation, transmission and distribution system that can automate and manage the increasing complexity and needs of electricity in the 21st century. The technology aims to integrate and support renewable energy sources like solar, wind and hydro thereby empowering consumers with real-time information about their energy consumption and assist utility companies to reduce outages. Smart grids are essentially intelligent appliances that are capable of deciding when to consume power based on the pre-set user preferences. There are also smart substations that control critical and non-critical operational data, such as power factor performance, breaker, and battery and transformer status. The United States Smart Grid IT Systems Market was valued at US$ 3857.0 Mn in 2017 and is expected to reach US$ 9228.0 Mn by 2022.
U.S. Smart Grid IT Systems Market, By Software, 2018-2026 (US$ Billion)
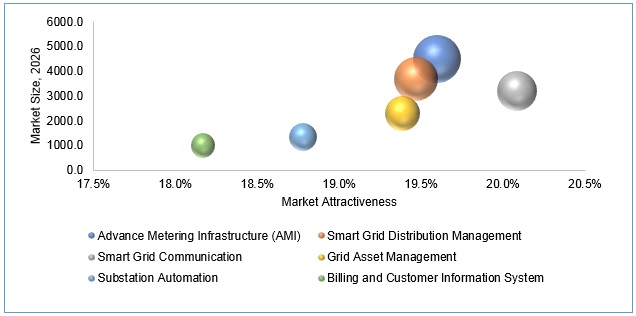
Smart Grid IT Systems Market, by Software
On the basis of software, advance metering infrastructure (AMI) drives the market with largest share in 2017. It is a self-sufficient electricity network system based on digital automation technology for monitoring, control, and analysis within the supply chain. The functionality of the system to find the solution to the problems very quickly, and reduction in workforce has propelled the growth of this segment. The number of smart meter shipments in the United States is expected to increase at a fast pace. The market is driven by incentives from the federal government, which has funded R&D programs to the tune of billions of dollars.
Competitive Landscape
The report provides both, qualitative and quantitative research of the United states smart grid it systems market, as well as integrates worthy insights into the rational scenario and favored development methods adopted by the key contenders. The report also offers extensive research on the key players in this market and detailed insights on the competitiveness of these players. The key business strategies such as Mergers & Acquisitions (M&A), affiliations, collaborations, and contracts adopted by the major players are also recognized and analyzed in the report. For each company, the report recognizes their manufacturing base, competitors, product type, application and specification, pricing, and gross margin.
Some of the significant players functioning in the U.S. Smart Grid IT Systems Market include Green Charge Networks, Bit Stew, Duke Energy, Enbala Power Networks, Enphase, Florida Power & Light, Green Charge Networks, Greensmith Energy Management Systems, Gridco Systems, New Brunswick Power Corporation, NRG Home, Opower, S&C Electric Company, Sacramento Municipal Utility District, Schneider Electric, SolarCity, Stem, Sunverge Energy Inc., Tendril. among others.
Smart Grid IT Systems Industry Background
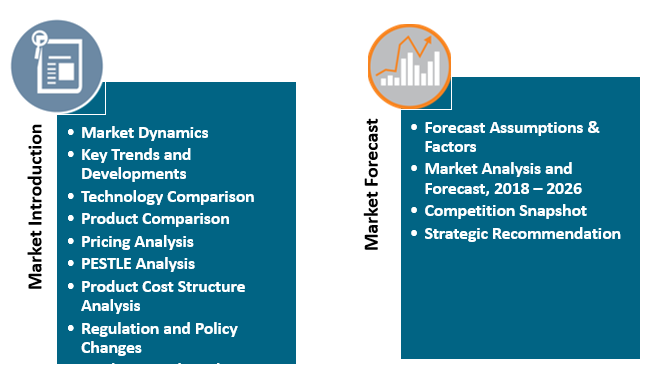
1. Introduction
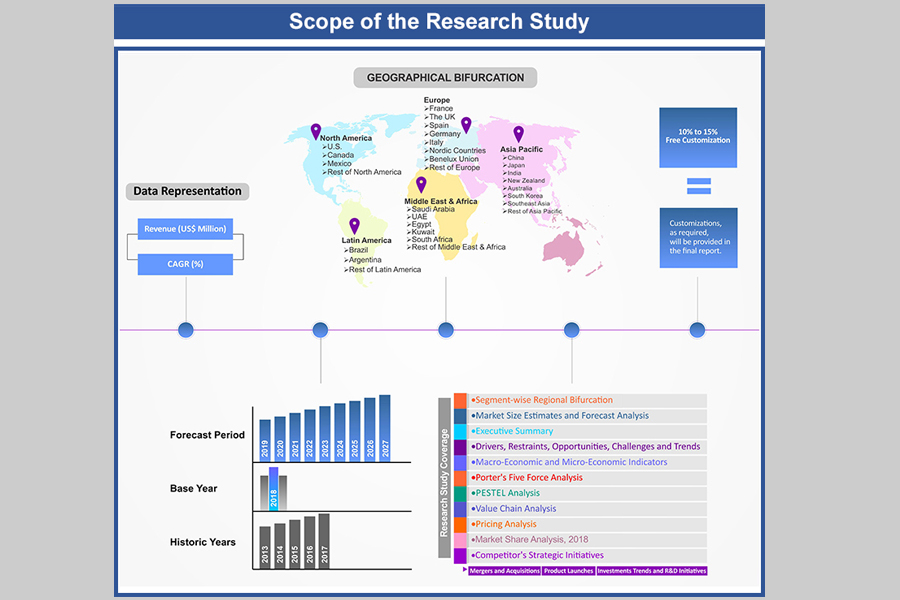
1.1. Market Scope
1.2. Market Segmentation
1.3. Methodology
1.4. Assumptions
2. Smart Grid
IT Systems Market Snapshot
3. Executive
Summary: Smart Grid IT Systems Market
4. Qualitative
Analysis: Smart Grid IT Systems Market
4.1. Introduction
4.1.1. Product Definition
4.1.2. Industry Development
4.2. Market Dynamics
4.2.1. Drivers
4.2.2. Restraints
4.2.3. Opportunities
4.3. Trends in Market
5. United
States Smart Grid IT Systems Market Analysis and Forecasts, 2018 – 2026
5.1. Overview
5.1.1. United States Market Revenue (US$ Mn) and
Forecasts
5.2. United States Smart Grid IT Systems Market
Revenue (US$ Mn) and Forecasts, By Software
5.2.1. Smart Grid Distribution Management
5.2.1.1.
Definition
5.2.1.2.
Market
Penetration
5.2.1.3.
Market Revenue
Expected to Increase by 2026
5.2.1.4.
Compound Annual
Growth Rate (CAGR)
5.2.2. Smart Grid Communication
5.2.2.1.
Definition
5.2.2.2.
Market
Penetration
5.2.2.3.
Market Revenue
Expected to Increase by 2026
5.2.2.4.
Compound Annual
Growth Rate (CAGR)
5.2.3. Grid Asset Management
5.2.3.1.
Definition
5.2.3.2.
Market
Penetration
5.2.3.3.
Market Revenue
Expected to Increase by 2026
5.2.3.4.
Compound Annual
Growth Rate (CAGR)
5.2.4. Substation Automation
5.2.4.1.
Definition
5.2.4.2.
Market
Penetration
5.2.4.3.
Market Revenue
Expected to Increase by 2026
5.2.4.4.
Compound Annual
Growth Rate (CAGR)
5.2.5. Customer Information
5.2.5.1.
Definition
5.2.5.2.
Market
Penetration
5.2.5.3.
Market Revenue
Expected to Increase by 2026
5.2.5.4.
Compound Annual
Growth Rate (CAGR)
5.2.6. Advance Metering Infrastructure (AMI)
5.2.6.1.
Definition
5.2.6.2.
Market
Penetration
5.2.6.3.
Market Revenue
Expected to Increase by 2026
5.2.6.4.
Compound Annual
Growth Rate (CAGR)
5.3. Key Segment for Channeling Investments
5.3.1. By Software
6. United
States Smart Grid IT Systems Market Analysis and Forecasts, 2018 – 2026
6.1. Overview
6.2. United States Smart Grid IT Systems Market
Revenue (US$ Mn) and Forecasts, By Hardware
6.2.1. AMI meter
6.2.1.1.
Definition
6.2.1.2.
Market
Penetration
6.2.1.3.
Market Revenue
Expected to Increase by 2026
6.2.1.4.
Compound Annual
Growth Rate (CAGR)
6.2.2. Sensors
6.2.2.1.
Definition
6.2.2.2.
Market
Penetration
6.2.2.3.
Market Revenue
Expected to Increase by 2026
6.2.2.4.
Compound Annual
Growth Rate (CAGR)
6.2.3. Networking hardware
6.2.3.1.
Definition
6.2.3.2.
Market
Penetration
6.2.3.3.
Market Revenue
Expected to Increase by 2026
6.2.3.4.
Compound Annual
Growth Rate (CAGR)
6.2.4. Programmable Logic Controller (PLC)
6.2.4.1.
Definition
6.2.4.2.
Market
Penetration
6.2.4.3.
Market Revenue
Expected to Increase by 2026
6.2.4.4.
Compound Annual
Growth Rate (CAGR)
6.3. Key Segment for Channeling Investments
6.3.1. By Hardware
7. United
States Smart Grid IT Systems Market Analysis and Forecasts, 2018 – 2026
7.1. Overview
7.2. United States Smart Grid IT Systems Market
Revenue (US$ Mn) and Forecasts, By Service
7.2.1. Consulting
7.2.1.1.
Definition
7.2.1.2.
Market
Penetration
7.2.1.3.
Market Revenue
Expected to Increase by 2026
7.2.1.4.
Compound Annual
Growth Rate (CAGR)
7.2.2. Smart Grid IT Systems Market Deployment and
integration
7.2.2.1.
Definition
7.2.2.2.
Market
Penetration
7.2.2.3.
Market Revenue
Expected to Increase by 2026
7.2.2.4.
Compound Annual
Growth Rate (CAGR)
7.2.3. Support and Maintenance
7.2.3.1.
Definition
7.2.3.2.
Market
Penetration
7.2.3.3.
Market Revenue
Expected to Increase by 2026
7.2.3.4.
Compound Annual
Growth Rate (CAGR)
7.3. Key Segment for Channeling Investments
7.3.1. By Service
8. Smart Grid
IT Systems Market Competitive Benchmarking
8.1. Player Positioning Analysis
8.2. United States Presence and Growth Strategies
9. Player
Profiles
9.1. Green Charge Networks
9.1.1. Company Details
9.1.2. Company Overview
9.1.3. Product Offerings
9.1.4. Key Developments
9.1.5. Financial Analysis
9.1.6. SWOT Analysis
9.1.7. Business Strategies
9.2. Bit Stew
9.2.1. Company Details
9.2.2. Company Overview
9.2.3. Product Offerings
9.2.4. Key Developments
9.2.5. Financial Analysis
9.2.6. SWOT Analysis
9.2.7. Business Strategies
9.3. Duke Energy
9.3.1. Company Details
9.3.2. Company Overview
9.3.3. Product Offerings
9.3.4. Key Developments
9.3.5. Financial Analysis
9.3.6. SWOT Analysis
9.3.7. Business Strategies
9.4. Enbala Power Networks
9.4.1. Company Details
9.4.2. Company Overview
9.4.3. Product Offerings
9.4.4. Key Developments
9.4.5. Financial Analysis
9.4.6. SWOT Analysis
9.4.7. Business Strategies
9.5. Enphase
9.5.1. Company Details
9.5.2. Company Overview
9.5.3. Product Offerings
9.5.4. Key Developments
9.5.5. Financial Analysis
9.5.6. SWOT Analysis
9.5.7. Business Strategies
9.6. Florida Power and Light
9.6.1. Company Details
9.6.2. Company Overview
9.6.3. Product Offerings
9.6.4. Key Developments
9.6.5. Financial Analysis
9.6.6. SWOT Analysis
9.6.7. Business Strategies
9.7. Green Charge Networks
9.7.1. Company Details
9.7.2. Company Overview
9.7.3. Product Offerings
9.7.4. Key Developments
9.7.5. Financial Analysis
9.7.6. SWOT Analysis
9.7.7. Business Strategies
9.8. Greensmith Energy Management Systems
9.8.1. Company Details
9.8.2. Company Overview
9.8.3. Product Offerings
9.8.4. Key Developments
9.8.5. Financial Analysis
9.8.6. SWOT Analysis
9.8.7. Business Strategies
9.9. Gridco Systems
9.9.1. Company Details
9.9.2. Company Overview
9.9.3. Product Offerings
9.9.4. Key Developments
9.9.5. Financial Analysis
9.9.6. SWOT Analysis
9.9.7. Business Strategies
9.10. New Brunswick Power Corporation
9.10.1. Company Details
9.10.2. Company Overview
9.10.3. Product Offerings
9.10.4. Key Developments
9.10.5. Financial Analysis
9.10.6. SWOT Analysis
9.10.7. Business Strategies
9.11. NRG Home
9.11.1. Company Details
9.11.2. Company Overview
9.11.3. Product Offerings
9.11.4. Key Developments
9.11.5. Financial Analysis
9.11.6. SWOT Analysis
9.11.7. Business Strategies
9.12. Opower
9.12.1. Company Details
9.12.2. Company Overview
9.12.3. Product Offerings
9.12.4. Key Developments
9.12.5. Financial Analysis
9.12.6. SWOT Analysis
9.12.7. Business Strategies
9.13. SandC Electric Company
9.13.1. Company Details
9.13.2. Company Overview
9.13.3. Product Offerings
9.13.4. Key Developments
9.13.5. Financial Analysis
9.13.6. SWOT Analysis
9.13.7. Business Strategies
9.14. Sacramento Municipal Utility District
9.14.1. Company Details
9.14.2. Company Overview
9.14.3. Product Offerings
9.14.4. Key Developments
9.14.5. Financial Analysis
9.14.6. SWOT Analysis
9.14.7. Business Strategies
9.15. Schneider Electric
9.15.1. Company Details
9.15.2. Company Overview
9.15.3. Product Offerings
9.15.4. Key Developments
9.15.5. Financial Analysis
9.15.6. SWOT Analysis
9.15.7. Business Strategies
9.16. SolarCity
9.16.1. Company Details
9.16.2. Company Overview
9.16.3. Product Offerings
9.16.4. Key Developments
9.16.5. Financial Analysis
9.16.6. SWOT Analysis
9.16.7. Business Strategies
9.17. Stem
9.17.1. Company Details
9.17.2. Company Overview
9.17.3. Product Offerings
9.17.4. Key Developments
9.17.5. Financial Analysis
9.17.6. SWOT Analysis
9.17.7. Business Strategies
9.18. Sunverge Energy Inc.
9.18.1. Company Details
9.18.2. Company Overview
9.18.3. Product Offerings
9.18.4. Key Developments
9.18.5. Financial Analysis
9.18.6. SWOT Analysis
9.18.7. Business Strategies
9.19. Tendril
9.19.1. Company Details
9.19.2. Company Overview
9.19.3. Product Offerings
9.19.4. Key Developments
9.19.5. Financial Analysis
9.19.6. SWOT Analysis
9.19.7. Business Strategies
Note: This ToC is tentative
and can be changed according to the research study conducted during the course
of report completion.
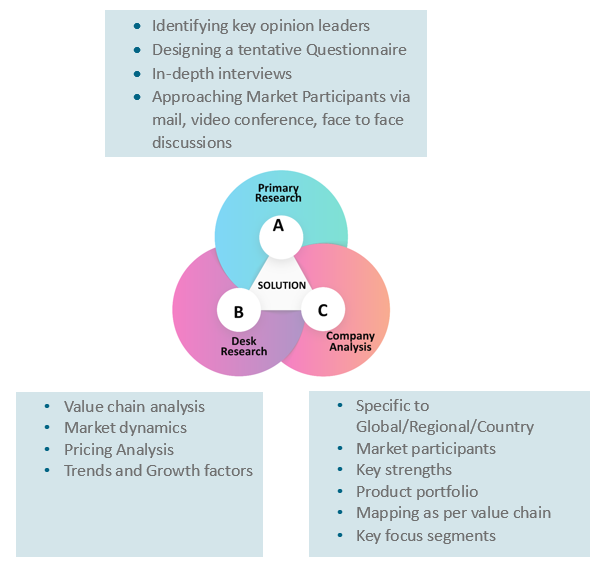
At Absolute Markets Insights, we are engaged in building both global as well as country specific reports. As a result, the approach taken for deriving the estimation and forecast for a specific country is a bit unique and different in comparison to the global research studies. In this case, we not only study the concerned market factors & trends prevailing in a particular country (from secondary research) but we also tend to calculate the actual market size & forecast from the revenue generated from the market participants involved in manufacturing or distributing the any concerned product. These companies can also be service providers. For analyzing any country specifically, we do consider the growth factors prevailing under the states/cities/county for the same. For instance, if we are analyzing an industry specific to United States, we primarily need to study about the states present under the same(where the product/service has the highest growth). Similar analysis will be followed by other countries. Our scope of the report changes with different markets.
Our research study is mainly implement through a mix of both secondary and primary research. Various sources such as industry magazines, trade journals, and government websites and trade associations are reviewed for gathering precise data. Primary interviews are conducted to validate the market size derived from secondary research. Industry experts, major manufacturers and distributors are contacted for further validation purpose on the current market penetration and growth trends.
Prominent participants in our primary research process include:
- Key Opinion Leaders namely the CEOs, CSOs, VPs, purchasing managers, amongst others
- Research and development participants, distributors/suppliers and subject matter experts
Secondary Research includes data extracted from paid data sources:
- Reuters
- Factiva
- Bloomberg
- One Source
- Hoovers
Research Methodology
Key Inclusions
Why Absolute Markets Insights?
An effective strategy is the entity that influences a business to stand out of the crowd. An organization with a phenomenal strategy for success dependably has the edge over the rivals in the market. It offers the organizations a head start in planning their strategy. Absolute Market Insights is the new initiation in the industry that will furnish you with the lead your business needs. Absolute Market Insights is the best destination for your business intelligence and analytical solutions; essentially because our qualitative and quantitative sources of information are competent to give one-stop solutions. We inventively combine qualitative and quantitative research in accurate proportions to have the best report, which not only gives the most recent insights but also assists you to grow.
