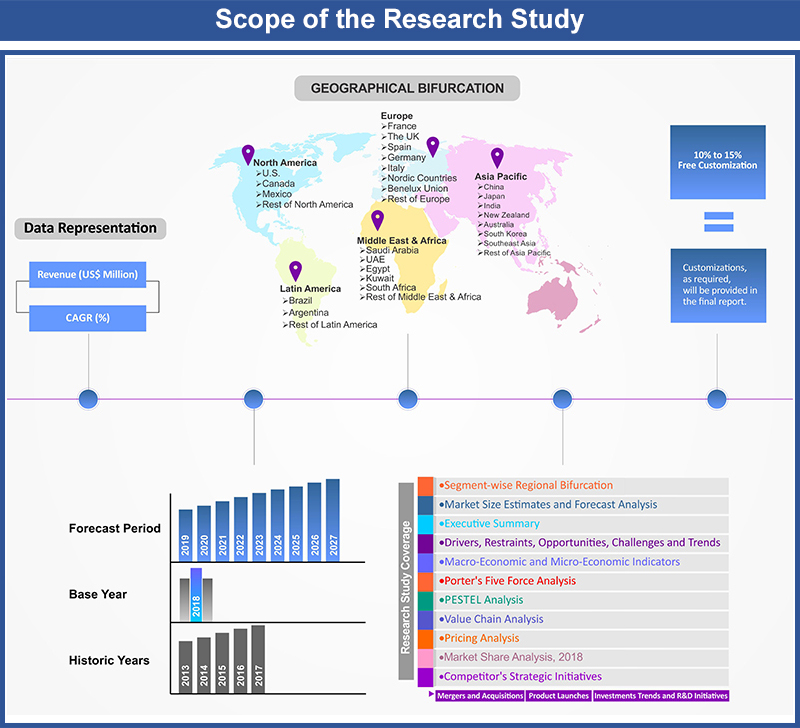
Global Squalene Market By End-use Product Categories (Cosmetics, Pharmaceuticals, Nutraceuticals, Vaccine, Others); By Distribution Channel (Retail, Chemists, E-commerce stores, Offline stores); By Source (Animal, Plant, Synthetic); By Region (U.S., Canada, Mexico, Rest of North America, The UK, France, Germany, Italy, Spain, Nordic Countries (Denmark, Finland, Iceland, Sweden, Norway), Benelux Union (Belgium, the Netherlands, Luxembourg), Rest of Europe, China, Japan, India, New Zealand, Australia, South Korea, Southeast Asia (Indonesia, Thailand, Malaysia, Singapore, Rest of Southeast Asia), Saudi Arabia, UAE, Egypt, Kuwait, South Africa, Rest of Middle East & Africa, Brazil, Argentina, Rest of Latin America) – Global Insights, Growth, Size, Comparative Analysis, Trends and Forecast, 2019 - 2027
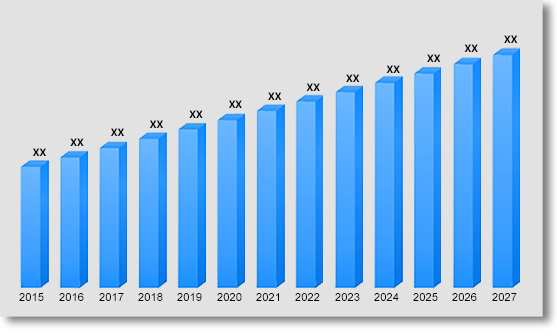
Global squalene market is value at US$ 149.0 Mn in anticipared to reach US$ 339.0 Mn in 2027 growing at a CAGR of 9.6% over the forecast period. Rise in healthcare awareness have transformed the requirements and consumption behaviours of consumers across the globe, thus, impacting wide array of industries. In 2017, Lancet Commission published the Global Burden of Disease Study, .They have concluded that 9.0 million premature deaths occur each year due to pollution. Emergence of newer diseases owing to sedentary lifestyle among urban population has created high healthcare awareness among people, thus, causing an upsurge in requirement for preventive and curative medications. Hence, squalene (C30H50), a natural organic compound with high pharmacological, cosmetic, and nutritional potential is witnessing increased demand to counter these healthcare issues.
Squalene is an intermediary product of cholesterol biosynthesis and it occurs naturally as a highly unsaturated Triterpenic hydrocarbon compound. It is an organic compound primarily derived from shark-liver oil and is essentially used for commercial purposes. Presently there are plant sources that are now used including amaranth seed, rice bran, wheat germ, olives among others. Squalene was initially discovered in 1916 from a deep-sea shark liver by a Japanese chemist Mitsumaru Tsujimoto. Squalene has numerous applications including lubricating oils, cosmetics, gas chromatographic analysis, transformer oil, pharmaceuticals, ointment base and bactericide among others. Due to its structure, squalene acts as an antioxidant and detoxification agent, to boost the immunity systems in humans. Thus, rise in healthcare awareness has increased consumption of squalene to boost the immunity of people against emerging illnesses has inflated the global squalene market.
Squalene has proven its competencies in treatment of many chronic illnesses including cancer, heart diseases and others. Squalene is a biosynthetic precursor to all steroids. It acts as a cytoprotective agent (protective agent against cancerous growth) to normal cells exposed to carcinogens and antitumor agents that retard the growth of blood vessels in a cancerous tumor. The effect of squalene is found in certain types of cancer, including breast, prostate, and colon cancer among others. Squalene is also used along with common cancer drugs for preventing illness due to radiation from cancer X-ray therapies. These benefits of squalene has increased its demand to cure rapidly growing cancer population. In September 2018, World health Organization (WHO) stated in their press release that globally around one among six deaths across the globe were by cancer which totalled around 9.6 million deaths. Rise in population of cancer patients have created a high demand for squalene. Squalene has been effectively curing heart related diseases by controlling the cholesterol levels in blood and also improving the efficiency of cholesterol lowering drugs. Squalene increased the production of HDL (high density lipoprotein) and the excretion of LDL (low density lipoprotein) which reduces the risk of heart disease and protects the less stable body fats from oxidation. These characteristics of squalene is fuelling its demand from rapidly growing heart patients. For instance, in December 2019, National Centre for Chronic Disease Prevention and Health Promotion published a study which stated that 647,000 U.S citizens die each year due to heart related diseases. The total expenditure of the U.S on heart diseases amounted to US$ 219 Bn in 2015. Thus, high growth in number of heart patients and their expenditure on heart related treatments and medications has created an upsurge in demand for squalene. Thus, efficacies of squalene in treatment of chronic illnesses including cancer, heart diseases and others are driving the growth of squalene market across the globe.
End-use Product Categories Outlook:
Squalene is a natural ingredient present inside the skin in minute concentrations. It has numerous beneficial properties including anti-oxidation, anti-aging, UV protection, and others, thus expanding its scope of applications in the cosmetic, pharmaceutical and food industries. Based on the type of end-use product categories, cosmetics held the largest share of the global squalene market. Increase in presence of people on social media networks has raised the awareness for grooming. This trend has created an upsurge in the demand for beauty and cosmetic products. Squalene is a natural moisturizer which provides protection to the skin and arrest wrinkle development. It also protects the skin from UV rays by deactivating the singlet oxygen generated on to exposure these rays. These properties make squalene an essential element in cosmetic products including bath oils; hair products; eye makeup; foundations; lipstick; suntan and sunscreen products amongst others and also a vital nutritional support product to maintain healthy skin. For instance, one of the leading cosmetics manufacturer, Anastasia Beverly Hills has product offering of hydrating oils which contain squalene compound. Squalene also has antioxidant properties which reduces oxidative damage, cell death and tissue damage by neutralising free radicals. Thus, the multiple applications of squalene in beauty products is driving the growth of cosmetics in squalene market across the globe.
Source Outlook:
In 2018, based on the type of source, squalene derived from animals dominated the global squalene market owing to the cost effectiveness. Also, the purity and content of squalene obtained from an animal source is higher compared to other sources. However, governments across continents are restricting fishing of shark which are an endangered species which is the primary source of squalene. For instance, in the U.S., the Magnuson-Stevens Fishery Conservation and Management Act Fisheries Management Act of Australia and others acts as a restraint in fishing of sharks due to conservation and protect the species. This has caused volatility in source of squalene, thus forcing the squalene producers to opt for alternative sources. Vegetable sources of squalene including olive oil, amaranth and others are being extensively explored by squalene market players. Owing to this companies are increasingly investing in alternate squalene sources. For instance, in February 2018, Amaris, Inc. announced that its joint venture with NIKKOL GROUP, Aprinnova launched pharmaceutical grade Neossance Squalene which is derived from sugarcane. Similarly, SynShark produces tobacco based squalene for cosmetic and medical sectors. These innovations are poised to boost the growth of plant sources in global squalene market over forecast years.
Regional Outlook:
In 2018, North America region registered the highest share in the global squalene market However, Asia Pacific region is anticipated to show lucrative growth opportunities in global squalene market over forecast years owing to rise in cosmetic and pharmaceutical industry.
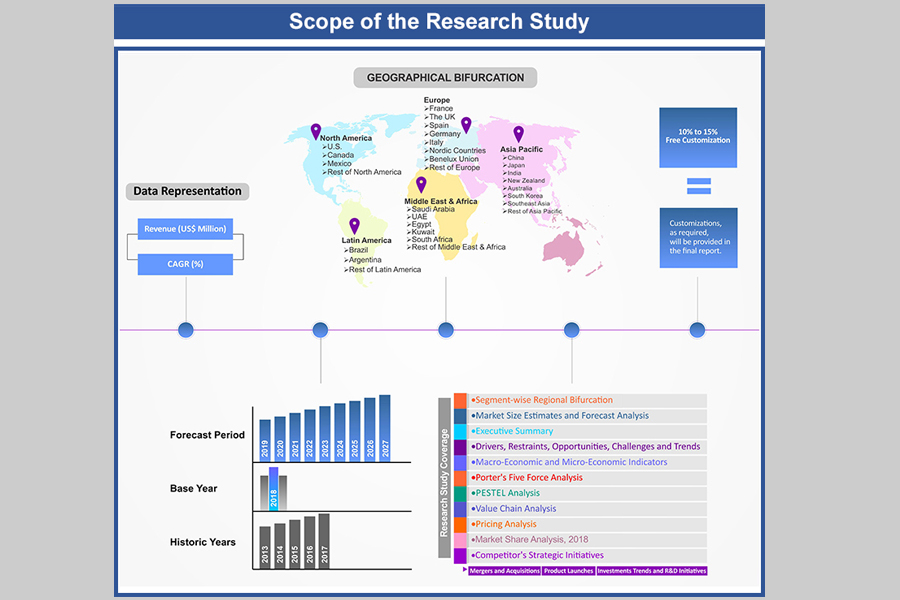
Rise in cosmetic industry in emerging markets including China, India, Japan and others coupled with awareness about the quality of cosmetic products has generated willingness among the native population to opt for premium products. This expenditure has been supplemented by rise in dispensable income of people in these emerging economies. These factors are anticipated to fuel the growth of Asia Pacific squalene market over forecast period. The study analyses the market in terms of revenue across all the major regions, which have been bifurcated into countries.
Competitive Landscape
The report provides both, qualitative and quantitative research of squalene market, as well as provides comprehensive insights and development methods adopted by the key contenders. The report also offers extensive research on the key players in this market and details on the competitiveness of these players. Key business strategies such as mergers and acquisitions (M&A), affiliations, collaborations, and contracts adopted by these major market participants are also recognized and analysed in the report. For each company, the report studies their global presence, competitors, service offerings and specification amongst others.
Some of the players operating in the squalene market are Amaris, Arbee, Arista Industries Inc., Bawa Fishmeal & Oil Co., ChemFaces, Empressa Figueirrense de Pesca, Jedwards International, Inc., Kishimoto Special Liver Oil Co. Ltd., Lýsi hf., Merck KGaA, Metabolics ltd, Nucelis, NZ Pure Health, Seadragon, Silberhorn, SOPHIM and SynShark amongst others.
Global Squalene Market:
By End-use Product Categories
- Cosmetics
- Pharmaceuticals
- Nutraceuticals
- Vaccine
- Others
By Distribution Channel
- Retail Chemists
- E-commerce stores
- Offline stores
By Source
- Animal
- Plant
- Synthetic
Table of Contents
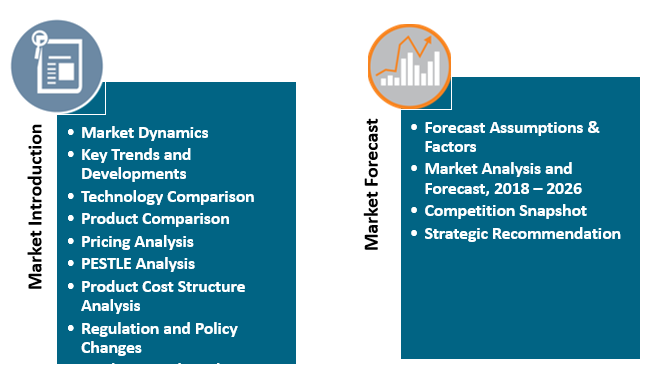
1. Market
Scope
1.1. Market
Segmentation
1.2. Years
Considered
1.2.1. Historic
Years: 2013 - 2017
1.2.2. Base
Year: 2018
1.2.3. Forecast
Years: 2019 – 2027
2. Key
Target Audiences
3. Research
Methodology
3.1. Primary
Research
3.1.1. Research
Questionnaire
3.1.2. Global
Percentage Breakdown
3.1.3. Primary
Interviews: Key Opinion Leaders (KOLs)
3.2. Secondary
Research
3.2.1. Paid
Databases
3.2.2. Secondary
Sources
3.3. Market
Size Estimates
3.3.1. Top-Down
Approach
3.3.2. Bottom-Up
Approach
3.4. Data
Triangulation Methodology
3.5. Research
Assumptions
4. Recommendations
and Insights from AMI’s Perspective**
5. Holistic
Overview of Squalene Market
6. Market
Synopsis: Squalene Market
7. Squalene
Market Analysis: Qualitative Perspective
7.1. Introduction
7.1.1. Product
Definition
7.1.2. Industry
Development
7.2. Market
Dynamics
7.2.1. Drivers
7.2.2. Restraints
7.2.3. Opportunities
7.3. Trends in
Squalene Market
7.4. Market
Determinants Radar Chart
7.5. Macro-Economic
and Micro-Economic Indicators: Squalene Market
7.6. Porter’s
Five Force Analysis
8. Global
Squalene Market Analysis and Forecasts, 2019 – 2027
8.1. Overview
8.1.1. Global
Squalene Market Revenue (US$ Mn)
8.2. Global
Squalene Market Revenue (US$ Mn) and Forecasts, By End-use Product Categories
8.2.1. Cosmetics
8.2.1.1. Definition
8.2.1.2. Market Estimation and Penetration, 2013 – 2018
8.2.1.3. Market Forecast, 2019 – 2027
8.2.1.4. Compound Annual Growth Rate (CAGR)
8.2.1.5. Regional Bifurcation
8.2.1.5.1. North America
8.2.1.5.1.1. Market Estimation, 2013 – 2018
8.2.1.5.1.2. Market Forecast, 2019 – 2027
8.2.1.5.2. Europe
8.2.1.5.2.1. Market Estimation, 2013 – 2018
8.2.1.5.2.2. Market Forecast, 2019 – 2027
8.2.1.5.3. Asia Pacific
8.2.1.5.3.1. Market Estimation, 2013 – 2018
8.2.1.5.3.2. Market Forecast, 2019 – 2027
8.2.1.5.4. Middle East and Africa
8.2.1.5.4.1. Market Estimation, 2013 – 2018
8.2.1.5.4.2. Market Forecast, 2019 – 2027
8.2.1.5.5. Latin America
8.2.1.5.5.1. Market Estimation, 2013 – 2018
8.2.1.5.5.2. Market Forecast, 2019 – 2027
8.2.2. Pharmaceuticals
8.2.2.1. Definition
8.2.2.2. Market Estimation and Penetration, 2013 – 2018
8.2.2.3. Market Forecast, 2019 – 2027
8.2.2.4. Compound Annual Growth Rate (CAGR)
8.2.2.5. Regional Bifurcation
8.2.2.5.1. North America
8.2.2.5.1.1. Market Estimation, 2013 – 2018
8.2.2.5.1.2. Market Forecast, 2019 – 2027
8.2.2.5.2. Europe
8.2.2.5.2.1. Market Estimation, 2013 – 2018
8.2.2.5.2.2. Market Forecast, 2019 – 2027
8.2.2.5.3. Asia Pacific
8.2.2.5.3.1. Market Estimation, 2013 – 2018
8.2.2.5.3.2. Market Forecast, 2019 – 2027
8.2.2.5.4. Middle East and Africa
8.2.2.5.4.1. Market Estimation, 2013 – 2018
8.2.2.5.4.2. Market Forecast, 2019 – 2027
8.2.2.5.5. Latin America
8.2.2.5.5.1. Market Estimation, 2013 – 2018
8.2.2.5.5.2. Market Forecast, 2019 – 2027
8.2.3. Nutraceuticals
8.2.3.1. Definition
8.2.3.2. Market Estimation and Penetration, 2013 – 2018
8.2.3.3. Market Forecast, 2019 – 2027
8.2.3.4. Compound Annual Growth Rate (CAGR)
8.2.3.5. Regional Bifurcation
8.2.3.5.1. North America
8.2.3.5.1.1. Market Estimation, 2013 – 2018
8.2.3.5.1.2. Market Forecast, 2019 – 2027
8.2.3.5.2. Europe
8.2.3.5.2.1. Market Estimation, 2013 – 2018
8.2.3.5.2.2. Market Forecast, 2019 – 2027
8.2.3.5.3. Asia Pacific
8.2.3.5.3.1. Market Estimation, 2013 – 2018
8.2.3.5.3.2. Market Forecast, 2019 – 2027
8.2.3.5.4. Middle East and Africa
8.2.3.5.4.1. Market Estimation, 2013 – 2018
8.2.3.5.4.2. Market Forecast, 2019 – 2027
8.2.3.5.5. Latin America
8.2.3.5.5.1. Market Estimation, 2013 – 2018
8.2.3.5.5.2. Market Forecast, 2019 – 2027
8.2.4. Vaccine
8.2.4.1. Definition
8.2.4.2. Market Estimation and Penetration, 2013 – 2018
8.2.4.3. Market Forecast, 2019 – 2027
8.2.4.4. Compound Annual Growth Rate (CAGR)
8.2.4.5. Regional Bifurcation
8.2.4.5.1. North America
8.2.4.5.1.1. Market Estimation, 2013 – 2018
8.2.4.5.1.2. Market Forecast, 2019 – 2027
8.2.4.5.2. Europe
8.2.4.5.2.1. Market Estimation, 2013 – 2018
8.2.4.5.2.2. Market Forecast, 2019 – 2027
8.2.4.5.3. Asia Pacific
8.2.4.5.3.1. Market Estimation, 2013 – 2018
8.2.4.5.3.2. Market Forecast, 2019 – 2027
8.2.4.5.4. Middle East and Africa
8.2.4.5.4.1. Market Estimation, 2013 – 2018
8.2.4.5.4.2. Market Forecast, 2019 – 2027
8.2.4.5.5. Latin America
8.2.4.5.5.1. Market Estimation, 2013 – 2018
8.2.4.5.5.2. Market Forecast, 2019 – 2027
8.2.5. Others
8.2.5.1. Definition
8.2.5.2. Market Estimation and Penetration, 2013 – 2018
8.2.5.3. Market Forecast, 2019 – 2027
8.2.5.4. Compound Annual Growth Rate (CAGR)
8.2.5.5. Regional Bifurcation
8.2.5.5.1. North America
8.2.5.5.1.1. Market Estimation, 2013 – 2018
8.2.5.5.1.2. Market Forecast, 2019 – 2027
8.2.5.5.2. Europe
8.2.5.5.2.1. Market Estimation, 2013 – 2018
8.2.5.5.2.2. Market Forecast, 2019 – 2027
8.2.5.5.3. Asia Pacific
8.2.5.5.3.1. Market Estimation, 2013 – 2018
8.2.5.5.3.2. Market Forecast, 2019 – 2027
8.2.5.5.4. Middle East and Africa
8.2.5.5.4.1. Market Estimation, 2013 – 2018
8.2.5.5.4.2. Market Forecast, 2019 – 2027
8.2.5.5.5. Latin America
8.2.5.5.5.1. Market Estimation, 2013 – 2018
8.2.5.5.5.2. Market Forecast, 2019 – 2027
8.3. Key
Segment for Channeling Investments
8.3.1. By
End-use Product Categories
9. Global
Squalene Market Analysis and Forecasts, 2019 – 2027
9.1. Overview
9.2. Global
Squalene Market Revenue (US$ Mn) and Forecasts, By Distribution Channel
9.2.1. Retail
Chemists
9.2.1.1. Definition
9.2.1.2. Market Estimation and Penetration, 2013 – 2018
9.2.1.3. Market Forecast, 2019 – 2027
9.2.1.4. Compound Annual Growth Rate (CAGR)
9.2.1.5. Regional Bifurcation
9.2.1.5.1. North America
9.2.1.5.1.1. Market Estimation, 2013 – 2018
9.2.1.5.1.2. Market Forecast, 2019 – 2027
9.2.1.5.2. Europe
9.2.1.5.2.1. Market Estimation, 2013 – 2018
9.2.1.5.2.2. Market Forecast, 2019 – 2027
9.2.1.5.3. Asia Pacific
9.2.1.5.3.1. Market Estimation, 2013 – 2018
9.2.1.5.3.2. Market Forecast, 2019 – 2027
9.2.1.5.4. Middle East and Africa
9.2.1.5.4.1. Market Estimation, 2013 – 2018
9.2.1.5.4.2. Market Forecast, 2019 – 2027
9.2.1.5.5. Latin America
9.2.1.5.5.1. Market Estimation, 2013 – 2018
9.2.1.5.5.2. Market Forecast, 2019 – 2027
9.2.2. E-commerce
stores
9.2.2.1. Definition
9.2.2.2. Market Estimation and Penetration, 2013 – 2018
9.2.2.3. Market Forecast, 2019 – 2027
9.2.2.4. Compound Annual Growth Rate (CAGR)
9.2.2.5. Regional Bifurcation
9.2.2.5.1. North America
9.2.2.5.1.1. Market Estimation, 2013 – 2018
9.2.2.5.1.2. Market Forecast, 2019 – 2027
9.2.2.5.2. Europe
9.2.2.5.2.1. Market Estimation, 2013 – 2018
9.2.2.5.2.2. Market Forecast, 2019 – 2027
9.2.2.5.3. Asia Pacific
9.2.2.5.3.1. Market Estimation, 2013 – 2018
9.2.2.5.3.2. Market Forecast, 2019 – 2027
9.2.2.5.4. Middle East and Africa
9.2.2.5.4.1. Market Estimation, 2013 – 2018
9.2.2.5.4.2. Market Forecast, 2019 – 2027
9.2.2.5.5. Latin America
9.2.2.5.5.1. Market Estimation, 2013 – 2018
9.2.2.5.5.2. Market Forecast, 2019 – 2027
9.2.3. Offline
stores
9.2.3.1. Definition
9.2.3.2. Market Estimation and Penetration, 2013 – 2018
9.2.3.3. Market Forecast, 2019 – 2027
9.2.3.4. Compound Annual Growth Rate (CAGR)
9.2.3.5. Regional Bifurcation
9.2.3.5.1. North America
9.2.3.5.1.1. Market Estimation, 2013 – 2018
9.2.3.5.1.2. Market Forecast, 2019 – 2027
9.2.3.5.2. Europe
9.2.3.5.2.1. Market Estimation, 2013 – 2018
9.2.3.5.2.2. Market Forecast, 2019 – 2027
9.2.3.5.3. Asia Pacific
9.2.3.5.3.1. Market Estimation, 2013 – 2018
9.2.3.5.3.2. Market Forecast, 2019 – 2027
9.2.3.5.4. Middle East and Africa
9.2.3.5.4.1. Market Estimation, 2013 – 2018
9.2.3.5.4.2. Market Forecast, 2019 – 2027
9.2.3.5.5. Latin America
9.2.3.5.5.1. Market Estimation, 2013 – 2018
9.2.3.5.5.2. Market Forecast, 2019 – 2027
9.3. Key
Segment for Channeling Investments
9.3.1. By
Distribution Channel
10. Global
Squalene Market Analysis and Forecasts, 2019 – 2027
10.1. Overview
10.2. Global
Squalene Market Revenue (US$ Mn) and Forecasts, By Source
10.2.1. Animal
10.2.1.1. Definition
10.2.1.2. Market Estimation and Penetration, 2013 – 2018
10.2.1.3. Market Forecast, 2019 – 2027
10.2.1.4. Compound Annual Growth Rate (CAGR)
10.2.1.5. Regional Bifurcation
10.2.1.5.1. North America
10.2.1.5.1.1.
Market Estimation, 2013 – 2018
10.2.1.5.1.2.
Market Forecast, 2019 – 2027
10.2.1.5.2. Europe
10.2.1.5.2.1.
Market Estimation, 2013 – 2018
10.2.1.5.2.2.
Market Forecast, 2019 – 2027
10.2.1.5.3. Asia Pacific
10.2.1.5.3.1.
Market Estimation, 2013 – 2018
10.2.1.5.3.2.
Market Forecast, 2019 – 2027
10.2.1.5.4. Middle East and Africa
10.2.1.5.4.1.
Market Estimation, 2013 – 2018
10.2.1.5.4.2.
Market Forecast, 2019 – 2027
10.2.1.5.5. Latin America
10.2.1.5.5.1.
Market Estimation, 2013 – 2018
10.2.1.5.5.2.
Market Forecast, 2019 – 2027
10.2.2. Plant
10.2.2.1. Definition
10.2.2.2. Market Estimation and Penetration, 2013 – 2018
10.2.2.3. Market Forecast, 2019 – 2027
10.2.2.4. Compound Annual Growth Rate (CAGR)
10.2.2.5. Regional Bifurcation
10.2.2.5.1. North America
10.2.2.5.1.1.
Market Estimation, 2013 – 2018
10.2.2.5.1.2.
Market Forecast, 2019 – 2027
10.2.2.5.2. Europe
10.2.2.5.2.1.
Market Estimation, 2013 – 2018
10.2.2.5.2.2.
Market Forecast, 2019 – 2027
10.2.2.5.3. Asia Pacific
10.2.2.5.3.1.
Market Estimation, 2013 – 2018
10.2.2.5.3.2.
Market Forecast, 2019 – 2027
10.2.2.5.4. Middle East and Africa
10.2.2.5.4.1.
Market Estimation, 2013 – 2018
10.2.2.5.4.2.
Market Forecast, 2019 – 2027
10.2.2.5.5. Latin America
10.2.2.5.5.1.
Market Estimation, 2013 – 2018
10.2.2.5.5.2.
Market Forecast, 2019 – 2027
10.2.3. Synthetic
10.2.3.1. Definition
10.2.3.2. Market Estimation and Penetration, 2013 – 2018
10.2.3.3. Market Forecast, 2019 – 2027
10.2.3.4. Compound Annual Growth Rate (CAGR)
10.2.3.5. Regional Bifurcation
10.2.3.5.1. North America
10.2.3.5.1.1.
Market Estimation, 2013 – 2018
10.2.3.5.1.2.
Market Forecast, 2019 – 2027
10.2.3.5.2. Europe
10.2.3.5.2.1.
Market Estimation, 2013 – 2018
10.2.3.5.2.2.
Market Forecast, 2019 – 2027
10.2.3.5.3. Asia Pacific
10.2.3.5.3.1.
Market Estimation, 2013 – 2018
10.2.3.5.3.2.
Market Forecast, 2019 – 2027
10.2.3.5.4. Middle East and Africa
10.2.3.5.4.1.
Market Estimation, 2013 – 2018
10.2.3.5.4.2.
Market Forecast, 2019 – 2027
10.2.3.5.5. Latin America
10.2.3.5.5.1.
Market Estimation, 2013 – 2018
10.2.3.5.5.2.
Market Forecast, 2019 – 2027
10.3. Key
Segment for Channeling Investments
10.3.1. By
Source
11. North
America Squalene Market Analysis and Forecasts, 2019 - 2027
11.1. Overview
11.1.1. North
America Squalene Market Revenue (US$ Mn)
11.2. North
America Squalene Market Revenue (US$ Mn) and Forecasts, By End-use Product
Categories
11.2.1. Cosmetics
11.2.2. Pharmaceuticals
11.2.3. Nutraceuticals
11.2.4. Vaccine
11.2.5. Others
11.3. North
America Squalene Market Revenue (US$ Mn) and Forecasts, By Distribution Channel
11.3.1. Retail
Chemists
11.3.2. E-commerce
stores
11.3.3. Offline
stores
11.4. North
America Squalene Market Revenue (US$ Mn) and Forecasts, By Source
11.4.1. Animal
11.4.2. Plant
11.4.3. Synthetic
11.5. North
America Squalene Market Revenue (US$ Mn) and Forecasts, By Country
11.5.1. U.S
11.5.1.1. U.S Squalene Market Revenue (US$ Mn) and Forecasts, By End-use
Product Categories
11.5.1.1.1. Cosmetics
11.5.1.1.2. Pharmaceuticals
11.5.1.1.3. Nutraceuticals
11.5.1.1.4. Vaccine
11.5.1.1.5. Others
11.5.1.2. U.S Squalene Market Revenue (US$ Mn) and Forecasts, By
Distribution Channel
11.5.1.2.1. Retail Chemists
11.5.1.2.2. E-commerce stores
11.5.1.2.3. Offline stores
11.5.1.3. U.S Squalene Market Revenue (US$ Mn) and Forecasts, By Source
11.5.1.3.1. Animal
11.5.1.3.2. Plant
11.5.1.3.3. Synthetic
11.5.2. Canada
11.5.2.1. Canada Squalene Market Revenue (US$ Mn) and Forecasts, By
End-use Product Categories
11.5.2.1.1. Cosmetics
11.5.2.1.2. Pharmaceuticals
11.5.2.1.3. Nutraceuticals
11.5.2.1.4. Vaccine
11.5.2.1.5. Others
11.5.2.2. Canada Squalene Market Revenue (US$ Mn) and Forecasts, By
Distribution Channel
11.5.2.2.1. Retail Chemists
11.5.2.2.2. E-commerce stores
11.5.2.2.3. Offline stores
11.5.2.3. Canada Squalene Market Revenue (US$ Mn) and Forecasts, By
Source
11.5.2.3.1. Animal
11.5.2.3.2. Plant
11.5.2.3.3. Synthetic
11.5.3. Mexico
11.5.3.1. Mexico Squalene Market Revenue (US$ Mn) and Forecasts, By
End-use Product Categories
11.5.3.1.1. Cosmetics
11.5.3.1.2. Pharmaceuticals
11.5.3.1.3. Nutraceuticals
11.5.3.1.4. Vaccine
11.5.3.1.5. Others
11.5.3.2. Mexico Squalene Market Revenue (US$ Mn) and Forecasts, By
Distribution Channel
11.5.3.2.1. Retail Chemists
11.5.3.2.2. E-commerce stores
11.5.3.2.3. Offline stores
11.5.3.3. Mexico Squalene Market Revenue (US$ Mn) and Forecasts, By
Source
11.5.3.3.1. Animal
11.5.3.3.2. Plant
11.5.3.3.3. Synthetic
11.5.4. Rest of
North America
11.5.4.1. Rest of North America Squalene Market Revenue (US$ Mn) and
Forecasts, By End-use Product Categories
11.5.4.1.1. Cosmetics
11.5.4.1.2. Pharmaceuticals
11.5.4.1.3. Nutraceuticals
11.5.4.1.4. Vaccine
11.5.4.1.5. Others
11.5.4.2. Rest of North America Squalene Market Revenue (US$ Mn) and
Forecasts, By Distribution Channel
11.5.4.2.1. Retail Chemists
11.5.4.2.2. E-commerce stores
11.5.4.2.3. Offline stores
11.5.4.3. Rest of North America Squalene Market Revenue (US$ Mn) and
Forecasts, By Source
11.5.4.3.1. Animal
11.5.4.3.2. Plant
11.5.4.3.3. Synthetic
11.6. Key
Segment for Channeling Investments
11.6.1. By
Country
11.6.2. By
End-use Product Categories
11.6.3. By
Distribution Channel
11.6.4. By
Source
12. Europe
Squalene Market Analysis and Forecasts, 2019 - 2027
12.1. Overview
12.1.1. Europe
Squalene Market Revenue (US$ Mn)
12.2. Europe
Squalene Market Revenue (US$ Mn) and Forecasts, By End-use Product Categories
12.2.1. Cosmetics
12.2.2. Pharmaceuticals
12.2.3. Nutraceuticals
12.2.4. Vaccine
12.2.5. Others
12.3. Europe
Squalene Market Revenue (US$ Mn) and Forecasts, By Distribution Channel
12.3.1. Retail
Chemists
12.3.2. E-commerce
stores
12.3.3. Offline
stores
12.4. Europe
Squalene Market Revenue (US$ Mn) and Forecasts, By Source
12.4.1. Animal
12.4.2. Plant
12.4.3. Synthetic
12.5. Europe
Squalene Market Revenue (US$ Mn) and Forecasts, By Country
12.5.1. France
12.5.1.1. France Squalene Market Revenue (US$ Mn) and Forecasts, By
End-use Product Categories
12.5.1.1.1. Cosmetics
12.5.1.1.2. Pharmaceuticals
12.5.1.1.3. Nutraceuticals
12.5.1.1.4. Vaccine
12.5.1.1.5. Others
12.5.1.2. France Squalene Market Revenue (US$ Mn) and Forecasts, By
Distribution Channel
12.5.1.2.1. Retail Chemists
12.5.1.2.2. E-commerce stores
12.5.1.2.3. Offline stores
12.5.1.3. France Squalene Market Revenue (US$ Mn) and Forecasts, By
Source
12.5.1.3.1. Animal
12.5.1.3.2. Plant
12.5.1.3.3. Synthetic
12.5.2. The UK
12.5.2.1. The UK Squalene Market Revenue (US$ Mn) and Forecasts, By
End-use Product Categories
12.5.2.1.1. Cosmetics
12.5.2.1.2. Pharmaceuticals
12.5.2.1.3. Nutraceuticals
12.5.2.1.4. Vaccine
12.5.2.1.5. Others
12.5.2.2. The UK Squalene Market Revenue (US$ Mn) and Forecasts, By
Distribution Channel
12.5.2.2.1. Retail Chemists
12.5.2.2.2. E-commerce stores
12.5.2.2.3. Offline stores
12.5.2.3. The UK Squalene Market Revenue (US$ Mn) and Forecasts, By
Source
12.5.2.3.1. Animal
12.5.2.3.2. Plant
12.5.2.3.3. Synthetic
12.5.3. Spain
12.5.3.1. Spain Squalene Market Revenue (US$ Mn) and Forecasts, By
End-use Product Categories
12.5.3.1.1. Cosmetics
12.5.3.1.2. Pharmaceuticals
12.5.3.1.3. Nutraceuticals
12.5.3.1.4. Vaccine
12.5.3.1.5. Others
12.5.3.2. Spain Squalene Market Revenue (US$ Mn) and Forecasts, By
Distribution Channel
12.5.3.2.1. Retail Chemists
12.5.3.2.2. E-commerce stores
12.5.3.2.3. Offline stores
12.5.3.3. Spain Squalene Market Revenue (US$ Mn) and Forecasts, By
Source
12.5.3.3.1. Animal
12.5.3.3.2. Plant
12.5.3.3.3. Synthetic
12.5.4. Germany
12.5.4.1. Germany Squalene Market Revenue (US$ Mn) and Forecasts, By
End-use Product Categories
12.5.4.1.1. Cosmetics
12.5.4.1.2. Pharmaceuticals
12.5.4.1.3. Nutraceuticals
12.5.4.1.4. Vaccine
12.5.4.1.5. Others
12.5.4.2. Germany Squalene Market Revenue (US$ Mn) and Forecasts, By
Distribution Channel
12.5.4.2.1. Retail Chemists
12.5.4.2.2. E-commerce stores
12.5.4.2.3. Offline stores
12.5.4.3. Germany Squalene Market Revenue (US$ Mn) and Forecasts, By
Source
12.5.4.3.1. Animal
12.5.4.3.2. Plant
12.5.4.3.3. Synthetic
12.5.5. Italy
12.5.5.1. Italy Squalene Market Revenue (US$ Mn) and Forecasts, By
End-use Product Categories
12.5.5.1.1. Cosmetics
12.5.5.1.2. Pharmaceuticals
12.5.5.1.3. Nutraceuticals
12.5.5.1.4. Vaccine
12.5.5.1.5. Others
12.5.5.2. Italy Squalene Market Revenue (US$ Mn) and Forecasts, By
Distribution Channel
12.5.5.2.1. Retail Chemists
12.5.5.2.2. E-commerce stores
12.5.5.2.3. Offline stores
12.5.5.3. Italy Squalene Market Revenue (US$ Mn) and Forecasts, By
Source
12.5.5.3.1. Animal
12.5.5.3.2. Plant
12.5.5.3.3. Synthetic
12.5.6. Nordic
Countries
12.5.6.1. Nordic Countries Squalene Market Revenue (US$ Mn) and
Forecasts, By End-use Product Categories
12.5.6.1.1. Cosmetics
12.5.6.1.2. Pharmaceuticals
12.5.6.1.3. Nutraceuticals
12.5.6.1.4. Vaccine
12.5.6.1.5. Others
12.5.6.2. Nordic Countries Squalene Market Revenue (US$ Mn) and
Forecasts, By Distribution Channel
12.5.6.2.1. Retail Chemists
12.5.6.2.2. E-commerce stores
12.5.6.2.3. Offline stores
12.5.6.3. Nordic Countries Squalene Market Revenue (US$ Mn) and Forecasts,
By Source
12.5.6.3.1. Animal
12.5.6.3.2. Plant
12.5.6.3.3. Synthetic
12.5.6.4. Nordic Countries Squalene Market Revenue (US$ Mn) and
Forecasts, By Country
12.5.6.4.1. Denmark
12.5.6.4.2. Finland
12.5.6.4.3. Iceland
12.5.6.4.4. Sweden
12.5.6.4.5. Norway
12.5.7. Benelux
Union
12.5.7.1. Benelux Union Squalene Market Revenue (US$ Mn) and Forecasts,
By End-use Product Categories
12.5.7.1.1. Cosmetics
12.5.7.1.2. Pharmaceuticals
12.5.7.1.3. Nutraceuticals
12.5.7.1.4. Vaccine
12.5.7.1.5. Others
12.5.7.2. Benelux Union Squalene Market Revenue (US$ Mn) and Forecasts,
By Distribution Channel
12.5.7.2.1. Retail Chemists
12.5.7.2.2. E-commerce stores
12.5.7.2.3. Offline stores
12.5.7.3. Benelux Union Squalene Market Revenue (US$ Mn) and Forecasts,
By Source
12.5.7.3.1. Animal
12.5.7.3.2. Plant
12.5.7.3.3. Synthetic
12.5.7.4. Benelux Union Squalene Market Revenue (US$ Mn) and Forecasts,
By Country
12.5.7.4.1. Belgium
12.5.7.4.2. The Netherlands
12.5.7.4.3. Luxembourg
12.5.8. Rest of
Europe
12.5.8.1. Rest of Europe Squalene Market Revenue (US$ Mn) and Forecasts,
By End-use Product Categories
12.5.8.1.1. Cosmetics
12.5.8.1.2. Pharmaceuticals
12.5.8.1.3. Nutraceuticals
12.5.8.1.4. Vaccine
12.5.8.1.5. Others
12.5.8.2. Rest of Europe Squalene Market Revenue (US$ Mn) and Forecasts,
By Distribution Channel
12.5.8.2.1. Retail Chemists
12.5.8.2.2. E-commerce stores
12.5.8.2.3. Offline stores
12.5.8.3. Rest of Europe Squalene Market Revenue (US$ Mn) and Forecasts,
By Source
12.5.8.3.1. Animal
12.5.8.3.2. Plant
12.5.8.3.3. Synthetic
12.6. Key
Segment for Channeling Investments
12.6.1. By
Country
12.6.2. By
End-use Product Categories
12.6.3. By
Distribution Channel
12.6.4. By
Source
13. Asia
Pacific Squalene Market Analysis and Forecasts, 2019 - 2027
13.1. Overview
13.1.1. Asia
Pacific Squalene Market Revenue (US$ Mn)
13.2. Asia
Pacific Squalene Market Revenue (US$ Mn) and Forecasts, By End-use Product
Categories
13.2.1. Cosmetics
13.2.2. Pharmaceuticals
13.2.3. Nutraceuticals
13.2.4. Vaccine
13.2.5. Others
13.3. Asia
Pacific Squalene Market Revenue (US$ Mn) and Forecasts, By Distribution Channel
13.3.1. Retail
Chemists
13.3.2. E-commerce
stores
13.3.3. Offline
stores
13.4. Asia
Pacific Squalene Market Revenue (US$ Mn) and Forecasts, By Source
13.4.1. Animal
13.4.2. Plant
13.4.3. Synthetic
13.5. Asia
Pacific Squalene Market Revenue (US$ Mn) and Forecasts, By Country
13.5.1. China
13.5.1.1. China Squalene Market Revenue (US$ Mn) and Forecasts, By
End-use Product Categories
13.5.1.1.1. Cosmetics
13.5.1.1.2. Pharmaceuticals
13.5.1.1.3. Nutraceuticals
13.5.1.1.4. Vaccine
13.5.1.1.5. Others
13.5.1.2. China Squalene Market Revenue (US$ Mn) and Forecasts, By
Distribution Channel
13.5.1.2.1. Retail Chemists
13.5.1.2.2. E-commerce stores
13.5.1.2.3. Offline stores
13.5.1.3. China Squalene Market Revenue (US$ Mn) and Forecasts, By
Source
13.5.1.3.1. Animal
13.5.1.3.2. Plant
13.5.1.3.3. Synthetic
13.5.2. Japan
13.5.2.1. Japan Squalene Market Revenue (US$ Mn) and Forecasts, By
End-use Product Categories
13.5.2.1.1. Cosmetics
13.5.2.1.2. Pharmaceuticals
13.5.2.1.3. Nutraceuticals
13.5.2.1.4. Vaccine
13.5.2.1.5. Others
13.5.2.2. Japan Squalene Market Revenue (US$ Mn) and Forecasts, By Distribution
Channel
13.5.2.2.1. Retail Chemists
13.5.2.2.2. E-commerce stores
13.5.2.2.3. Offline stores
13.5.2.3. Japan Squalene Market Revenue (US$ Mn) and Forecasts, By
Source
13.5.2.3.1. Animal
13.5.2.3.2. Plant
13.5.2.3.3. Synthetic
13.5.3. India
13.5.3.1. India Squalene Market Revenue (US$ Mn) and Forecasts, By
End-use Product Categories
13.5.3.1.1. Cosmetics
13.5.3.1.2. Pharmaceuticals
13.5.3.1.3. Nutraceuticals
13.5.3.1.4. Vaccine
13.5.3.1.5. Others
13.5.3.2. India Squalene Market Revenue (US$ Mn) and Forecasts, By
Distribution Channel
13.5.3.2.1. Retail Chemists
13.5.3.2.2. E-commerce stores
13.5.3.2.3. Offline stores
13.5.3.3. India Squalene Market Revenue (US$ Mn) and Forecasts, By
Source
13.5.3.3.1. Animal
13.5.3.3.2. Plant
13.5.3.3.3. Synthetic
13.5.4. New
Zealand
13.5.4.1. New Zealand Squalene Market Revenue (US$ Mn) and Forecasts, By
End-use Product Categories
13.5.4.1.1. Cosmetics
13.5.4.1.2. Pharmaceuticals
13.5.4.1.3. Nutraceuticals
13.5.4.1.4. Vaccine
13.5.4.1.5. Others
13.5.4.2. New Zealand Squalene Market Revenue (US$ Mn) and Forecasts, By
Distribution Channel
13.5.4.2.1. Retail Chemists
13.5.4.2.2. E-commerce stores
13.5.4.2.3. Offline stores
13.5.4.3. New Zealand Squalene Market Revenue (US$ Mn) and Forecasts, By
Source
13.5.4.3.1. Animal
13.5.4.3.2. Plant
13.5.4.3.3. Synthetic
13.5.5. Australia
13.5.5.1. Australia Squalene Market Revenue (US$ Mn) and Forecasts, By
End-use Product Categories
13.5.5.1.1. Cosmetics
13.5.5.1.2. Pharmaceuticals
13.5.5.1.3. Nutraceuticals
13.5.5.1.4. Vaccine
13.5.5.1.5. Others
13.5.5.2. Australia Squalene Market Revenue (US$ Mn) and Forecasts, By
Distribution Channel
13.5.5.2.1. Retail Chemists
13.5.5.2.2. E-commerce stores
13.5.5.2.3. Offline stores
13.5.5.3. Australia Squalene Market Revenue (US$ Mn) and Forecasts, By
Source
13.5.5.3.1. Animal
13.5.5.3.2. Plant
13.5.5.3.3. Synthetic
13.5.6. South
Korea
13.5.6.1. South Korea Squalene Market Revenue (US$ Mn) and Forecasts, By
End-use Product Categories
13.5.6.1.1. Cosmetics
13.5.6.1.2. Pharmaceuticals
13.5.6.1.3. Nutraceuticals
13.5.6.1.4. Vaccine
13.5.6.1.5. Others
13.5.6.2. South Korea Squalene Market Revenue (US$ Mn) and Forecasts, By
Distribution Channel
13.5.6.2.1. Retail Chemists
13.5.6.2.2. E-commerce stores
13.5.6.2.3. Offline stores
13.5.6.3. South Korea Squalene Market Revenue (US$ Mn) and Forecasts, By
Source
13.5.6.3.1. Animal
13.5.6.3.2. Plant
13.5.6.3.3. Synthetic
13.5.7. Southeast
Asia
13.5.7.1. Southeast Asia Squalene Market Revenue (US$ Mn) and Forecasts,
By End-use Product Categories
13.5.7.1.1. Cosmetics
13.5.7.1.2. Pharmaceuticals
13.5.7.1.3. Nutraceuticals
13.5.7.1.4. Vaccine
13.5.7.1.5. Others
13.5.7.2. Southeast Asia Squalene Market Revenue (US$ Mn) and Forecasts,
By Distribution Channel
13.5.7.2.1. Retail Chemists
13.5.7.2.2. E-commerce stores
13.5.7.2.3. Offline stores
13.5.7.3. Southeast Asia Squalene Market Revenue (US$ Mn) and Forecasts,
By Source
13.5.7.3.1. Animal
13.5.7.3.2. Plant
13.5.7.3.3. Synthetic
13.5.7.4. Southeast Asia Squalene Market Revenue (US$ Mn) and Forecasts,
By Country
13.5.7.4.1. Indonesia
13.5.7.4.2. Thailand
13.5.7.4.3. Malaysia
13.5.7.4.4. Singapore
13.5.7.4.5. Rest of Southeast Asia
13.5.8. Rest of
Asia Pacific
13.5.8.1. Rest of Asia Pacific Squalene Market Revenue (US$ Mn) and
Forecasts, By End-use Product Categories
13.5.8.1.1. Cosmetics
13.5.8.1.2. Pharmaceuticals
13.5.8.1.3. Nutraceuticals
13.5.8.1.4. Vaccine
13.5.8.1.5. Others
13.5.8.2. Rest of Asia Pacific Squalene Market Revenue (US$ Mn) and
Forecasts, By Distribution Channel
13.5.8.2.1. Retail Chemists
13.5.8.2.2. E-commerce stores
13.5.8.2.3. Offline stores
13.5.8.3. Rest of Asia Pacific Squalene Market Revenue (US$ Mn) and
Forecasts, By Source
13.5.8.3.1. Animal
13.5.8.3.2. Plant
13.5.8.3.3. Synthetic
13.6. Key
Segment for Channeling Investments
13.6.1. By
Country
13.6.2. By
End-use Product Categories
13.6.3. By
Distribution Channel
13.6.4. By
Source
14. Middle
East and Africa Squalene Market Analysis and Forecasts, 2019 - 2027
14.1. Overview
14.1.1. Middle
East and Africa Squalene Market Revenue (US$ Mn)
14.2. Middle
East and Africa Squalene Market Revenue (US$ Mn) and Forecasts, By End-use
Product Categories
14.2.1. Cosmetics
14.2.2. Pharmaceuticals
14.2.3. Nutraceuticals
14.2.4. Vaccine
14.2.5. Others
14.3. Middle
East and Africa Squalene Market Revenue (US$ Mn) and Forecasts, By Distribution
Channel
14.3.1. Retail
Chemists
14.3.2. E-commerce
stores
14.3.3. Offline
stores
14.4. Middle
East and Africa Squalene Market Revenue (US$ Mn) and Forecasts, By Source
14.4.1. Animal
14.4.2. Plant
14.4.3. Synthetic
14.5. Middle
East and Africa Squalene Market Revenue (US$ Mn) and Forecasts, By Country
14.5.1. Saudi
Arabia
14.5.1.1. Saudi Arabia Squalene Market Revenue (US$ Mn) and Forecasts,
By End-use Product Categories
14.5.1.1.1. Cosmetics
14.5.1.1.2. Pharmaceuticals
14.5.1.1.3. Nutraceuticals
14.5.1.1.4. Vaccine
14.5.1.1.5. Others
14.5.1.2. Saudi Arabia Squalene Market Revenue (US$ Mn) and Forecasts,
By Distribution Channel
14.5.1.2.1. Retail Chemists
14.5.1.2.2. E-commerce stores
14.5.1.2.3. Offline stores
14.5.1.3. Saudi Arabia Squalene Market Revenue (US$ Mn) and Forecasts,
By Source
14.5.1.3.1. Animal
14.5.1.3.2. Plant
14.5.1.3.3. Synthetic
14.5.2. UAE
14.5.2.1. UAE Squalene Market Revenue (US$ Mn) and Forecasts, By End-use
Product Categories
14.5.2.1.1. Cosmetics
14.5.2.1.2. Pharmaceuticals
14.5.2.1.3. Nutraceuticals
14.5.2.1.4. Vaccine
14.5.2.1.5. Others
14.5.2.2. UAE Squalene Market Revenue (US$ Mn) and Forecasts, By
Distribution Channel
14.5.2.2.1. Retail Chemists
14.5.2.2.2. E-commerce stores
14.5.2.2.3. Offline stores
14.5.2.3. UAE Squalene Market Revenue (US$ Mn) and Forecasts, By Source
14.5.2.3.1. Animal
14.5.2.3.2. Plant
14.5.2.3.3. Synthetic
14.5.3. Egypt
14.5.3.1. Egypt Squalene Market Revenue (US$ Mn) and Forecasts, By
End-use Product Categories
14.5.3.1.1. Cosmetics
14.5.3.1.2. Pharmaceuticals
14.5.3.1.3. Nutraceuticals
14.5.3.1.4. Vaccine
14.5.3.1.5. Others
14.5.3.2. Egypt Squalene Market Revenue (US$ Mn) and Forecasts, By
Distribution Channel
14.5.3.2.1. Retail Chemists
14.5.3.2.2. E-commerce stores
14.5.3.2.3. Offline stores
14.5.3.3. Egypt Squalene Market Revenue (US$ Mn) and Forecasts, By
Source
14.5.3.3.1. Animal
14.5.3.3.2. Plant
14.5.3.3.3. Synthetic
14.5.4. Kuwait
14.5.4.1. Kuwait Squalene Market Revenue (US$ Mn) and Forecasts, By
End-use Product Categories
14.5.4.1.1. Cosmetics
14.5.4.1.2. Pharmaceuticals
14.5.4.1.3. Nutraceuticals
14.5.4.1.4. Vaccine
14.5.4.1.5. Others
14.5.4.2. Kuwait Squalene Market Revenue (US$ Mn) and Forecasts, By
Distribution Channel
14.5.4.2.1. Retail Chemists
14.5.4.2.2. E-commerce stores
14.5.4.2.3. Offline stores
14.5.4.3. Kuwait Squalene Market Revenue (US$ Mn) and Forecasts, By
Source
14.5.4.3.1. Animal
14.5.4.3.2. Plant
14.5.4.3.3. Synthetic
14.5.5. South
Africa
14.5.5.1. South Africa Squalene Market Revenue (US$ Mn) and Forecasts,
By End-use Product Categories
14.5.5.1.1. Cosmetics
14.5.5.1.2. Pharmaceuticals
14.5.5.1.3. Nutraceuticals
14.5.5.1.4. Vaccine
14.5.5.1.5. Others
14.5.5.2. South Africa Squalene Market Revenue (US$ Mn) and Forecasts,
By Distribution Channel
14.5.5.2.1. Retail Chemists
14.5.5.2.2. E-commerce stores
14.5.5.2.3. Offline stores
14.5.5.3. South Africa Squalene Market Revenue (US$ Mn) and Forecasts,
By Source
14.5.5.3.1. Animal
14.5.5.3.2. Plant
14.5.5.3.3. Synthetic
14.5.6. Rest of
Middle East & Africa
14.5.6.1. Rest of Middle East & Africa Squalene Market Revenue (US$
Mn) and Forecasts, By End-use Product Categories
14.5.6.1.1. Cosmetics
14.5.6.1.2. Pharmaceuticals
14.5.6.1.3. Nutraceuticals
14.5.6.1.4. Vaccine
14.5.6.1.5. Others
14.5.6.2. Rest of Middle East & Africa Squalene Market Revenue (US$
Mn) and Forecasts, By Distribution Channel
14.5.6.2.1. Retail Chemists
14.5.6.2.2. E-commerce stores
14.5.6.2.3. Offline stores
14.5.6.3. Rest of Middle East & Africa Squalene Market Revenue (US$
Mn) and Forecasts, By Source
14.5.6.3.1. Animal
14.5.6.3.2. Plant
14.5.6.3.3. Synthetic
14.6. Key
Segment for Channeling Investments
14.6.1. By
Country
14.6.2. By
End-use Product Categories
14.6.3. By
Distribution Channel
14.6.4. By
Source
15. Latin
America Squalene Market Analysis and Forecasts, 2019 - 2027
15.1. Overview
15.1.1. Latin
America Squalene Market Revenue (US$ Mn)
15.2. Latin
America Squalene Market Revenue (US$ Mn) and Forecasts, By End-use Product
Categories
15.2.1. Cosmetics
15.2.2. Pharmaceuticals
15.2.3. Nutraceuticals
15.2.4. Vaccine
15.2.5. Others
15.3. Latin
America Squalene Market Revenue (US$ Mn) and Forecasts, By Distribution Channel
15.3.1. Retail
Chemists
15.3.2. E-commerce
stores
15.3.3. Offline
stores
15.4. Latin
America Squalene Market Revenue (US$ Mn) and Forecasts, By Source
15.4.1. Animal
15.4.2. Plant
15.4.3. Synthetic
15.5. Latin
America Squalene Market Revenue (US$ Mn) and Forecasts, By Country
15.5.1. Brazil
15.5.1.1. Brazil Squalene Market Revenue (US$ Mn) and Forecasts, By
End-use Product Categories
15.5.1.1.1. Cosmetics
15.5.1.1.2. Pharmaceuticals
15.5.1.1.3. Nutraceuticals
15.5.1.1.4. Vaccine
15.5.1.1.5. Others
15.5.1.2. Brazil Squalene Market Revenue (US$ Mn) and Forecasts, By
Distribution Channel
15.5.1.2.1. Retail Chemists
15.5.1.2.2. E-commerce stores
15.5.1.2.3. Offline stores
15.5.1.3. Brazil Squalene Market Revenue (US$ Mn) and Forecasts, By
Source
15.5.1.3.1. Animal
15.5.1.3.2. Plant
15.5.1.3.3. Synthetic
15.5.2. Argentina
15.5.2.1. Argentina Squalene Market Revenue (US$ Mn) and Forecasts, By
End-use Product Categories
15.5.2.1.1. Cosmetics
15.5.2.1.2. Pharmaceuticals
15.5.2.1.3. Nutraceuticals
15.5.2.1.4. Vaccine
15.5.2.1.5. Others
15.5.2.2. Argentina Squalene Market Revenue (US$ Mn) and Forecasts, By
Distribution Channel
15.5.2.2.1. Retail Chemists
15.5.2.2.2. E-commerce stores
15.5.2.2.3. Offline stores
15.5.2.3. Argentina Squalene Market Revenue (US$ Mn) and Forecasts, By
Source
15.5.2.3.1. Animal
15.5.2.3.2. Plant
15.5.2.3.3. Synthetic
15.5.3. Rest of
Latin America
15.5.3.1. Rest of Latin America Squalene Market Revenue (US$ Mn) and
Forecasts, By End-use Product Categories
15.5.3.1.1. Cosmetics
15.5.3.1.2. Pharmaceuticals
15.5.3.1.3. Nutraceuticals
15.5.3.1.4. Vaccine
15.5.3.1.5. Others
15.5.3.2. Rest of Latin America Squalene Market Revenue (US$ Mn) and
Forecasts, By Distribution Channel
15.5.3.2.1. Retail Chemists
15.5.3.2.2. E-commerce stores
15.5.3.2.3. Offline stores
15.5.3.3. Rest of Latin America Squalene Market Revenue (US$ Mn) and
Forecasts, By Source
15.5.3.3.1. Animal
15.5.3.3.2. Plant
15.5.3.3.3. Synthetic
15.6. Key
Segment for Channeling Investments
15.6.1. By
Country
15.6.2. By
End-use Product Categories
15.6.3. By
Distribution Channel
15.6.4. By
Source
16. Competitive
Benchmarking
16.1. Brand
Benchmarking
16.2. Market
Share Analysis, 2018
16.3. Global
Presence and Growth Strategies
16.3.1. Mergers
and Acquisitions
16.3.2. Product
Launches
16.3.3. Investments
Trends
16.3.4. R&D
Initiatives
17. Player
Profiles
17.1. Amyris
17.1.1. Company
Details
17.1.2. Company
Overview
17.1.3. Product
Offerings
17.1.4. Key
Developments
17.1.5. Financial
Analysis
17.1.6. SWOT
Analysis
17.1.7. Business
Strategies
17.2. Arbee
17.2.1. Company
Details
17.2.2. Company
Overview
17.2.3. Product
Offerings
17.2.4. Key
Developments
17.2.5. Financial
Analysis
17.2.6. SWOT
Analysis
17.2.7. Business
Strategies
17.3. Arista
Industries Inc.
17.3.1. Company
Details
17.3.2. Company
Overview
17.3.3. Product
Offerings
17.3.4. Key
Developments
17.3.5. Financial
Analysis
17.3.6. SWOT
Analysis
17.3.7. Business
Strategies
17.4. Bawa
Fishmeal & Oil Co.
17.4.1. Company
Details
17.4.2. Company
Overview
17.4.3. Product
Offerings
17.4.4. Key
Developments
17.4.5. Financial
Analysis
17.4.6. SWOT
Analysis
17.4.7. Business
Strategies
17.5. ChemFaces
17.5.1. Company
Details
17.5.2. Company
Overview
17.5.3. Product
Offerings
17.5.4. Key
Developments
17.5.5. Financial
Analysis
17.5.6. SWOT
Analysis
17.5.7. Business
Strategies
17.6. Empressa
Figueirrense de Pesca
17.6.1. Company
Details
17.6.2. Company
Overview
17.6.3. Product
Offerings
17.6.4. Key
Developments
17.6.5. Financial
Analysis
17.6.6. SWOT
Analysis
17.6.7. Business
Strategies
17.7. Jedwards
International, Inc.
17.7.1. Company
Details
17.7.2. Company
Overview
17.7.3. Product
Offerings
17.7.4. Key
Developments
17.7.5. Financial
Analysis
17.7.6. SWOT
Analysis
17.7.7. Business
Strategies
17.8. Kishimoto
Special Liver Oil Co. Ltd.
17.8.1. Company
Details
17.8.2. Company
Overview
17.8.3. Product
Offerings
17.8.4. Key
Developments
17.8.5. Financial
Analysis
17.8.6. SWOT
Analysis
17.8.7. Business
Strategies
17.9. Lýsi hf.
17.9.1. Company
Details
17.9.2. Company
Overview
17.9.3. Product
Offerings
17.9.4. Key
Developments
17.9.5. Financial
Analysis
17.9.6. SWOT
Analysis
17.9.7. Business
Strategies
17.10. Merck
KGaA
17.10.1. Company
Details
17.10.2. Company
Overview
17.10.3. Product
Offerings
17.10.4. Key
Developments
17.10.5. Financial
Analysis
17.10.6. SWOT
Analysis
17.10.7. Business
Strategies
17.11. Metabolics
ltd
17.11.1. Company
Details
17.11.2. Company
Overview
17.11.3. Product
Offerings
17.11.4. Key
Developments
17.11.5. Financial
Analysis
17.11.6. SWOT
Analysis
17.11.7. Business
Strategies
17.12. Nucelis
17.12.1. Company
Details
17.12.2. Company
Overview
17.12.3. Product
Offerings
17.12.4. Key
Developments
17.12.5. Financial
Analysis
17.12.6. SWOT
Analysis
17.12.7. Business
Strategies
17.13. NZ Pure
Health
17.13.1. Company
Details
17.13.2. Company
Overview
17.13.3. Product
Offerings
17.13.4. Key
Developments
17.13.5. Financial
Analysis
17.13.6. SWOT
Analysis
17.13.7. Business
Strategies
17.14. Seadragon
17.14.1. Company
Details
17.14.2. Company
Overview
17.14.3. Product
Offerings
17.14.4. Key
Developments
17.14.5. Financial
Analysis
17.14.6. SWOT
Analysis
17.14.7. Business
Strategies
17.15. Silberhorn
17.15.1. Company
Details
17.15.2. Company
Overview
17.15.3. Product
Offerings
17.15.4. Key
Developments
17.15.5. Financial
Analysis
17.15.6. SWOT
Analysis
17.15.7. Business
Strategies
17.16. SOPHIM
17.16.1. Company
Details
17.16.2. Company
Overview
17.16.3. Product
Offerings
17.16.4. Key
Developments
17.16.5. Financial
Analysis
17.16.6. SWOT
Analysis
17.16.7. Business
Strategies
17.17. SynShark
17.17.1. Company
Details
17.17.2. Company
Overview
17.17.3. Product
Offerings
17.17.4. Key
Developments
17.17.5. Financial
Analysis
17.17.6. SWOT
Analysis
17.17.7. Business
Strategies
17.18. Other
Market Participants
18. Key
Findings
Note: This ToC is tentative
and can be changed according to the research study conducted during the course
of report completion.
**Exclusive for Multi-User and
Enterprise User.
At Absolute Markets Insights, we are engaged in building both global as well as country specific reports. As a result, the approach taken for deriving the estimation and forecast for a specific country is a bit unique and different in comparison to the global research studies. In this case, we not only study the concerned market factors & trends prevailing in a particular country (from secondary research) but we also tend to calculate the actual market size & forecast from the revenue generated from the market participants involved in manufacturing or distributing the any concerned product. These companies can also be service providers. For analyzing any country specifically, we do consider the growth factors prevailing under the states/cities/county for the same. For instance, if we are analyzing an industry specific to United States, we primarily need to study about the states present under the same(where the product/service has the highest growth). Similar analysis will be followed by other countries. Our scope of the report changes with different markets.
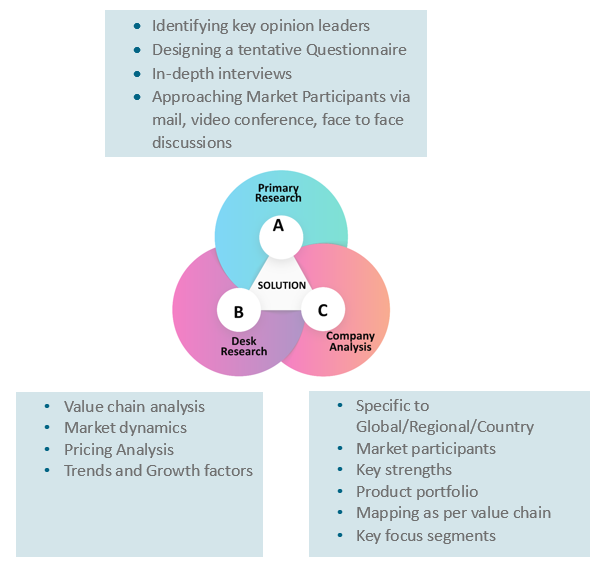
Our research study is mainly implement through a mix of both secondary and primary research. Various sources such as industry magazines, trade journals, and government websites and trade associations are reviewed for gathering precise data. Primary interviews are conducted to validate the market size derived from secondary research. Industry experts, major manufacturers and distributors are contacted for further validation purpose on the current market penetration and growth trends.
Prominent participants in our primary research process include:
- Key Opinion Leaders namely the CEOs, CSOs, VPs, purchasing managers, amongst others
- Research and development participants, distributors/suppliers and subject matter experts
Secondary Research includes data extracted from paid data sources:
- Reuters
- Factiva
- Bloomberg
- One Source
- Hoovers
Research Methodology
Key Inclusions
Why Absolute Markets Insights?
An effective strategy is the entity that influences a business to stand out of the crowd. An organization with a phenomenal strategy for success dependably has the edge over the rivals in the market. It offers the organizations a head start in planning their strategy. Absolute Market Insights is the new initiation in the industry that will furnish you with the lead your business needs. Absolute Market Insights is the best destination for your business intelligence and analytical solutions; essentially because our qualitative and quantitative sources of information are competent to give one-stop solutions. We inventively combine qualitative and quantitative research in accurate proportions to have the best report, which not only gives the most recent insights but also assists you to grow.
