Surety Bond Market By Surety Type (Construction, Bid and Performance Bonds, Advance Payment Bonds, Maintenance Bonds, Commercial Surety Bonds, Contract Surety Bonds, License and Permit Bonds, Customs Bonds, Court Bonds, Litigation Bonds including Appeal Bonds, Specialized Contract Bonds, Others); By Organization Size (Small and Medium Sized Organizations, Large Organizations); By End Users (Domestic Corporations and Multinational Companies, Marketed Through Global, National, Regional or Local Brokers, Global Multinational Companies with U.S. Bond Needs, Contractors and Managers, Paving, Sewer and Water and Highway and Bridge, Manufacturers, Technology Companies, Oil Field Service Firms, Performance Bonds (Non-Construction or Supply), Court Bonds (Judicial and Fiduciary), Mining and Material Companies, Dredgers, Pharmaceuticals, Agricultural Processors, Others); By Region (Northeast, Midwest, West, South) – United States Insights, Growth, Size, Comparative Analysis, Trends and Forecast, 2021 - 2029
Industry Trends
A surety bond is a promise, which is made to be liable for the debt, default or failure of another. A surety bond is a three-party contract by which one party, who is the surety, guarantees the obligations or performance of the second party, who is the principal to the third party. There are two main categories of the surety bonds, which include the contract surety bonds and commercial surety bonds. In the United States, there is continuously growing need for creative insurance products for the surety industry which showcases prosperous opportunity for the growth in the surety bond market in the United States. The initiatives that are being undertaken by the government of United States towards infrastructure development is furthering the adoption of surety bonds, thereby contributing towards the growth of surety bond market. However, lack of professionals with adequate skills in the surety industry of United States has been one of the key restraints in the growth of surety bond market in United States.
The novel corona virus pandemic has resulted in the death of over 2.5 million individuals across the globe. Social distancing measures have been imposed by government bodies across various countries including United States. The rapid spread of the virus has impacted the growth of the United States surety bond market. However, the surety bonds market in United States is regaining traction as the country has now started recovering from the Covid-19 pandemic, which will be bringing new opportunities for surety bond market to grow in the future years.
Surety Type Outlook:
Based on type of surety, the surety bond market is segmented into construction, bid and performance based bonds, advance payment bonds, maintenance bonds, commercial surety bonds, contract surety bonds, license and permit bonds, customs bonds, court bonds, litigation bonds, which includes appeal bonds, specialized contract bonds, along with other. The construction, bid and performance bonds surety type held the highest market in 2020. However, commercial surety bonds is estimated to witness highest growth rate over the period of next eight years owing to the goring interest among the United States surety bond market participants to explore new and more profitable venues.
Organization Size Outlook:
The United States surety bond market, on the basis of organization size is segmented into small and medium sized organizations and large size organizations. Large sized organizations proclaimed highest market share in 2020. The wide-scale investments undertaken by the large industries and international corporations in the region, has led to increased demand for surety bonds.
End Users Outlook:
Based on end users, the United States surety bond market is segmented into domestic corporations and multinational companies, marketed through global, national, regional and national brokers, global multinational companies with U.S. bond needs, contractors and managers, paving, sewer and water, highway and bridge, manufacturers, technology companies, oil field service firms, performance bonds (non-construction or supply), court bonds (judicial and fiduciary), mining and material companies, dredgers, pharmaceuticals, agricultural processors, and many others. The technology companies are estimated to witness fastest growth over the forecast period because technology is advancing continuously and for accepting new projects from the clients, there is an escalating need for surety bonds.
Regional Outlook:
United States surety bond market is geographically segmented into Northeast, Midwest, West and South regions. The West region dominated the United States region in 2020 since most of the States in the region including California, are among the main hubs for many companies of various sectors.
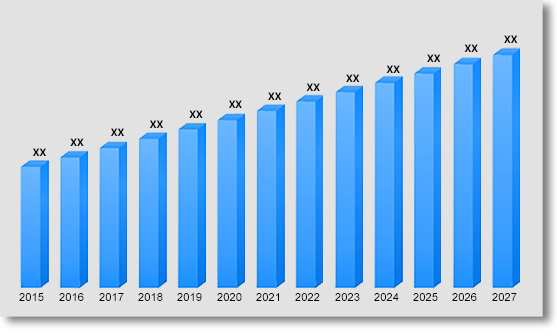
The United States surety bond market accounted for US$ 3641.3 Mn in 2020, and is expected to grow at a CAGR of above 5.8% during the forecast years (2021-2029).
United States Surety Bond Market Revenue & Forecast, (US$ Million), 2015 – 2029
Competitive Landscape
The report provides both, qualitative and quantitative research of United States surety bond market, as well as provides comprehensive insights and development methods adopted by the key contenders. The report also offers extensive research on the key players in this market and details on the competitiveness of these players. Key business strategies such as mergers and acquisitions (M&A), affiliations, collaborations, and contracts adopted by these major market participants are also recognized and analyzed in the report. For each company, the report studies their regional presence, competitors, service offerings and specification amongst others.
Some of the key companies in the United States surety bond market are Allianz (EULER HERMES), American International Group, Inc., Chubb, Gallagher, HUB International Limited, MARSH LLC, Surety Bonds Professionals and Willis Towers Watson amongst other market participants.
United States Surety Bond Market:
By Surety Type
- Construction, Bid and Performance Bonds
- Advance Payment Bonds
- Maintenance Bonds
- Commercial Surety Bonds
- Contract Surety Bonds
- License and Permit Bonds
- Customs Bonds
- Court Bonds
- Litigation Bonds, including Appeal Bonds
- Specialized Contract Bonds
- Others
By Organization Size
- Small and Medium Sized Organizations
- Large Organizations
By End Users
- Domestic Corporations and Multinational Companies
- Marketed through Global, National, Regional or Local Brokers
- Global Multinational Companies with U.S. Bond Needsoil
- Contractors and Managers
- Paving, Sewer and Water and Highway and Bridge
- Manufacturers
- Technology Companies
- Oil Field Service Firms
- Performance Bonds (Non-Construction or Supply)
- Court Bonds (Judicial and Fiduciary)
- Mining and Material Companies
- Dredgers
- Pharmaceuticals
- Agricultural Processors
- Others
By Region
- Northeast
- Midwest
- West
- South
Table of Contents
![]()
1. Market
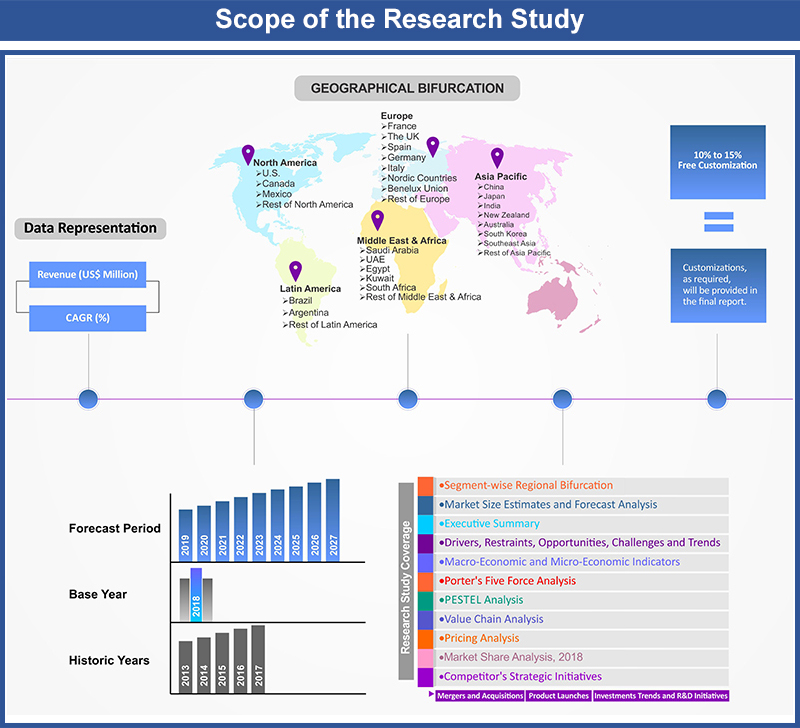
Scope
1.1. Market
Segmentation
1.2. Years
Considered
1.2.1. Historic
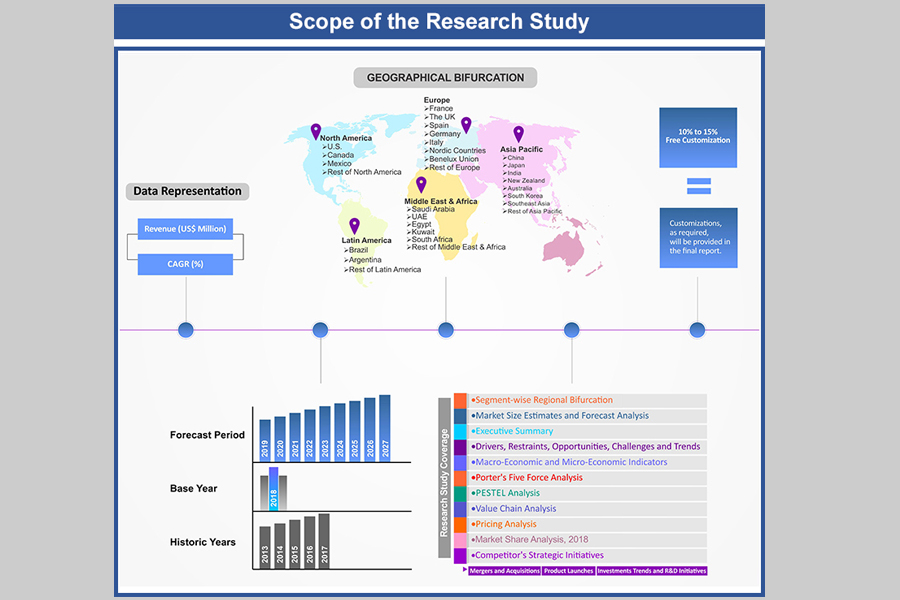
Years: 2015 - 2018
1.2.2. Base
Year: 2019
1.2.3. Forecast
Years: 2020 – 2028
2. Key Target
Audiences
3. Research
Methodology
3.1. Primary
Research
3.1.1. Research
Questionnaire
3.1.2. United
States Percentage Breakdown
3.1.3. Primary
Interviews: Key Opinion Leaders (KOLs)
3.2. Secondary
Research
3.2.1. Paid
Databases
3.2.2. Secondary
Sources
3.3. Market
Size Estimates
3.3.1. Top-Down
Approach
3.3.2. Bottom-Up
Approach
3.4. Data
Triangulation Methodology
3.5. Research
Assumptions
4. Recommendations
and Insights from AMI’s Perspective**
5. Holistic
Overview of Surety Bond Market
6. Market
Synopsis: Surety Bond Market
7. Surety Bond
Market Analysis: Qualitative Perspective
7.1. Introduction
7.1.1. Product
Definition
7.1.2. Industry
Development
7.2. Market
Dynamics
7.2.1. Drivers
7.2.2. Restraints
7.2.3. Opportunities
7.3. Trends in
Surety Bond Market
7.4. Market
Determinants Radar Chart
7.5. Macro-Economic
and Micro-Economic Indicators: Surety Bond Market
7.6. Porter’s
Five Force Analysis
7.7. Impact of
Covid-19 on Surety Bond Market
8. United
States Surety Bond Market Analysis and Forecasts, 2020 – 2028
8.1. Overview
8.1.1. United
States Surety Bond Market Revenue (US$ Mn)
8.2. United
States Surety Bond Market Revenue (US$ Mn) and
Forecasts, By Surety Type
8.2.1. Construction,
Bid and Performance Bonds
8.2.1.1. Definition
8.2.1.2. Market
Penetration, 2018
8.2.1.3. Market
Estimation, 2015 – 2019
8.2.1.4. Market
Forecast, 2020 – 2028
8.2.1.5. Compound
Annual Growth Rate (CAGR)
8.2.1.6. Regional
Bifurcation
8.2.1.6.1. Northeast
8.2.1.6.1.1. Market
Estimation, 2015 – 2019
8.2.1.6.1.2. Market
Forecast, 2020 – 2028
8.2.1.6.2. Midwest
8.2.1.6.2.1. Market
Estimation, 2015 – 2019
8.2.1.6.2.2. Market
Forecast, 2020 – 2028
8.2.1.6.3. West
8.2.1.6.3.1. Market
Estimation, 2015 – 2019
8.2.1.6.3.2. Market
Forecast, 2020 – 2028
8.2.1.6.4. South
8.2.1.6.4.1. Market
Estimation, 2015 – 2019
8.2.1.6.4.2. Market
Forecast, 2020 – 2028
8.2.2. Advance
Payment Bonds
8.2.2.1. Definition
8.2.2.2. Market
Penetration, 2018
8.2.2.3. Market
Estimation, 2015 – 2019
8.2.2.4. Market
Forecast, 2020 – 2028
8.2.2.5. Compound
Annual Growth Rate (CAGR)
8.2.2.6. Regional
Bifurcation
8.2.2.6.1. Northeast
8.2.2.6.1.1. Market
Estimation, 2015 – 2019
8.2.2.6.1.2. Market
Forecast, 2020 – 2028
8.2.2.6.2. Midwest
8.2.2.6.2.1. Market
Estimation, 2015 – 2019
8.2.2.6.2.2. Market
Forecast, 2020 – 2028
8.2.2.6.3. West
8.2.2.6.3.1. Market
Estimation, 2015 – 2019
8.2.2.6.3.2. Market
Forecast, 2020 – 2028
8.2.2.6.4. South
8.2.2.6.4.1. Market
Estimation, 2015 – 2019
8.2.2.6.4.2. Market
Forecast, 2020 – 2028
8.2.3. Maintenance
Bonds
8.2.3.1. Definition
8.2.3.2. Market
Penetration, 2018
8.2.3.3. Market
Estimation, 2015 – 2019
8.2.3.4. Market
Forecast, 2020 – 2028
8.2.3.5. Compound
Annual Growth Rate (CAGR)
8.2.3.6. Regional
Bifurcation
8.2.3.6.1. Northeast
8.2.3.6.1.1. Market
Estimation, 2015 – 2019
8.2.3.6.1.2. Market
Forecast, 2020 – 2028
8.2.3.6.2. Midwest
8.2.3.6.2.1. Market
Estimation, 2015 – 2019
8.2.3.6.2.2. Market
Forecast, 2020 – 2028
8.2.3.6.3. West
8.2.3.6.3.1. Market
Estimation, 2015 – 2019
8.2.3.6.3.2. Market
Forecast, 2020 – 2028
8.2.3.6.4. South
8.2.3.6.4.1. Market
Estimation, 2015 – 2019
8.2.3.6.4.2. Market
Forecast, 2020 – 2028
8.2.4. Commercial
Surety Bonds
8.2.4.1. Definition
8.2.4.2. Market
Penetration, 2018
8.2.4.3. Market
Estimation, 2015 – 2019
8.2.4.4. Market
Forecast, 2020 – 2028
8.2.4.5. Compound
Annual Growth Rate (CAGR)
8.2.4.6. Regional
Bifurcation
8.2.4.6.1. Northeast
8.2.4.6.1.1. Market
Estimation, 2015 – 2019
8.2.4.6.1.2. Market
Forecast, 2020 – 2028
8.2.4.6.2. Midwest
8.2.4.6.2.1. Market
Estimation, 2015 – 2019
8.2.4.6.2.2. Market
Forecast, 2020 – 2028
8.2.4.6.3. West
8.2.4.6.3.1. Market
Estimation, 2015 – 2019
8.2.4.6.3.2. Market
Forecast, 2020 – 2028
8.2.4.6.4. South
8.2.4.6.4.1. Market
Estimation, 2015 – 2019
8.2.4.6.4.2. Market
Forecast, 2020 – 2028
8.2.5. Contract
Surety Bonds
8.2.5.1. Definition
8.2.5.2. Market
Penetration, 2018
8.2.5.3. Market
Estimation, 2015 – 2019
8.2.5.4. Market
Forecast, 2020 – 2028
8.2.5.5. Compound
Annual Growth Rate (CAGR)
8.2.5.6. Regional
Bifurcation
8.2.5.6.1. Northeast
8.2.5.6.1.1. Market
Estimation, 2015 – 2019
8.2.5.6.1.2. Market
Forecast, 2020 – 2028
8.2.5.6.2. Midwest
8.2.5.6.2.1. Market
Estimation, 2015 – 2019
8.2.5.6.2.2. Market
Forecast, 2020 – 2028
8.2.5.6.3. West
8.2.5.6.3.1. Market
Estimation, 2015 – 2019
8.2.5.6.3.2. Market
Forecast, 2020 – 2028
8.2.5.6.4. South
8.2.5.6.4.1. Market
Estimation, 2015 – 2019
8.2.5.6.4.2. Market
Forecast, 2020 – 2028
8.2.6. License
and Permit Bonds
8.2.6.1. Definition
8.2.6.2. Market
Penetration, 2018
8.2.6.3. Market
Estimation, 2015 – 2019
8.2.6.4. Market
Forecast, 2020 – 2028
8.2.6.5. Compound
Annual Growth Rate (CAGR)
8.2.6.6. Regional
Bifurcation
8.2.6.6.1. Northeast
8.2.6.6.1.1. Market
Estimation, 2015 – 2019
8.2.6.6.1.2. Market
Forecast, 2020 – 2028
8.2.6.6.2. Midwest
8.2.6.6.2.1. Market
Estimation, 2015 – 2019
8.2.6.6.2.2. Market
Forecast, 2020 – 2028
8.2.6.6.3. West
8.2.6.6.3.1. Market
Estimation, 2015 – 2019
8.2.6.6.3.2. Market
Forecast, 2020 – 2028
8.2.6.6.4. South
8.2.6.6.4.1. Market
Estimation, 2015 – 2019
8.2.6.6.4.2. Market
Forecast, 2020 – 2028
8.2.7. Customs
Bonds
8.2.7.1. Definition
8.2.7.2. Market
Penetration, 2018
8.2.7.3. Market
Estimation, 2015 – 2019
8.2.7.4. Market
Forecast, 2020 – 2028
8.2.7.5. Compound
Annual Growth Rate (CAGR)
8.2.7.6. Regional
Bifurcation
8.2.7.6.1. Northeast
8.2.7.6.1.1. Market
Estimation, 2015 – 2019
8.2.7.6.1.2. Market
Forecast, 2020 – 2028
8.2.7.6.2. Midwest
8.2.7.6.2.1. Market
Estimation, 2015 – 2019
8.2.7.6.2.2. Market
Forecast, 2020 – 2028
8.2.7.6.3. West
8.2.7.6.3.1. Market
Estimation, 2015 – 2019
8.2.7.6.3.2. Market
Forecast, 2020 – 2028
8.2.7.6.4. South
8.2.7.6.4.1. Market
Estimation, 2015 – 2019
8.2.7.6.4.2. Market
Forecast, 2020 – 2028
8.2.8. Court
Bonds
8.2.8.1. Definition
8.2.8.2. Market
Penetration, 2018
8.2.8.3. Market
Estimation, 2015 – 2019
8.2.8.4. Market
Forecast, 2020 – 2028
8.2.8.5. Compound
Annual Growth Rate (CAGR)
8.2.8.6. Regional
Bifurcation
8.2.8.6.1. Northeast
8.2.8.6.1.1. Market
Estimation, 2015 – 2019
8.2.8.6.1.2. Market
Forecast, 2020 – 2028
8.2.8.6.2. Midwest
8.2.8.6.2.1. Market
Estimation, 2015 – 2019
8.2.8.6.2.2. Market
Forecast, 2020 – 2028
8.2.8.6.3. West
8.2.8.6.3.1. Market
Estimation, 2015 – 2019
8.2.8.6.3.2. Market
Forecast, 2020 – 2028
8.2.8.6.4. South
8.2.8.6.4.1. Market
Estimation, 2015 – 2019
8.2.8.6.4.2. Market
Forecast, 2020 – 2028
8.2.9. Litigation
Bonds, including Appeal Bonds
8.2.9.1. Definition
8.2.9.2. Market
Penetration, 2018
8.2.9.3. Market
Estimation, 2015 – 2019
8.2.9.4. Market
Forecast, 2020 – 2028
8.2.9.5. Compound
Annual Growth Rate (CAGR)
8.2.9.6. Regional
Bifurcation
8.2.9.6.1. Northeast
8.2.9.6.1.1. Market
Estimation, 2015 – 2019
8.2.9.6.1.2. Market
Forecast, 2020 – 2028
8.2.9.6.2. Midwest
8.2.9.6.2.1. Market
Estimation, 2015 – 2019
8.2.9.6.2.2. Market
Forecast, 2020 – 2028
8.2.9.6.3. West
8.2.9.6.3.1. Market
Estimation, 2015 – 2019
8.2.9.6.3.2. Market
Forecast, 2020 – 2028
8.2.9.6.4. South
8.2.9.6.4.1. Market
Estimation, 2015 – 2019
8.2.9.6.4.2. Market
Forecast, 2020 – 2028
8.2.10. Specialized
Contract Bonds
8.2.10.1. Definition
8.2.10.2. Market
Penetration, 2018
8.2.10.3. Market
Estimation, 2015 – 2019
8.2.10.4. Market
Forecast, 2020 – 2028
8.2.10.5. Compound
Annual Growth Rate (CAGR)
8.2.10.6. Regional
Bifurcation
8.2.10.6.1. Northeast
8.2.10.6.1.1. Market
Estimation, 2015 – 2019
8.2.10.6.1.2. Market
Forecast, 2020 – 2028
8.2.10.6.2. Midwest
8.2.10.6.2.1. Market
Estimation, 2015 – 2019
8.2.10.6.2.2. Market
Forecast, 2020 – 2028
8.2.10.6.3. West
8.2.10.6.3.1. Market
Estimation, 2015 – 2019
8.2.10.6.3.2. Market
Forecast, 2020 – 2028
8.2.10.6.4. South
8.2.10.6.4.1. Market
Estimation, 2015 – 2019
8.2.10.6.4.2. Market
Forecast, 2020 – 2028
8.2.11. Others
8.2.11.1. Definition
8.2.11.2. Market
Penetration, 2018
8.2.11.3. Market
Estimation, 2015 – 2019
8.2.11.4. Market
Forecast, 2020 – 2028
8.2.11.5. Compound
Annual Growth Rate (CAGR)
8.2.11.6. Regional
Bifurcation
8.2.11.6.1. Northeast
8.2.11.6.1.1. Market
Estimation, 2015 – 2019
8.2.11.6.1.2. Market
Forecast, 2020 – 2028
8.2.11.6.2. Midwest
8.2.11.6.2.1. Market
Estimation, 2015 – 2019
8.2.11.6.2.2. Market
Forecast, 2020 – 2028
8.2.11.6.3. West
8.2.11.6.3.1. Market
Estimation, 2015 – 2019
8.2.11.6.3.2. Market
Forecast, 2020 – 2028
8.2.11.6.4. South
8.2.11.6.4.1. Market
Estimation, 2015 – 2019
8.2.11.6.4.2. Market
Forecast, 2020 – 2028
8.3. Key
Segment for Channeling Investments
8.3.1. By
Surety Type
9. United
States Surety Bond Market Analysis and Forecasts, 2020 – 2028
9.1. Overview
9.2. United
States Surety Bond Market Revenue (US$ Mn) and
Forecasts, By Organization Size
9.2.1. Small
and Medium Sized Organizations
9.2.1.1. Definition
9.2.1.2. Market
Penetration, 2018
9.2.1.3. Market
Estimation, 2015 – 2019
9.2.1.4. Market
Forecast, 2020 – 2028
9.2.1.5. Compound
Annual Growth Rate (CAGR)
9.2.1.6. Regional
Bifurcation
9.2.1.6.1. Northeast
9.2.1.6.1.1. Market
Estimation, 2015 – 2019
9.2.1.6.1.2. Market
Forecast, 2020 – 2028
9.2.1.6.2. Midwest
9.2.1.6.2.1. Market
Estimation, 2015 – 2019
9.2.1.6.2.2. Market
Forecast, 2020 – 2028
9.2.1.6.3. West
9.2.1.6.3.1. Market
Estimation, 2015 – 2019
9.2.1.6.3.2. Market
Forecast, 2020 – 2028
9.2.1.6.4. South
9.2.1.6.4.1. Market
Estimation, 2015 – 2019
9.2.1.6.4.2. Market
Forecast, 2020 – 2028
9.2.2. Large
Organizations
9.2.2.1. Definition
9.2.2.2. Market
Penetration, 2018
9.2.2.3. Market
Estimation, 2015 – 2019
9.2.2.4. Market
Forecast, 2020 – 2028
9.2.2.5. Compound
Annual Growth Rate (CAGR)
9.2.2.6. Regional
Bifurcation
9.2.2.6.1. Northeast
9.2.2.6.1.1. Market
Estimation, 2015 – 2019
9.2.2.6.1.2. Market
Forecast, 2020 – 2028
9.2.2.6.2. Midwest
9.2.2.6.2.1. Market
Estimation, 2015 – 2019
9.2.2.6.2.2. Market
Forecast, 2020 – 2028
9.2.2.6.3. West
9.2.2.6.3.1. Market
Estimation, 2015 – 2019
9.2.2.6.3.2. Market
Forecast, 2020 – 2028
9.2.2.6.4. South
9.2.2.6.4.1. Market
Estimation, 2015 – 2019
9.2.2.6.4.2. Market
Forecast, 2020 – 2028
9.3. Key
Segment for Channeling Investments
9.3.1. By
Organization Size
10. United
States Surety Bond Market Analysis and Forecasts, 2020 – 2028
10.1. Overview
10.2. United
States Surety Bond Market Revenue (US$ Mn) and
Forecasts, By End Users
10.2.1. Domestic
Corporations and Multinational Companies
10.2.1.1. Definition
10.2.1.2. Market
Penetration, 2018
10.2.1.3. Market
Estimation, 2015 – 2019
10.2.1.4. Market
Forecast, 2020 – 2028
10.2.1.5. Compound
Annual Growth Rate (CAGR)
10.2.1.6. Regional
Bifurcation
10.2.1.6.1. Northeast
10.2.1.6.1.1. Market
Estimation, 2015 – 2019
10.2.1.6.1.2. Market
Forecast, 2020 – 2028
10.2.1.6.2. Midwest
10.2.1.6.2.1. Market
Estimation, 2015 – 2019
10.2.1.6.2.2. Market
Forecast, 2020 – 2028
10.2.1.6.3. West
10.2.1.6.3.1. Market
Estimation, 2015 – 2019
10.2.1.6.3.2. Market
Forecast, 2020 – 2028
10.2.1.6.4. South
10.2.1.6.4.1. Market
Estimation, 2015 – 2019
10.2.1.6.4.2. Market
Forecast, 2020 – 2028
10.2.2. Marketed
through Global, National, Regional or Local Brokers
10.2.2.1. Definition
10.2.2.2. Market
Penetration, 2018
10.2.2.3. Market
Estimation, 2015 – 2019
10.2.2.4. Market
Forecast, 2020 – 2028
10.2.2.5. Compound
Annual Growth Rate (CAGR)
10.2.2.6. Regional
Bifurcation
10.2.2.6.1. Northeast
10.2.2.6.1.1. Market
Estimation, 2015 – 2019
10.2.2.6.1.2. Market
Forecast, 2020 – 2028
10.2.2.6.2. Midwest
10.2.2.6.2.1. Market
Estimation, 2015 – 2019
10.2.2.6.2.2. Market
Forecast, 2020 – 2028
10.2.2.6.3. West
10.2.2.6.3.1. Market
Estimation, 2015 – 2019
10.2.2.6.3.2. Market
Forecast, 2020 – 2028
10.2.2.6.4. South
10.2.2.6.4.1. Market
Estimation, 2015 – 2019
10.2.2.6.4.2. Market
Forecast, 2020 – 2028
10.2.3. Global
Multinational Companies with U.S. Bond Needs
10.2.3.1. Definition
10.2.3.2. Market
Penetration, 2018
10.2.3.3. Market
Estimation, 2015 – 2019
10.2.3.4. Market
Forecast, 2020 – 2028
10.2.3.5. Compound
Annual Growth Rate (CAGR)
10.2.3.6. Regional
Bifurcation
10.2.3.6.1. Northeast
10.2.3.6.1.1. Market
Estimation, 2015 – 2019
10.2.3.6.1.2. Market
Forecast, 2020 – 2028
10.2.3.6.2. Midwest
10.2.3.6.2.1. Market
Estimation, 2015 – 2019
10.2.3.6.2.2. Market
Forecast, 2020 – 2028
10.2.3.6.3. West
10.2.3.6.3.1. Market
Estimation, 2015 – 2019
10.2.3.6.3.2. Market
Forecast, 2020 – 2028
10.2.3.6.4. South
10.2.3.6.4.1. Market
Estimation, 2015 – 2019
10.2.3.6.4.2. Market
Forecast, 2020 – 2028
10.2.4. Contractors
and Managers
10.2.4.1. Definition
10.2.4.2. Market
Penetration, 2018
10.2.4.3. Market
Estimation, 2015 – 2019
10.2.4.4. Market
Forecast, 2020 – 2028
10.2.4.5. Compound
Annual Growth Rate (CAGR)
10.2.4.6. Regional
Bifurcation
10.2.4.6.1. Northeast
10.2.4.6.1.1. Market
Estimation, 2015 – 2019
10.2.4.6.1.2. Market
Forecast, 2020 – 2028
10.2.4.6.2. Midwest
10.2.4.6.2.1. Market
Estimation, 2015 – 2019
10.2.4.6.2.2. Market
Forecast, 2020 – 2028
10.2.4.6.3. West
10.2.4.6.3.1. Market
Estimation, 2015 – 2019
10.2.4.6.3.2. Market
Forecast, 2020 – 2028
10.2.4.6.4. South
10.2.4.6.4.1. Market
Estimation, 2015 – 2019
10.2.4.6.4.2. Market
Forecast, 2020 – 2028
10.2.5. Paving,
Sewer and Water and Highway and Bridge
10.2.5.1. Definition
10.2.5.2. Market
Penetration, 2018
10.2.5.3. Market
Estimation, 2015 – 2019
10.2.5.4. Market
Forecast, 2020 – 2028
10.2.5.5. Compound
Annual Growth Rate (CAGR)
10.2.5.6. Regional
Bifurcation
10.2.5.6.1. Northeast
10.2.5.6.1.1. Market
Estimation, 2015 – 2019
10.2.5.6.1.2. Market
Forecast, 2020 – 2028
10.2.5.6.2. Midwest
10.2.5.6.2.1. Market
Estimation, 2015 – 2019
10.2.5.6.2.2. Market
Forecast, 2020 – 2028
10.2.5.6.3. West
10.2.5.6.3.1. Market
Estimation, 2015 – 2019
10.2.5.6.3.2. Market
Forecast, 2020 – 2028
10.2.5.6.4. South
10.2.5.6.4.1. Market
Estimation, 2015 – 2019
10.2.5.6.4.2. Market
Forecast, 2020 – 2028
10.2.6. Manufacturers
10.2.6.1. Definition
10.2.6.2. Market
Penetration, 2018
10.2.6.3. Market
Estimation, 2015 – 2019
10.2.6.4. Market
Forecast, 2020 – 2028
10.2.6.5. Compound
Annual Growth Rate (CAGR)
10.2.6.6. Regional
Bifurcation
10.2.6.6.1. Northeast
10.2.6.6.1.1. Market
Estimation, 2015 – 2019
10.2.6.6.1.2. Market
Forecast, 2020 – 2028
10.2.6.6.2. Midwest
10.2.6.6.2.1. Market
Estimation, 2015 – 2019
10.2.6.6.2.2. Market
Forecast, 2020 – 2028
10.2.6.6.3. West
10.2.6.6.3.1. Market
Estimation, 2015 – 2019
10.2.6.6.3.2. Market
Forecast, 2020 – 2028
10.2.6.6.4. South
10.2.6.6.4.1. Market
Estimation, 2015 – 2019
10.2.6.6.4.2. Market
Forecast, 2020 – 2028
10.2.7. Technology
Companies
10.2.7.1. Definition
10.2.7.2. Market
Penetration, 2018
10.2.7.3. Market
Estimation, 2015 – 2019
10.2.7.4. Market
Forecast, 2020 – 2028
10.2.7.5. Compound
Annual Growth Rate (CAGR)
10.2.7.6. Regional
Bifurcation
10.2.7.6.1. Northeast
10.2.7.6.1.1. Market
Estimation, 2015 – 2019
10.2.7.6.1.2. Market
Forecast, 2020 – 2028
10.2.7.6.2. Midwest
10.2.7.6.2.1. Market
Estimation, 2015 – 2019
10.2.7.6.2.2. Market
Forecast, 2020 – 2028
10.2.7.6.3. West
10.2.7.6.3.1. Market
Estimation, 2015 – 2019
10.2.7.6.3.2. Market
Forecast, 2020 – 2028
10.2.7.6.4. South
10.2.7.6.4.1. Market
Estimation, 2015 – 2019
10.2.7.6.4.2. Market
Forecast, 2020 – 2028
10.2.8. Oil
Field Service Firms
10.2.8.1. Definition
10.2.8.2. Market
Penetration, 2018
10.2.8.3. Market
Estimation, 2015 – 2019
10.2.8.4. Market
Forecast, 2020 – 2028
10.2.8.5. Compound
Annual Growth Rate (CAGR)
10.2.8.6. Regional
Bifurcation
10.2.8.6.1. Northeast
10.2.8.6.1.1. Market
Estimation, 2015 – 2019
10.2.8.6.1.2. Market
Forecast, 2020 – 2028
10.2.8.6.2. Midwest
10.2.8.6.2.1. Market
Estimation, 2015 – 2019
10.2.8.6.2.2. Market
Forecast, 2020 – 2028
10.2.8.6.3. West
10.2.8.6.3.1. Market
Estimation, 2015 – 2019
10.2.8.6.3.2. Market
Forecast, 2020 – 2028
10.2.8.6.4. South
10.2.8.6.4.1. Market
Estimation, 2015 – 2019
10.2.8.6.4.2. Market
Forecast, 2020 – 2028
10.2.9. Performance
Bonds (NonConstruction or Supply)
10.2.9.1. Definition
10.2.9.2. Market
Penetration, 2018
10.2.9.3. Market
Estimation, 2015 – 2019
10.2.9.4. Market
Forecast, 2020 – 2028
10.2.9.5. Compound
Annual Growth Rate (CAGR)
10.2.9.6. Regional
Bifurcation
10.2.9.6.1. Northeast
10.2.9.6.1.1. Market
Estimation, 2015 – 2019
10.2.9.6.1.2. Market
Forecast, 2020 – 2028
10.2.9.6.2. Midwest
10.2.9.6.2.1. Market
Estimation, 2015 – 2019
10.2.9.6.2.2. Market
Forecast, 2020 – 2028
10.2.9.6.3. West
10.2.9.6.3.1. Market
Estimation, 2015 – 2019
10.2.9.6.3.2. Market
Forecast, 2020 – 2028
10.2.9.6.4. South
10.2.9.6.4.1. Market
Estimation, 2015 – 2019
10.2.9.6.4.2. Market
Forecast, 2020 – 2028
10.2.10. Court
Bonds (Judicial and Fiduciary)
10.2.10.1. Definition
10.2.10.2. Market
Penetration, 2018
10.2.10.3. Market
Estimation, 2015 – 2019
10.2.10.4. Market
Forecast, 2020 – 2028
10.2.10.5. Compound
Annual Growth Rate (CAGR)
10.2.10.6. Regional
Bifurcation
10.2.10.6.1. Northeast
10.2.10.6.1.1. Market
Estimation, 2015 – 2019
10.2.10.6.1.2. Market
Forecast, 2020 – 2028
10.2.10.6.2. Midwest
10.2.10.6.2.1. Market
Estimation, 2015 – 2019
10.2.10.6.2.2. Market
Forecast, 2020 – 2028
10.2.10.6.3. West
10.2.10.6.3.1. Market
Estimation, 2015 – 2019
10.2.10.6.3.2. Market
Forecast, 2020 – 2028
10.2.10.6.4. South
10.2.10.6.4.1. Market
Estimation, 2015 – 2019
10.2.10.6.4.2. Market
Forecast, 2020 – 2028
10.2.11. Mining
and Material Companies
10.2.11.1. Definition
10.2.11.2. Market
Penetration, 2018
10.2.11.3. Market
Estimation, 2015 – 2019
10.2.11.4. Market
Forecast, 2020 – 2028
10.2.11.5. Compound
Annual Growth Rate (CAGR)
10.2.11.6. Regional
Bifurcation
10.2.11.6.1. Northeast
10.2.11.6.1.1. Market
Estimation, 2015 – 2019
10.2.11.6.1.2. Market
Forecast, 2020 – 2028
10.2.11.6.2. Midwest
10.2.11.6.2.1. Market
Estimation, 2015 – 2019
10.2.11.6.2.2. Market
Forecast, 2020 – 2028
10.2.11.6.3. West
10.2.11.6.3.1. Market
Estimation, 2015 – 2019
10.2.11.6.3.2. Market
Forecast, 2020 – 2028
10.2.11.6.4. South
10.2.11.6.4.1. Market
Estimation, 2015 – 2019
10.2.11.6.4.2. Market
Forecast, 2020 – 2028
10.2.12. Dredgers
10.2.12.1. Definition
10.2.12.2. Market
Penetration, 2018
10.2.12.3. Market
Estimation, 2015 – 2019
10.2.12.4. Market
Forecast, 2020 – 2028
10.2.12.5. Compound
Annual Growth Rate (CAGR)
10.2.12.6. Regional
Bifurcation
10.2.12.6.1. Northeast
10.2.12.6.1.1. Market
Estimation, 2015 – 2019
10.2.12.6.1.2. Market
Forecast, 2020 – 2028
10.2.12.6.2. Midwest
10.2.12.6.2.1. Market
Estimation, 2015 – 2019
10.2.12.6.2.2. Market
Forecast, 2020 – 2028
10.2.12.6.3. West
10.2.12.6.3.1. Market
Estimation, 2015 – 2019
10.2.12.6.3.2. Market
Forecast, 2020 – 2028
10.2.12.6.4. South
10.2.12.6.4.1. Market
Estimation, 2015 – 2019
10.2.12.6.4.2. Market
Forecast, 2020 – 2028
10.2.13. Pharmaceuticals
10.2.13.1. Definition
10.2.13.2. Market
Penetration, 2018
10.2.13.3. Market
Estimation, 2015 – 2019
10.2.13.4. Market
Forecast, 2020 – 2028
10.2.13.5. Compound
Annual Growth Rate (CAGR)
10.2.13.6. Regional
Bifurcation
10.2.13.6.1. Northeast
10.2.13.6.1.1. Market
Estimation, 2015 – 2019
10.2.13.6.1.2. Market
Forecast, 2020 – 2028
10.2.13.6.2. Midwest
10.2.13.6.2.1. Market
Estimation, 2015 – 2019
10.2.13.6.2.2. Market
Forecast, 2020 – 2028
10.2.13.6.3. West
10.2.13.6.3.1. Market
Estimation, 2015 – 2019
10.2.13.6.3.2. Market
Forecast, 2020 – 2028
10.2.13.6.4. South
10.2.13.6.4.1. Market
Estimation, 2015 – 2019
10.2.13.6.4.2. Market
Forecast, 2020 – 2028
10.2.14. Agricultural
Processors
10.2.14.1. Definition
10.2.14.2. Market
Penetration, 2018
10.2.14.3. Market
Estimation, 2015 – 2019
10.2.14.4. Market
Forecast, 2020 – 2028
10.2.14.5. Compound
Annual Growth Rate (CAGR)
10.2.14.6. Regional
Bifurcation
10.2.14.6.1. Northeast
10.2.14.6.1.1. Market
Estimation, 2015 – 2019
10.2.14.6.1.2. Market
Forecast, 2020 – 2028
10.2.14.6.2. Midwest
10.2.14.6.2.1. Market
Estimation, 2015 – 2019
10.2.14.6.2.2. Market
Forecast, 2020 – 2028
10.2.14.6.3. West
10.2.14.6.3.1. Market
Estimation, 2015 – 2019
10.2.14.6.3.2. Market
Forecast, 2020 – 2028
10.2.14.6.4. South
10.2.14.6.4.1. Market
Estimation, 2015 – 2019
10.2.14.6.4.2. Market
Forecast, 2020 – 2028
10.2.15. Others
10.2.15.1. Definition
10.2.15.2. Market
Penetration, 2018
10.2.15.3. Market
Estimation, 2015 – 2019
10.2.15.4. Market
Forecast, 2020 – 2028
10.2.15.5. Compound
Annual Growth Rate (CAGR)
10.2.15.6. Regional
Bifurcation
10.2.15.6.1. Northeast
10.2.15.6.1.1. Market
Estimation, 2015 – 2019
10.2.15.6.1.2. Market
Forecast, 2020 – 2028
10.2.15.6.2. Midwest
10.2.15.6.2.1. Market
Estimation, 2015 – 2019
10.2.15.6.2.2. Market
Forecast, 2020 – 2028
10.2.15.6.3. West
10.2.15.6.3.1. Market
Estimation, 2015 – 2019
10.2.15.6.3.2. Market
Forecast, 2020 – 2028
10.2.15.6.4. South
10.2.15.6.4.1. Market
Estimation, 2015 – 2019
10.2.15.6.4.2. Market
Forecast, 2020 – 2028
10.3. Key
Segment for Channeling Investments
10.3.1. By End
Users
11. United
States Surety Bond Market Analysis and Forecasts, 2020 – 2028
11.1. Overview
11.2. United
States Surety Bond Market Revenue (US$ Mn) and Forecasts By Region
11.2.1. Northeast
11.2.1.1. Northeast
Surety Bond Market Revenue (US$ Mn) and Forecasts, By Surety Type
11.2.1.1.1. Construction,
Bid and Performance Bonds
11.2.1.1.2. Advance
Payment Bonds
11.2.1.1.3. Maintenance
Bonds
11.2.1.1.4. Commercial
Surety Bonds
11.2.1.1.5. Contract
Surety Bonds
11.2.1.1.6. License
and Permit Bonds
11.2.1.1.7. Customs
Bonds
11.2.1.1.8. Court
Bonds
11.2.1.1.9. Litigation
Bonds, including Appeal Bonds
11.2.1.1.10. Specialized
Contract Bonds
11.2.1.1.11. Others
11.2.1.2. Northeast
Surety Bond Market Revenue (US$ Mn) and Forecasts, By Organization Size
11.2.1.2.1. Small
and Medium Sized Organizations
11.2.1.2.2. Large
Organizations
11.2.1.3. Northeast
Surety Bond Market Revenue (US$ Mn) and Forecasts, By End Users
11.2.1.3.1. Domestic
Corporations and Multinational Companies
11.2.1.3.2. Marketed
through Global, National, Regional or Local Brokers
11.2.1.3.3. Global
Multinational Companies with U.S. Bond Needs
11.2.1.3.4. Contractors
and Managers
11.2.1.3.5. Paving,
Sewer and Water and Highway and Bridge
11.2.1.3.6. Manufacturers
11.2.1.3.7. Technology
Companies
11.2.1.3.8. Oil
Field Service Firms
11.2.1.3.9. Performance
Bonds (NonConstruction or Supply)
11.2.1.3.10. Court
Bonds (Judicial and Fiduciary)
11.2.1.3.11. Mining
and Material Companies
11.2.1.3.12. Dredgers
11.2.1.3.13. Pharmaceuticals
11.2.1.3.14. Agricultural
Processors
11.2.1.3.15. Others
11.2.2. Midwest
11.2.2.1. Midwest
Surety Bond Market Revenue (US$ Mn) and Forecasts, By Surety Type
11.2.2.1.1. Construction,
Bid and Performance Bonds
11.2.2.1.2. Advance
Payment Bonds
11.2.2.1.3. Maintenance
Bonds
11.2.2.1.4. Commercial
Surety Bonds
11.2.2.1.5. Contract
Surety Bonds
11.2.2.1.6. License
and Permit Bonds
11.2.2.1.7. Customs
Bonds
11.2.2.1.8. Court
Bonds
11.2.2.1.9. Litigation
Bonds, including Appeal Bonds
11.2.2.1.10. Specialized
Contract Bonds
11.2.2.1.11. Others
11.2.2.2. Midwest
Surety Bond Market Revenue (US$ Mn) and Forecasts, By Organization Size
11.2.2.2.1. Small
and Medium Sized Organizations
11.2.2.2.2. Large
Organizations
11.2.2.3. Midwest
Surety Bond Market Revenue (US$ Mn) and Forecasts, By End Users
11.2.2.3.1. Domestic
Corporations and Multinational Companies
11.2.2.3.2. Marketed
through Global, National, Regional or Local Brokers
11.2.2.3.3. Global
Multinational Companies with U.S. Bond Needs
11.2.2.3.4. Contractors
and Managers
11.2.2.3.5. Paving,
Sewer and Water and Highway and Bridge
11.2.2.3.6. Manufacturers
11.2.2.3.7. Technology
Companies
11.2.2.3.8. Oil
Field Service Firms
11.2.2.3.9. Performance
Bonds (NonConstruction or Supply)
11.2.2.3.10. Court
Bonds (Judicial and Fiduciary)
11.2.2.3.11. Mining
and Material Companies
11.2.2.3.12. Dredgers
11.2.2.3.13. Pharmaceuticals
11.2.2.3.14. Agricultural
Processors
11.2.2.3.15. Others
11.2.3. West
11.2.3.1. West
Surety Bond Market Revenue (US$ Mn) and Forecasts, By Surety Type
11.2.3.1.1. Construction,
Bid and Performance Bonds
11.2.3.1.2. Advance
Payment Bonds
11.2.3.1.3. Maintenance
Bonds
11.2.3.1.4. Commercial
Surety Bonds
11.2.3.1.5. Contract
Surety Bonds
11.2.3.1.6. License
and Permit Bonds
11.2.3.1.7. Customs
Bonds
11.2.3.1.8. Court
Bonds
11.2.3.1.9. Litigation
Bonds, including Appeal Bonds
11.2.3.1.10. Specialized
Contract Bonds
11.2.3.1.11. Others
11.2.3.2. West
Surety Bond Market Revenue (US$ Mn) and Forecasts, By Organization Size
11.2.3.2.1. Small
and Medium Sized Organizations
11.2.3.2.2. Large
Organizations
11.2.3.3. West
Surety Bond Market Revenue (US$ Mn) and Forecasts, By End Users
11.2.3.3.1. Domestic
Corporations and Multinational Companies
11.2.3.3.2. Marketed
through Global, National, Regional or Local Brokers
11.2.3.3.3. Global
Multinational Companies with U.S. Bond Needs
11.2.3.3.4. Contractors
and Managers
11.2.3.3.5. Paving,
Sewer and Water and Highway and Bridge
11.2.3.3.6. Manufacturers
11.2.3.3.7. Technology
Companies
11.2.3.3.8. Oil
Field Service Firms
11.2.3.3.9. Performance
Bonds (NonConstruction or Supply)
11.2.3.3.10. Court
Bonds (Judicial and Fiduciary)
11.2.3.3.11. Mining
and Material Companies
11.2.3.3.12. Dredgers
11.2.3.3.13. Pharmaceuticals
11.2.3.3.14. Agricultural
Processors
11.2.3.3.15. Others
11.2.4. South
11.2.4.1. South
Surety Bond Market Revenue (US$ Mn) and Forecasts, By Surety Type
11.2.4.1.1. Construction,
Bid and Performance Bonds
11.2.4.1.2. Advance
Payment Bonds
11.2.4.1.3. Maintenance
Bonds
11.2.4.1.4. Commercial
Surety Bonds
11.2.4.1.5. Contract
Surety Bonds
11.2.4.1.6. License
and Permit Bonds
11.2.4.1.7. Customs
Bonds
11.2.4.1.8. Court
Bonds
11.2.4.1.9. Litigation
Bonds, including Appeal Bonds
11.2.4.1.10. Specialized
Contract Bonds
11.2.4.1.11. Others
11.2.4.2. South
Surety Bond Market Revenue (US$ Mn) and Forecasts, By Organization Size
11.2.4.2.1. Small
and Medium Sized Organizations
11.2.4.2.2. Large
Organizations
11.2.4.3. South
Surety Bond Market Revenue (US$ Mn) and Forecasts, By End Users
11.2.4.3.1. Domestic
Corporations and Multinational Companies
11.2.4.3.2. Marketed
through Global, National, Regional or Local Brokers
11.2.4.3.3. Global
Multinational Companies with U.S. Bond Needs
11.2.4.3.4. Contractors
and Managers
11.2.4.3.5. Paving,
Sewer and Water and Highway and Bridge
11.2.4.3.6. Manufacturers
11.2.4.3.7. Technology
Companies
11.2.4.3.8. Oil
Field Service Firms
11.2.4.3.9. Performance
Bonds (NonConstruction or Supply)
11.2.4.3.10. Court
Bonds (Judicial and Fiduciary)
11.2.4.3.11. Mining
and Material Companies
11.2.4.3.12. Dredgers
11.2.4.3.13. Pharmaceuticals
11.2.4.3.14. Agricultural
Processors
11.2.4.3.15. Others
12. Competitive
Benchmarking
12.1. Market
Share Analysis, 2019
12.2. United
States Presence and Growth Strategies
12.2.1. Mergers
and Acquisitions
12.2.2. Product
Launches
12.2.3. Investments
Trends
12.2.4. R&D
Initiatives
13. Player
Profiles
13.1. Allianz
(EULER HERMES)
13.1.1. Company
Details
13.1.2. Company
Overview
13.1.3. Product
Offerings
13.1.4. Key
Developments
13.1.5. Financial
Analysis
13.1.6. SWOT
Analysis
13.1.7. Business
Strategies
13.2. American
International Group, Inc.
13.2.1. Company
Details
13.2.2. Company
Overview
13.2.3. Product
Offerings
13.2.4. Key
Developments
13.2.5. Financial
Analysis
13.2.6. SWOT
Analysis
13.2.7. Business
Strategies
13.3. Chubb
13.3.1. Company
Details
13.3.2. Company
Overview
13.3.3. Product
Offerings
13.3.4. Key
Developments
13.3.5. Financial
Analysis
13.3.6. SWOT
Analysis
13.3.7. Business
Strategies
13.4. Gallagher
13.4.1. Company
Details
13.4.2. Company
Overview
13.4.3. Product
Offerings
13.4.4. Key
Developments
13.4.5. Financial
Analysis
13.4.6. SWOT
Analysis
13.4.7. Business
Strategies
13.5. HUB
International Limited.
13.5.1. Company
Details
13.5.2. Company
Overview
13.5.3. Product
Offerings
13.5.4. Key
Developments
13.5.5. Financial
Analysis
13.5.6. SWOT
Analysis
13.5.7. Business
Strategies
13.6. MARSH
LLC.
13.6.1. Company
Details
13.6.2. Company
Overview
13.6.3. Product
Offerings
13.6.4. Key
Developments
13.6.5. Financial
Analysis
13.6.6. SWOT
Analysis
13.6.7. Business
Strategies
13.7. Surety
Bond Professionals.
13.7.1. Company
Details
13.7.2. Company
Overview
13.7.3. Product
Offerings
13.7.4. Key
Developments
13.7.5. Financial
Analysis
13.7.6. SWOT
Analysis
13.7.7. Business
Strategies
13.8. Willis
Towers Watson
13.8.1. Company
Details
13.8.2. Company
Overview
13.8.3. Product
Offerings
13.8.4. Key
Developments
13.8.5. Financial
Analysis
13.8.6. SWOT
Analysis
13.8.7. Business
Strategies
13.9. Other Market
Participants
14. Key
Findings
Note: This ToC is
tentative and can be changed according to the research study conducted during
the course of report completion.
**Exclusive for
Multi-User and Enterprise User.
At Absolute Markets Insights, we are engaged in building both global as well as country specific reports. As a result, the approach taken for deriving the estimation and forecast for a specific country is a bit unique and different in comparison to the global research studies. In this case, we not only study the concerned market factors & trends prevailing in a particular country (from secondary research) but we also tend to calculate the actual market size & forecast from the revenue generated from the market participants involved in manufacturing or distributing the any concerned product. These companies can also be service providers. For analyzing any country specifically, we do consider the growth factors prevailing under the states/cities/county for the same. For instance, if we are analyzing an industry specific to United States, we primarily need to study about the states present under the same(where the product/service has the highest growth). Similar analysis will be followed by other countries. Our scope of the report changes with different markets.
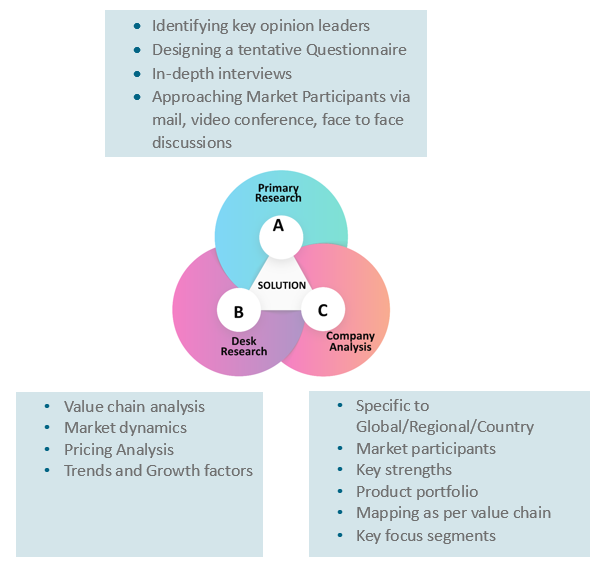
Our research study is mainly implement through a mix of both secondary and primary research. Various sources such as industry magazines, trade journals, and government websites and trade associations are reviewed for gathering precise data. Primary interviews are conducted to validate the market size derived from secondary research. Industry experts, major manufacturers and distributors are contacted for further validation purpose on the current market penetration and growth trends.
Prominent participants in our primary research process include:
- Key Opinion Leaders namely the CEOs, CSOs, VPs, purchasing managers, amongst others
- Research and development participants, distributors/suppliers and subject matter experts
Secondary Research includes data extracted from paid data sources:
- Reuters
- Factiva
- Bloomberg
- One Source
- Hoovers
Research Methodology
Key Inclusions
Reach to us
Call us on
+91-74002-42424
Drop us an email at
sales@absolutemarketsinsights.com
Why Absolute Markets Insights?
An effective strategy is the entity that influences a business to stand out of the crowd. An organization with a phenomenal strategy for success dependably has the edge over the rivals in the market. It offers the organizations a head start in planning their strategy. Absolute Market Insights is the new initiation in the industry that will furnish you with the lead your business needs. Absolute Market Insights is the best destination for your business intelligence and analytical solutions; essentially because our qualitative and quantitative sources of information are competent to give one-stop solutions. We inventively combine qualitative and quantitative research in accurate proportions to have the best report, which not only gives the most recent insights but also assists you to grow.
