
Sustainable Supply Chain Finance Market By Type (Financial Institution, Buyer Financed, Supplier Financed, Multiple Source), By Organization Size (Small and Medium Enterprises, Large Enterprises), By End User (Foot & Apparel, Food & Beverages, Power & Energy, Automobile, Chemical & Materials, Manufacturing, Others), By Region (U.S., Canada, Mexico, Rest of North America, France, UK, Germany, Spain, Italy, Nordic Countries, Benelux Union, Rest of Europe, China, Japan, India, New Zealand, Australia, South Korea, Southeast Asia, Rest of Asia Pacific, Saudi Arabia, UAE, Egypt, Kuwait, South Africa, Rest of MEA, Brazil, Argentina, Rest of Latin America) – Global Insights, Growth, Size, Comparative Analysis, Trends and Forecast, 2019 – 2027
Industry Trends
Global sustainable supply chain finance market was valued at US$ 660,211.1 million in 2018 and is expected to reach US$ 2,926,758.97 million by 2027, growing at an estimated CAGR of 18.24% over the forecast period. Increased emphasis by suppliers and buyers on maintaining optimal working capital would boost the global sustainable supply chain finance market. The current global economic climate is forcing both suppliers and buyers to hold onto cash for maintaining optimal working capital. Normally, buyers would like to delay the payment as long as possible; whereas suppliers would like to get paid at the earliest. Supply chain finance is an attractive method for companies to improve their working capital position.
Since the last decade, there has been significant media attention regarding the importance of sustainable environmental practices; in which supply chain plays a vital role. Financial companies are incentivizing suppliers, who follow good environmental practices by providing better terms. By type, financial institutions is the largest segment accounting for 54.3% of the Sustainable Supply Chain Finance Market share and is expected to register a CAGR of 18.72% by 2027.
Suppliers which provide raw materials largely comprise small and medium enterprises. Since they have limited cash, there is lot of pressure to maintain optimal working capital position as compared to large enterprises. By organization size, the small and medium enterprises segment accounted for 77.6% of Sustainable Supply Chain Finance Market share and is expected to register a CAGR of 18.05% by 2027.
Firms across various sectors, are gradually adopting sustainable supply chain finance; however foot & apparel sector adopted the model first; since suppliers from this sector require incentives the most. In addition, the supply chain model is relatively less complex making it easier to adopt the sustainable supply chain finance model. By end user, foot & apparel segment accounted over 30% of Sustainable Supply Chain Finance Market share and is expected to register a CAGR of 18.36% by 2027. However, the chemical and materials sector is projected to grow the fastest as chemical suppliers are outsourcing production of raw materials to low income countries; which increases the need for a sustainable supply chain management.
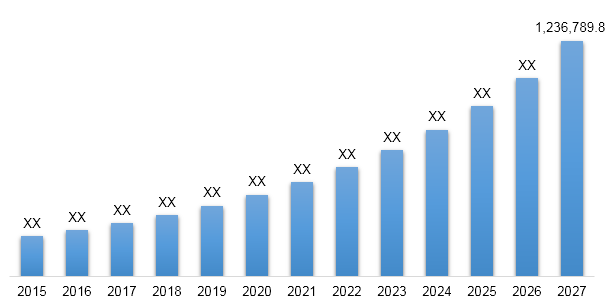
Despite the advantages of sustainable supply chain finance solutions, the penetration rate is not as high as it was projected; largely due to the confusion regarding the concept of supply chain finance. However, more and more companies are adopting this model to better their working capital position as it is a win-win situation for all the parties involved. By region, North America is the largest market for sustainable supply chain finance with a market share of 39.7% and is expected to grow at a CAGR of 19.14% during the forecast period.
North America Sustainable Supply Chain Finance Market Revenue & Forecast, (US$ Million), 2015 – 2027
Competitive Landscape
The report provides both, qualitative and quantitative research of Sustainable Supply Chain Finance market, as well as provides comprehensive insights and favored development methods adopted by the key contenders. The report also offers extensive research on the key players in this market and details on the competitiveness of these players. Key business strategies such as mergers and acquisitions (M&A), affiliations, collaborations, and contracts adopted by these major market participants are also recognized and analyzed in the report. For each company, the report studies their global presence, competitors, service offerings, specification, pricing, and gross margin.
Some of the players operating in the sustainable supply chain finance market are BNP Paribas, Citigroup, Inc., DBS Bank Ltd, First Abu Dhabi Bank, FMO, HSBC Group, ING Bank N.V., Standard Chartered, TIER Sustainable Supply Chain Finance and many more.

Sustainable Supply Chain Finance Market:
- By Type:
- Financial Institution
- Buyer Financed
- Supplier Financed
- Multiple Source
- By Organization Size:
- Large Enterprises
- Small and Medium sized Enterprises
- By End Users
- Foot & Apparel
- Food & Beverages
- Power & Energy
- Automobile
- Chemical & Materials
- Manufacturing
- Others
- By Geography
- North America
- U.S.
- Canada
- Mexico
- Europe
- France
- The UK
- Spain
- Germany
- Italy
- Nordic Countries
- Denmark
- Finland
- Iceland
- Norway
- Sweden
- Benelux Union
- Belgium
- The Netherlands
- Luxemburg
- Rest of Europe
- Asia Pacific
- China
- Japan
- India
- New Zealand
- Australia
- South Korea
- Southeast Asia
- Indonesia
- Thailand
- Malaysia
- Singapore
- Rest of Southeast Asia
- Rest of Asia Pacific
- Middle East & Africa
- Saudi Arabia
- UAE
- Egypt
- Kuwait
- South Africa
- Rest of Middle East & Africa
- Latin America
- Brazil
- Argentina
- Rest of Latin America
- North America
Table of Contents
![]()
1. Market
Scope
1.1. Market
Segmentation
1.2. Years
Considered
1.2.1. Historic
Years: 2015 - 2017
1.2.2. Base
Year: 2018
1.2.3. Forecast
Years: 2019 – 2027
2. Key Target
Audiences
3. Research
Methodology
3.1. Primary
Research
3.1.1. Research
Questionnaire
3.1.2. Global
Percentage Breakdown
3.1.3. Primary
Interviews: Key Opinion Leaders (KOLs)
3.2. Secondary
Research
3.2.1. Paid
Databases
3.2.2. Secondary
Sources
3.3. Market
Size Estimates
3.3.1. Top-Down
Approach
3.3.2. Bottom-Up
Approach
3.4. Data
Triangulation Methodology
3.5. Research
Assumptions
4. Recommendations
and Insights from AMI’s Perspective**
5. Holistic
Overview of Sustainable Supply Chain Finance Market
6. Market
Synopsis: Sustainable Supply Chain Finance Market
7. Sustainable
Supply Chain Finance Market Analysis: Qualitative Perspective
7.1. Introduction
7.1.1. Product
Definition
7.1.2. Industry
Development
7.2. Market
Dynamics
7.2.1. Drivers
7.2.2. Restraints
7.2.3. Opportunities
7.3. Trends in
Sustainable Supply Chain Finance Market
7.4. Market
Determinants Radar Chart
7.5. Macro-Economic
and Micro-Economic Indicators: Sustainable Supply Chain Finance Market
7.6. Porter’s
Five Force Analysis
8. Global Sustainable
Supply Chain Finance Market Analysis and Forecasts, 2019 – 2027
8.1. Overview
8.1.1. Global
Sustainable Supply Chain Finance Market Revenue (US$ Mn)
8.2. Global
Sustainable Supply Chain Finance Market Revenue (US$ Mn) and Forecasts, By Type
8.2.1. Financial
Institution
8.2.1.1. Definition
8.2.1.2. Market
Estimation and Penetration, 2015 – 2018
8.2.1.3. Market
Forecast, 2019 – 2027
8.2.1.4. Compound
Annual Growth Rate (CAGR)
8.2.1.5. Regional
Bifurcation
8.2.1.5.1. North
America
8.2.1.5.1.1. Market
Estimation, 2015 – 2018
8.2.1.5.1.2. Market
Forecast, 2019 – 2027
8.2.1.5.2. Europe
8.2.1.5.2.1. Market
Estimation, 2015 – 2018
8.2.1.5.2.2. Market
Forecast, 2019 – 2027
8.2.1.5.3. Asia
Pacific
8.2.1.5.3.1. Market
Estimation, 2015 – 2018
8.2.1.5.3.2. Market
Forecast, 2019 – 2027
8.2.1.5.4. Middle
East and Africa
8.2.1.5.4.1. Market
Estimation, 2015 – 2018
8.2.1.5.4.2. Market
Forecast, 2019 – 2027
8.2.1.5.5. Latin
America
8.2.1.5.5.1. Market
Estimation, 2015 – 2018
8.2.1.5.5.2. Market
Forecast, 2019 – 2027
8.2.2. Buyer
Financed
8.2.2.1. Definition
8.2.2.2. Market
Estimation and Penetration, 2015 – 2018
8.2.2.3. Market
Forecast, 2019 – 2027
8.2.2.4. Compound
Annual Growth Rate (CAGR)
8.2.2.5. Regional
Bifurcation
8.2.2.5.1. North
America
8.2.2.5.1.1. Market
Estimation, 2015 – 2018
8.2.2.5.1.2. Market
Forecast, 2019 – 2027
8.2.2.5.2. Europe
8.2.2.5.2.1. Market
Estimation, 2015 – 2018
8.2.2.5.2.2. Market
Forecast, 2019 – 2027
8.2.2.5.3. Asia
Pacific
8.2.2.5.3.1. Market
Estimation, 2015 – 2018
8.2.2.5.3.2. Market
Forecast, 2019 – 2027
8.2.2.5.4. Middle
East and Africa
8.2.2.5.4.1. Market
Estimation, 2015 – 2018
8.2.2.5.4.2. Market
Forecast, 2019 – 2027
8.2.2.5.5. Latin
America
8.2.2.5.5.1. Market
Estimation, 2015 – 2018
8.2.2.5.5.2. Market
Forecast, 2019 – 2027
8.2.3. Supplier
Financed
8.2.3.1. Definition
8.2.3.2. Market
Estimation and Penetration, 2015 – 2018
8.2.3.3. Market
Forecast, 2019 – 2027
8.2.3.4. Compound
Annual Growth Rate (CAGR)
8.2.3.5. Regional
Bifurcation
8.2.3.5.1. North
America
8.2.3.5.1.1. Market
Estimation, 2015 – 2018
8.2.3.5.1.2. Market
Forecast, 2019 – 2027
8.2.3.5.2. Europe
8.2.3.5.2.1. Market
Estimation, 2015 – 2018
8.2.3.5.2.2. Market
Forecast, 2019 – 2027
8.2.3.5.3. Asia
Pacific
8.2.3.5.3.1. Market
Estimation, 2015 – 2018
8.2.3.5.3.2. Market
Forecast, 2019 – 2027
8.2.3.5.4. Middle
East and Africa
8.2.3.5.4.1. Market
Estimation, 2015 – 2018
8.2.3.5.4.2. Market
Forecast, 2019 – 2027
8.2.3.5.5. Latin
America
8.2.3.5.5.1. Market
Estimation, 2015 – 2018
8.2.3.5.5.2. Market
Forecast, 2019 – 2027
8.2.4. Multiple
Source
8.2.4.1. Definition
8.2.4.2. Market
Estimation and Penetration, 2015 – 2018
8.2.4.3. Market
Forecast, 2019 – 2027
8.2.4.4. Compound
Annual Growth Rate (CAGR)
8.2.4.5. Regional
Bifurcation
8.2.4.5.1. North
America
8.2.4.5.1.1. Market
Estimation, 2015 – 2018
8.2.4.5.1.2. Market
Forecast, 2019 – 2027
8.2.4.5.2. Europe
8.2.4.5.2.1. Market
Estimation, 2015 – 2018
8.2.4.5.2.2. Market
Forecast, 2019 – 2027
8.2.4.5.3. Asia
Pacific
8.2.4.5.3.1. Market
Estimation, 2015 – 2018
8.2.4.5.3.2. Market
Forecast, 2019 – 2027
8.2.4.5.4. Middle
East and Africa
8.2.4.5.4.1. Market
Estimation, 2015 – 2018
8.2.4.5.4.2. Market
Forecast, 2019 – 2027
8.2.4.5.5. Latin
America
8.2.4.5.5.1. Market
Estimation, 2015 – 2018
8.2.4.5.5.2. Market
Forecast, 2019 – 2027
8.3. Key
Segment for Channeling Investments
8.3.1. By Type
9. Global
Sustainable Supply Chain Finance Market Analysis and Forecasts, 2019 – 2027
9.1. Overview
9.2. Global
Sustainable Supply Chain Finance Market Revenue (US$ Mn) and Forecasts, By
Organization Size
9.2.1. Large
Enterprises
9.2.1.1. Definition
9.2.1.2. Market
Estimation and Penetration, 2015 – 2018
9.2.1.3. Market
Forecast, 2019 – 2027
9.2.1.4. Compound
Annual Growth Rate (CAGR)
9.2.1.5. Regional
Bifurcation
9.2.1.5.1. North
America
9.2.1.5.1.1. Market
Estimation, 2015 – 2018
9.2.1.5.1.2. Market
Forecast, 2019 – 2027
9.2.1.5.2. Europe
9.2.1.5.2.1. Market
Estimation, 2015 – 2018
9.2.1.5.2.2. Market
Forecast, 2019 – 2027
9.2.1.5.3. Asia
Pacific
9.2.1.5.3.1. Market
Estimation, 2015 – 2018
9.2.1.5.3.2. Market
Forecast, 2019 – 2027
9.2.1.5.4. Middle
East and Africa
9.2.1.5.4.1. Market
Estimation, 2015 – 2018
9.2.1.5.4.2. Market
Forecast, 2019 – 2027
9.2.1.5.5. Latin
America
9.2.1.5.5.1. Market
Estimation, 2015 – 2018
9.2.1.5.5.2. Market
Forecast, 2019 – 2027
9.2.2. Small
and Medium sized Enterprises
9.2.2.1. Definition
9.2.2.2. Market
Estimation and Penetration, 2015 – 2018
9.2.2.3. Market
Forecast, 2019 – 2027
9.2.2.4. Compound
Annual Growth Rate (CAGR)
9.2.2.5. Regional
Bifurcation
9.2.2.5.1. North
America
9.2.2.5.1.1. Market
Estimation, 2015 – 2018
9.2.2.5.1.2. Market
Forecast, 2019 – 2027
9.2.2.5.2. Europe
9.2.2.5.2.1. Market
Estimation, 2015 – 2018
9.2.2.5.2.2. Market
Forecast, 2019 – 2027
9.2.2.5.3. Asia
Pacific
9.2.2.5.3.1. Market
Estimation, 2015 – 2018
9.2.2.5.3.2. Market
Forecast, 2019 – 2027
9.2.2.5.4. Middle
East and Africa
9.2.2.5.4.1. Market
Estimation, 2015 – 2018
9.2.2.5.4.2. Market
Forecast, 2019 – 2027
9.2.2.5.5. Latin
America
9.2.2.5.5.1. Market
Estimation, 2015 – 2018
9.2.2.5.5.2. Market
Forecast, 2019 – 2027
9.3. Key
Segment for Channeling Investments
9.3.1. By
Organization Size
10. Global
Sustainable Supply Chain Finance Market Analysis and Forecasts, 2019 – 2027
10.1. Overview
10.2. Global
Sustainable Supply Chain Finance Market Revenue (US$ Mn) and Forecasts, By
End-user
10.2.1. Foot
and Apparel
10.2.1.1. Definition
10.2.1.2. Market
Estimation and Penetration, 2015 – 2018
10.2.1.3. Market
Forecast, 2019 – 2027
10.2.1.4. Compound
Annual Growth Rate (CAGR)
10.2.1.5. Regional
Bifurcation
10.2.1.5.1. North
America
10.2.1.5.1.1. Market
Estimation, 2015 – 2018
10.2.1.5.1.2. Market
Forecast, 2019 – 2027
10.2.1.5.2. Europe
10.2.1.5.2.1. Market
Estimation, 2015 – 2018
10.2.1.5.2.2. Market
Forecast, 2019 – 2027
10.2.1.5.3. Asia
Pacific
10.2.1.5.3.1. Market
Estimation, 2015 – 2018
10.2.1.5.3.2. Market
Forecast, 2019 – 2027
10.2.1.5.4. Middle
East and Africa
10.2.1.5.4.1. Market
Estimation, 2015 – 2018
10.2.1.5.4.2. Market
Forecast, 2019 – 2027
10.2.1.5.5. Latin
America
10.2.1.5.5.1. Market
Estimation, 2015 – 2018
10.2.1.5.5.2. Market
Forecast, 2019 – 2027
10.2.2. Food
and Beverages
10.2.2.1. Definition
10.2.2.2. Market
Estimation and Penetration, 2015 – 2018
10.2.2.3. Market
Forecast, 2019 – 2027
10.2.2.4. Compound
Annual Growth Rate (CAGR)
10.2.2.5. Regional
Bifurcation
10.2.2.5.1. North
America
10.2.2.5.1.1. Market
Estimation, 2015 – 2018
10.2.2.5.1.2. Market
Forecast, 2019 – 2027
10.2.2.5.2. Europe
10.2.2.5.2.1. Market
Estimation, 2015 – 2018
10.2.2.5.2.2. Market
Forecast, 2019 – 2027
10.2.2.5.3. Asia
Pacific
10.2.2.5.3.1. Market
Estimation, 2015 – 2018
10.2.2.5.3.2. Market
Forecast, 2019 – 2027
10.2.2.5.4. Middle
East and Africa
10.2.2.5.4.1. Market
Estimation, 2015 – 2018
10.2.2.5.4.2. Market
Forecast, 2019 – 2027
10.2.2.5.5. Latin
America
10.2.2.5.5.1. Market
Estimation, 2015 – 2018
10.2.2.5.5.2. Market
Forecast, 2019 – 2027
10.2.3. Power
and Energy
10.2.3.1. Definition
10.2.3.2. Market
Estimation and Penetration, 2015 – 2018
10.2.3.3. Market
Forecast, 2019 – 2027
10.2.3.4. Compound
Annual Growth Rate (CAGR)
10.2.3.5. Regional
Bifurcation
10.2.3.5.1. North
America
10.2.3.5.1.1. Market
Estimation, 2015 – 2018
10.2.3.5.1.2. Market
Forecast, 2019 – 2027
10.2.3.5.2. Europe
10.2.3.5.2.1. Market
Estimation, 2015 – 2018
10.2.3.5.2.2. Market
Forecast, 2019 – 2027
10.2.3.5.3. Asia
Pacific
10.2.3.5.3.1. Market
Estimation, 2015 – 2018
10.2.3.5.3.2. Market
Forecast, 2019 – 2027
10.2.3.5.4. Middle
East and Africa
10.2.3.5.4.1. Market
Estimation, 2015 – 2018
10.2.3.5.4.2. Market
Forecast, 2019 – 2027
10.2.3.5.5. Latin
America
10.2.3.5.5.1. Market
Estimation, 2015 – 2018
10.2.3.5.5.2. Market
Forecast, 2019 – 2027
10.2.4. Automobile
10.2.4.1. Definition
10.2.4.2. Market
Estimation and Penetration, 2015 – 2018
10.2.4.3. Market
Forecast, 2019 – 2027
10.2.4.4. Compound
Annual Growth Rate (CAGR)
10.2.4.5. Regional
Bifurcation
10.2.4.5.1. North
America
10.2.4.5.1.1. Market
Estimation, 2015 – 2018
10.2.4.5.1.2. Market
Forecast, 2019 – 2027
10.2.4.5.2. Europe
10.2.4.5.2.1. Market
Estimation, 2015 – 2018
10.2.4.5.2.2. Market
Forecast, 2019 – 2027
10.2.4.5.3. Asia
Pacific
10.2.4.5.3.1. Market
Estimation, 2015 – 2018
10.2.4.5.3.2. Market
Forecast, 2019 – 2027
10.2.4.5.4. Middle
East and Africa
10.2.4.5.4.1. Market
Estimation, 2015 – 2018
10.2.4.5.4.2. Market
Forecast, 2019 – 2027
10.2.4.5.5. Latin
America
10.2.4.5.5.1. Market
Estimation, 2015 – 2018
10.2.4.5.5.2. Market
Forecast, 2019 – 2027
10.2.5. Chemical
and Materials
10.2.5.1. Definition
10.2.5.2. Market
Estimation and Penetration, 2015 – 2018
10.2.5.3. Market
Forecast, 2019 – 2027
10.2.5.4. Compound
Annual Growth Rate (CAGR)
10.2.5.5. Regional
Bifurcation
10.2.5.5.1. North
America
10.2.5.5.1.1. Market
Estimation, 2015 – 2018
10.2.5.5.1.2. Market
Forecast, 2019 – 2027
10.2.5.5.2. Europe
10.2.5.5.2.1. Market
Estimation, 2015 – 2018
10.2.5.5.2.2. Market
Forecast, 2019 – 2027
10.2.5.5.3. Asia
Pacific
10.2.5.5.3.1. Market
Estimation, 2015 – 2018
10.2.5.5.3.2. Market
Forecast, 2019 – 2027
10.2.5.5.4. Middle
East and Africa
10.2.5.5.4.1. Market
Estimation, 2015 – 2018
10.2.5.5.4.2. Market
Forecast, 2019 – 2027
10.2.5.5.5. Latin
America
10.2.5.5.5.1. Market
Estimation, 2015 – 2018
10.2.5.5.5.2. Market
Forecast, 2019 – 2027
10.2.6. Manufacturing
10.2.6.1. Definition
10.2.6.2. Market
Estimation and Penetration, 2015 – 2018
10.2.6.3. Market
Forecast, 2019 – 2027
10.2.6.4. Compound
Annual Growth Rate (CAGR)
10.2.6.5. Regional
Bifurcation
10.2.6.5.1. North
America
10.2.6.5.1.1. Market
Estimation, 2015 – 2018
10.2.6.5.1.2. Market
Forecast, 2019 – 2027
10.2.6.5.2. Europe
10.2.6.5.2.1. Market
Estimation, 2015 – 2018
10.2.6.5.2.2. Market
Forecast, 2019 – 2027
10.2.6.5.3. Asia
Pacific
10.2.6.5.3.1. Market
Estimation, 2015 – 2018
10.2.6.5.3.2. Market
Forecast, 2019 – 2027
10.2.6.5.4. Middle
East and Africa
10.2.6.5.4.1. Market
Estimation, 2015 – 2018
10.2.6.5.4.2. Market
Forecast, 2019 – 2027
10.2.6.5.5. Latin
America
10.2.6.5.5.1. Market
Estimation, 2015 – 2018
10.2.6.5.5.2. Market
Forecast, 2019 – 2027
10.2.7. Others
10.2.7.1. Definition
10.2.7.2. Market
Estimation and Penetration, 2015 – 2018
10.2.7.3. Market
Forecast, 2019 – 2027
10.2.7.4. Compound
Annual Growth Rate (CAGR)
10.2.7.5. Regional
Bifurcation
10.2.7.5.1. North
America
10.2.7.5.1.1. Market
Estimation, 2015 – 2018
10.2.7.5.1.2. Market
Forecast, 2019 – 2027
10.2.7.5.2. Europe
10.2.7.5.2.1. Market
Estimation, 2015 – 2018
10.2.7.5.2.2. Market
Forecast, 2019 – 2027
10.2.7.5.3. Asia
Pacific
10.2.7.5.3.1. Market
Estimation, 2015 – 2018
10.2.7.5.3.2. Market
Forecast, 2019 – 2027
10.2.7.5.4. Middle
East and Africa
10.2.7.5.4.1. Market
Estimation, 2015 – 2018
10.2.7.5.4.2. Market
Forecast, 2019 – 2027
10.2.7.5.5. Latin
America
10.2.7.5.5.1. Market
Estimation, 2015 – 2018
10.2.7.5.5.2. Market
Forecast, 2019 – 2027
10.3. Key
Segment for Channeling Investments
10.3.1. By
End-user
11. North
America Sustainable Supply Chain Finance Market Analysis and Forecasts, 2019 -
2027
11.1. Overview
11.1.1. North
America Sustainable Supply Chain Finance Market Revenue (US$ Mn)
11.2. North
America Sustainable Supply Chain Finance Market Revenue (US$ Mn) and Forecasts,
By Type
11.2.1. Financial
Institution
11.2.2. Buyer
Financed
11.2.3. Supplier
Financed
11.2.4. Multiple
Source
11.3. North
America Sustainable Supply Chain Finance Market Revenue (US$ Mn) and Forecasts,
By Organization Size
11.3.1. Large
Enterprises
11.3.2. Small
and Medium sized Enterprises
11.4. North
America Sustainable Supply Chain Finance Market Revenue (US$ Mn) and Forecasts,
By End-user
11.4.1. Foot
and Apparel
11.4.2. Food
and Beverages
11.4.3. Power
and Energy
11.4.4. Automobile
11.4.5. Chemical
and Materials
11.4.6. Manufacturing
11.4.7. Others
11.5. North
America Sustainable Supply Chain Finance Market Revenue (US$ Mn) and Forecasts,
By Country
11.5.1. U.S
11.5.1.1. U.S
Sustainable Supply Chain Finance Market Revenue (US$ Mn) and Forecasts, By Type
11.5.1.1.1. Financial
Institution
11.5.1.1.2. Buyer
Financed
11.5.1.1.3. Supplier
Financed
11.5.1.1.4. Multiple
Source
11.5.1.2. U.S
Sustainable Supply Chain Finance Market Revenue (US$ Mn) and Forecasts, By
Organization Size
11.5.1.2.1. Large
Enterprises
11.5.1.2.2. Small
and Medium sized Enterprises
11.5.1.3. U.S
Sustainable Supply Chain Finance Market Revenue (US$ Mn) and Forecasts, By
End-user
11.5.1.3.1. Foot
and Apparel
11.5.1.3.2. Food
and Beverages
11.5.1.3.3. Power
and Energy
11.5.1.3.4. Automobile
11.5.1.3.5. Chemical
and Materials
11.5.1.3.6. Manufacturing
11.5.1.3.7. Others
11.5.2. Canada
11.5.2.1. Canada
Sustainable Supply Chain Finance Market Revenue (US$ Mn) and Forecasts, By Type
11.5.2.1.1. Financial
Institution
11.5.2.1.2. Buyer
Financed
11.5.2.1.3. Supplier
Financed
11.5.2.1.4. Multiple
Source
11.5.2.2. Canada
Sustainable Supply Chain Finance Market Revenue (US$ Mn) and Forecasts, By
Organization Size
11.5.2.2.1. Large
Enterprises
11.5.2.2.2. Small
and Medium sized Enterprises
11.5.2.3. Canada
Sustainable Supply Chain Finance Market Revenue (US$ Mn) and Forecasts, By
End-user
11.5.2.3.1. Foot
and Apparel
11.5.2.3.2. Food
and Beverages
11.5.2.3.3. Power
and Energy
11.5.2.3.4. Automobile
11.5.2.3.5. Chemical
and Materials
11.5.2.3.6. Manufacturing
11.5.2.3.7. Others
11.5.3. Mexico
11.5.3.1. Mexico
Sustainable Supply Chain Finance Market Revenue (US$ Mn) and Forecasts, By Type
11.5.3.1.1. Financial
Institution
11.5.3.1.2. Buyer
Financed
11.5.3.1.3. Supplier
Financed
11.5.3.1.4. Multiple
Source
11.5.3.2. Mexico
Sustainable Supply Chain Finance Market Revenue (US$ Mn) and Forecasts, By
Organization Size
11.5.3.2.1. Large
Enterprises
11.5.3.2.2. Small
and Medium sized Enterprises
11.5.3.3. Mexico
Sustainable Supply Chain Finance Market Revenue (US$ Mn) and Forecasts, By
End-user
11.5.3.3.1. Foot
and Apparel
11.5.3.3.2. Food
and Beverages
11.5.3.3.3. Power
and Energy
11.5.3.3.4. Automobile
11.5.3.3.5. Chemical
and Materials
11.5.3.3.6. Manufacturing
11.5.3.3.7. Others
11.5.4. Rest of
North America
11.5.4.1. Rest
of North America Sustainable Supply Chain Finance Market Revenue (US$ Mn) and
Forecasts, By Type
11.5.4.1.1. Financial
Institution
11.5.4.1.2. Buyer
Financed
11.5.4.1.3. Supplier
Financed
11.5.4.1.4. Multiple
Source
11.5.4.2. Rest
of North America Sustainable Supply Chain Finance Market Revenue (US$ Mn) and
Forecasts, By Organization Size
11.5.4.2.1. Large
Enterprises
11.5.4.2.2. Small
and Medium sized Enterprises
11.5.4.3. Rest
of North America Sustainable Supply Chain Finance Market Revenue (US$ Mn) and
Forecasts, By End-user
11.5.4.3.1. Foot
and Apparel
11.5.4.3.2. Food
and Beverages
11.5.4.3.3. Power
and Energy
11.5.4.3.4. Automobile
11.5.4.3.5. Chemical
and Materials
11.5.4.3.6. Manufacturing
11.5.4.3.7. Others
11.6. Key
Segment for Channeling Investments
11.6.1. By
Country
11.6.2. By Type
11.6.3. By
Organization Size
11.6.4. By
End-user
12. Europe
Sustainable Supply Chain Finance Market Analysis and Forecasts, 2019 - 2027
12.1. Overview
12.1.1. Europe
Sustainable Supply Chain Finance Market Revenue (US$ Mn)
12.2. Europe
Sustainable Supply Chain Finance Market Revenue (US$ Mn) and Forecasts, By Type
12.2.1. Financial
Institution
12.2.2. Buyer
Financed
12.2.3. Supplier
Financed
12.2.4. Multiple
Source
12.3. Europe
Sustainable Supply Chain Finance Market Revenue (US$ Mn) and Forecasts, By
Organization Size
12.3.1. Large
Enterprises
12.3.2. Small
and Medium sized Enterprises
12.4. Europe
Sustainable Supply Chain Finance Market Revenue (US$ Mn) and Forecasts, By
End-user
12.4.1. Foot
and Apparel
12.4.2. Food
and Beverages
12.4.3. Power
and Energy
12.4.4. Automobile
12.4.5. Chemical
and Materials
12.4.6. Manufacturing
12.4.7. Others
12.5. Europe
Sustainable Supply Chain Finance Market Revenue (US$ Mn) and Forecasts, By
Country
12.5.1. France
12.5.1.1. France
Sustainable Supply Chain Finance Market Revenue (US$ Mn) and Forecasts, By Type
12.5.1.1.1. Financial
Institution
12.5.1.1.2. Buyer
Financed
12.5.1.1.3. Supplier
Financed
12.5.1.1.4. Multiple
Source
12.5.1.2. France
Sustainable Supply Chain Finance Market Revenue (US$ Mn) and Forecasts, By
Organization Size
12.5.1.2.1. Large
Enterprises
12.5.1.2.2. Small
and Medium sized Enterprises
12.5.1.3. France
Sustainable Supply Chain Finance Market Revenue (US$ Mn) and Forecasts, By
End-user
12.5.1.3.1. Foot
and Apparel
12.5.1.3.2. Food
and Beverages
12.5.1.3.3. Power
and Energy
12.5.1.3.4. Automobile
12.5.1.3.5. Chemical
and Materials
12.5.1.3.6. Manufacturing
12.5.1.3.7. Others
12.5.2. The UK
12.5.2.1. The
UK Sustainable Supply Chain Finance Market Revenue (US$ Mn) and Forecasts, By
Type
12.5.2.1.1. Financial
Institution
12.5.2.1.2. Buyer
Financed
12.5.2.1.3. Supplier
Financed
12.5.2.1.4. Multiple
Source
12.5.2.2. The
UK Sustainable Supply Chain Finance Market Revenue (US$ Mn) and Forecasts, By
Organization Size
12.5.2.2.1. Large
Enterprises
12.5.2.2.2. Small
and Medium sized Enterprises
12.5.2.3. The
UK Sustainable Supply Chain Finance Market Revenue (US$ Mn) and Forecasts, By
End-user
12.5.2.3.1. Foot
and Apparel
12.5.2.3.2. Food
and Beverages
12.5.2.3.3. Power
and Energy
12.5.2.3.4. Automobile
12.5.2.3.5. Chemical
and Materials
12.5.2.3.6. Manufacturing
12.5.2.3.7. Others
12.5.3. Spain
12.5.3.1. Spain
Sustainable Supply Chain Finance Market Revenue (US$ Mn) and Forecasts, By Type
12.5.3.1.1. Financial
Institution
12.5.3.1.2. Buyer
Financed
12.5.3.1.3. Supplier
Financed
12.5.3.1.4. Multiple
Source
12.5.3.2. Spain
Sustainable Supply Chain Finance Market Revenue (US$ Mn) and Forecasts, By
Organization Size
12.5.3.2.1. Large
Enterprises
12.5.3.2.2. Small
and Medium sized Enterprises
12.5.3.3. Spain
Sustainable Supply Chain Finance Market Revenue (US$ Mn) and Forecasts, By
End-user
12.5.3.3.1. Foot
and Apparel
12.5.3.3.2. Food
and Beverages
12.5.3.3.3. Power
and Energy
12.5.3.3.4. Automobile
12.5.3.3.5. Chemical
and Materials
12.5.3.3.6. Manufacturing
12.5.3.3.7. Others
12.5.4. Germany
12.5.4.1. Germany
Sustainable Supply Chain Finance Market Revenue (US$ Mn) and Forecasts, By Type
12.5.4.1.1. Financial
Institution
12.5.4.1.2. Buyer
Financed
12.5.4.1.3. Supplier
Financed
12.5.4.1.4. Multiple
Source
12.5.4.2. Germany
Sustainable Supply Chain Finance Market Revenue (US$ Mn) and Forecasts, By
Organization Size
12.5.4.2.1. Large
Enterprises
12.5.4.2.2. Small
and Medium sized Enterprises
12.5.4.3. Germany
Sustainable Supply Chain Finance Market Revenue (US$ Mn) and Forecasts, By
End-user
12.5.4.3.1. Foot
and Apparel
12.5.4.3.2. Food
and Beverages
12.5.4.3.3. Power
and Energy
12.5.4.3.4. Automobile
12.5.4.3.5. Chemical
and Materials
12.5.4.3.6. Manufacturing
12.5.4.3.7. Others
12.5.5. Italy
12.5.5.1. Italy
Sustainable Supply Chain Finance Market Revenue (US$ Mn) and Forecasts, By Type
12.5.5.1.1. Financial
Institution
12.5.5.1.2. Buyer
Financed
12.5.5.1.3. Supplier
Financed
12.5.5.1.4. Multiple
Source
12.5.5.2. Italy
Sustainable Supply Chain Finance Market Revenue (US$ Mn) and Forecasts, By
Organization Size
12.5.5.2.1. Large
Enterprises
12.5.5.2.2. Small
and Medium sized Enterprises
12.5.5.3. Italy
Sustainable Supply Chain Finance Market Revenue (US$ Mn) and Forecasts, By
End-user
12.5.5.3.1. Foot
and Apparel
12.5.5.3.2. Food
and Beverages
12.5.5.3.3. Power
and Energy
12.5.5.3.4. Automobile
12.5.5.3.5. Chemical
and Materials
12.5.5.3.6. Manufacturing
12.5.5.3.7. Others
12.5.6. Nordic
Countries
12.5.6.1. Nordic
Countries Sustainable Supply Chain Finance Market Revenue (US$ Mn) and
Forecasts, By Type
12.5.6.1.1. Financial
Institution
12.5.6.1.2. Buyer
Financed
12.5.6.1.3. Supplier
Financed
12.5.6.1.4. Multiple
Source
12.5.6.2. Nordic
Countries Sustainable Supply Chain Finance Market Revenue (US$ Mn) and
Forecasts, By Organization Size
12.5.6.2.1. Large
Enterprises
12.5.6.2.2. Small
and Medium sized Enterprises
12.5.6.3. Nordic
Countries Sustainable Supply Chain Finance Market Revenue (US$ Mn) and
Forecasts, By End-user
12.5.6.3.1. Foot
and Apparel
12.5.6.3.2. Food
and Beverages
12.5.6.3.3. Power
and Energy
12.5.6.3.4. Automobile
12.5.6.3.5. Chemical
and Materials
12.5.6.3.6. Manufacturing
12.5.6.3.7. Others
12.5.6.4. Nordic
Countries Sustainable Supply Chain Finance Market Revenue (US$ Mn) and
Forecasts, By Country
12.5.6.4.1. Denmark
12.5.6.4.2. Finland
12.5.6.4.3. Iceland
12.5.6.4.4. Sweden
12.5.6.4.5. Norway
12.5.7. Benelux
Union
12.5.7.1. Benelux
Union Sustainable Supply Chain Finance Market Revenue (US$ Mn) and Forecasts,
By Type
12.5.7.1.1. Financial
Institution
12.5.7.1.2. Buyer
Financed
12.5.7.1.3. Supplier
Financed
12.5.7.1.4. Multiple
Source
12.5.7.2. Benelux
Union Sustainable Supply Chain Finance Market Revenue (US$ Mn) and Forecasts,
By Organization Size
12.5.7.2.1. Large
Enterprises
12.5.7.2.2. Small
and Medium sized Enterprises
12.5.7.3. Benelux
Union Sustainable Supply Chain Finance Market Revenue (US$ Mn) and Forecasts,
By End-user
12.5.7.3.1. Foot
and Apparel
12.5.7.3.2. Food
and Beverages
12.5.7.3.3. Power
and Energy
12.5.7.3.4. Automobile
12.5.7.3.5. Chemical
and Materials
12.5.7.3.6. Manufacturing
12.5.7.3.7. Others
12.5.7.4. Benelux
Union Sustainable Supply Chain Finance Market Revenue (US$ Mn) and Forecasts,
By Country
12.5.7.4.1. Belgium
12.5.7.4.2. The
Netherlands
12.5.7.4.3. Luxembourg
12.5.8. Rest of
Europe
12.5.8.1. Rest
of Europe Sustainable Supply Chain Finance Market Revenue (US$ Mn) and
Forecasts, By Type
12.5.8.1.1. Financial
Institution
12.5.8.1.2. Buyer
Financed
12.5.8.1.3. Supplier
Financed
12.5.8.1.4. Multiple
Source
12.5.8.2. Rest
of Europe Sustainable Supply Chain Finance Market Revenue (US$ Mn) and
Forecasts, By Organization Size
12.5.8.2.1. Large
Enterprises
12.5.8.2.2. Small
and Medium sized Enterprises
12.5.8.3. Rest
of Europe Sustainable Supply Chain Finance Market Revenue (US$ Mn) and
Forecasts, By End-user
12.5.8.3.1. Foot
and Apparel
12.5.8.3.2. Food
and Beverages
12.5.8.3.3. Power
and Energy
12.5.8.3.4. Automobile
12.5.8.3.5. Chemical
and Materials
12.5.8.3.6. Manufacturing
12.5.8.3.7. Others
12.6. Key
Segment for Channeling Investments
12.6.1. By
Country
12.6.2. By Type
12.6.3. By
Organization Size
12.6.4. By
End-user
13. Asia
Pacific Sustainable Supply Chain Finance Market Analysis and Forecasts, 2019 -
2027
13.1. Overview
13.1.1. Asia
Pacific Sustainable Supply Chain Finance Market Revenue (US$ Mn)
13.2. Asia
Pacific Sustainable Supply Chain Finance Market Revenue (US$ Mn) and Forecasts,
By Type
13.2.1. Financial
Institution
13.2.2. Buyer
Financed
13.2.3. Supplier
Financed
13.2.4. Multiple
Source
13.3. Asia
Pacific Sustainable Supply Chain Finance Market Revenue (US$ Mn) and Forecasts,
By Organization Size
13.3.1. Large
Enterprises
13.3.2. Small
and Medium sized Enterprises
13.4. Asia
Pacific Sustainable Supply Chain Finance Market Revenue (US$ Mn) and Forecasts,
By End-user
13.4.1. Foot
and Apparel
13.4.2. Food
and Beverages
13.4.3. Power
and Energy
13.4.4. Automobile
13.4.5. Chemical
and Materials
13.4.6. Manufacturing
13.4.7. Others
13.5. Asia
Pacific Sustainable Supply Chain Finance Market Revenue (US$ Mn) and Forecasts,
By Country
13.5.1. China
13.5.1.1. China
Sustainable Supply Chain Finance Market Revenue (US$ Mn) and Forecasts, By Type
13.5.1.1.1. Financial
Institution
13.5.1.1.2. Buyer
Financed
13.5.1.1.3. Supplier
Financed
13.5.1.1.4. Multiple
Source
13.5.1.2. China
Sustainable Supply Chain Finance Market Revenue (US$ Mn) and Forecasts, By
Organization Size
13.5.1.2.1. Large
Enterprises
13.5.1.2.2. Small
and Medium sized Enterprises
13.5.1.3. China
Sustainable Supply Chain Finance Market Revenue (US$ Mn) and Forecasts, By
End-user
13.5.1.3.1. Foot
and Apparel
13.5.1.3.2. Food
and Beverages
13.5.1.3.3. Power
and Energy
13.5.1.3.4. Automobile
13.5.1.3.5. Chemical
and Materials
13.5.1.3.6. Manufacturing
13.5.1.3.7. Others
13.5.2. Japan
13.5.2.1. Japan
Sustainable Supply Chain Finance Market Revenue (US$ Mn) and Forecasts, By Type
13.5.2.1.1. Financial
Institution
13.5.2.1.2. Buyer
Financed
13.5.2.1.3. Supplier
Financed
13.5.2.1.4. Multiple
Source
13.5.2.2. Japan
Sustainable Supply Chain Finance Market Revenue (US$ Mn) and Forecasts, By
Organization Size
13.5.2.2.1. Large
Enterprises
13.5.2.2.2. Small
and Medium sized Enterprises
13.5.2.3. Japan
Sustainable Supply Chain Finance Market Revenue (US$ Mn) and Forecasts, By
End-user
13.5.2.3.1. Foot
and Apparel
13.5.2.3.2. Food
and Beverages
13.5.2.3.3. Power
and Energy
13.5.2.3.4. Automobile
13.5.2.3.5. Chemical
and Materials
13.5.2.3.6. Manufacturing
13.5.2.3.7. Others
13.5.3. India
13.5.3.1. India
Sustainable Supply Chain Finance Market Revenue (US$ Mn) and Forecasts, By Type
13.5.3.1.1. Financial
Institution
13.5.3.1.2. Buyer
Financed
13.5.3.1.3. Supplier
Financed
13.5.3.1.4. Multiple
Source
13.5.3.2. India
Sustainable Supply Chain Finance Market Revenue (US$ Mn) and Forecasts, By
Organization Size
13.5.3.2.1. Large
Enterprises
13.5.3.2.2. Small
and Medium sized Enterprises
13.5.3.3. India
Sustainable Supply Chain Finance Market Revenue (US$ Mn) and Forecasts, By
End-user
13.5.3.3.1. Foot
and Apparel
13.5.3.3.2. Food
and Beverages
13.5.3.3.3. Power
and Energy
13.5.3.3.4. Automobile
13.5.3.3.5. Chemical
and Materials
13.5.3.3.6. Manufacturing
13.5.3.3.7. Others
13.5.4. New
Zealand
13.5.4.1. New
Zealand Sustainable Supply Chain Finance Market Revenue (US$ Mn) and Forecasts,
By Type
13.5.4.1.1. Financial
Institution
13.5.4.1.2. Buyer
Financed
13.5.4.1.3. Supplier
Financed
13.5.4.1.4. Multiple
Source
13.5.4.2. New
Zealand Sustainable Supply Chain Finance Market Revenue (US$ Mn) and Forecasts,
By Organization Size
13.5.4.2.1. Large
Enterprises
13.5.4.2.2. Small
and Medium sized Enterprises
13.5.4.3. New
Zealand Sustainable Supply Chain Finance Market Revenue (US$ Mn) and Forecasts,
By End-user
13.5.4.3.1. Foot
and Apparel
13.5.4.3.2. Food
and Beverages
13.5.4.3.3. Power
and Energy
13.5.4.3.4. Automobile
13.5.4.3.5. Chemical
and Materials
13.5.4.3.6. Manufacturing
13.5.4.3.7. Others
13.5.5. Australia
13.5.5.1. Australia
Sustainable Supply Chain Finance Market Revenue (US$ Mn) and Forecasts, By Type
13.5.5.1.1. Financial
Institution
13.5.5.1.2. Buyer
Financed
13.5.5.1.3. Supplier
Financed
13.5.5.1.4. Multiple
Source
13.5.5.2. Australia
Sustainable Supply Chain Finance Market Revenue (US$ Mn) and Forecasts, By
Organization Size
13.5.5.2.1. Large
Enterprises
13.5.5.2.2. Small
and Medium sized Enterprises
13.5.5.3. Australia
Sustainable Supply Chain Finance Market Revenue (US$ Mn) and Forecasts, By
End-user
13.5.5.3.1. Foot
and Apparel
13.5.5.3.2. Food
and Beverages
13.5.5.3.3. Power
and Energy
13.5.5.3.4. Automobile
13.5.5.3.5. Chemical
and Materials
13.5.5.3.6. Manufacturing
13.5.5.3.7. Others
13.5.6. South
Korea
13.5.6.1. South
Korea Sustainable Supply Chain Finance Market Revenue (US$ Mn) and Forecasts,
By Type
13.5.6.1.1. Financial
Institution
13.5.6.1.2. Buyer
Financed
13.5.6.1.3. Supplier
Financed
13.5.6.1.4. Multiple
Source
13.5.6.2. South
Korea Sustainable Supply Chain Finance Market Revenue (US$ Mn) and Forecasts,
By Organization Size
13.5.6.2.1. Large
Enterprises
13.5.6.2.2. Small
and Medium sized Enterprises
13.5.6.3. South
Korea Sustainable Supply Chain Finance Market Revenue (US$ Mn) and Forecasts,
By End-user
13.5.6.3.1. Foot
and Apparel
13.5.6.3.2. Food
and Beverages
13.5.6.3.3. Power
and Energy
13.5.6.3.4. Automobile
13.5.6.3.5. Chemical
and Materials
13.5.6.3.6. Manufacturing
13.5.6.3.7. Others
13.5.7. Southeast
Asia
13.5.7.1. Southeast
Asia Sustainable Supply Chain Finance Market Revenue (US$ Mn) and Forecasts, By
Type
13.5.7.1.1. Financial
Institution
13.5.7.1.2. Buyer
Financed
13.5.7.1.3. Supplier
Financed
13.5.7.1.4. Multiple
Source
13.5.7.2. Southeast
Asia Sustainable Supply Chain Finance Market Revenue (US$ Mn) and Forecasts, By
Organization Size
13.5.7.2.1. Large
Enterprises
13.5.7.2.2. Small
and Medium sized Enterprises
13.5.7.3. Southeast
Asia Sustainable Supply Chain Finance Market Revenue (US$ Mn) and Forecasts, By
End-user
13.5.7.3.1. Foot
and Apparel
13.5.7.3.2. Food
and Beverages
13.5.7.3.3. Power
and Energy
13.5.7.3.4. Automobile
13.5.7.3.5. Chemical
and Materials
13.5.7.3.6. Manufacturing
13.5.7.3.7. Others
13.5.7.4. Southeast
Asia Sustainable Supply Chain Finance Market Revenue (US$ Mn) and Forecasts, By
Country
13.5.7.4.1. Indonesia
13.5.7.4.2. Thailand
13.5.7.4.3. Malaysia
13.5.7.4.4. Singapore
13.5.7.4.5. Rest
of Southeast Asia
13.5.8. Rest of
Asia Pacific
13.5.8.1. Rest
of Asia Pacific Sustainable Supply Chain Finance Market Revenue (US$ Mn) and
Forecasts, By Type
13.5.8.1.1. Financial
Institution
13.5.8.1.2. Buyer
Financed
13.5.8.1.3. Supplier
Financed
13.5.8.1.4. Multiple
Source
13.5.8.2. Rest
of Asia Pacific Sustainable Supply Chain Finance Market Revenue (US$ Mn) and
Forecasts, By Organization Size
13.5.8.2.1. Large
Enterprises
13.5.8.2.2. Small
and Medium sized Enterprises
13.5.8.3. Rest
of Asia Pacific Sustainable Supply Chain Finance Market Revenue (US$ Mn) and
Forecasts, By End-user
13.5.8.3.1. Foot
and Apparel
13.5.8.3.2. Food
and Beverages
13.5.8.3.3. Power
and Energy
13.5.8.3.4. Automobile
13.5.8.3.5. Chemical
and Materials
13.5.8.3.6. Manufacturing
13.5.8.3.7. Others
13.6. Key
Segment for Channeling Investments
13.6.1. By
Country
13.6.2. By Type
13.6.3. By
Organization Size
13.6.4. By
End-user
14. Middle
East and Africa Sustainable Supply Chain Finance Market Analysis and Forecasts,
2019 - 2027
14.1. Overview
14.1.1. Middle
East and Africa Sustainable Supply Chain Finance Market Revenue (US$ Mn)
14.2. Middle
East and Africa Sustainable Supply Chain Finance Market Revenue (US$ Mn) and
Forecasts, By Type
14.2.1. Financial
Institution
14.2.2. Buyer
Financed
14.2.3. Supplier
Financed
14.2.4. Multiple
Source
14.3. Middle
East and Africa Sustainable Supply Chain Finance Market Revenue (US$ Mn) and
Forecasts, By Organization Size
14.3.1. Large
Enterprises
14.3.2. Small
and Medium sized Enterprises
14.4. Middle
East and Africa Sustainable Supply Chain Finance Market Revenue (US$ Mn) and
Forecasts, By End-user
14.4.1. Foot
and Apparel
14.4.2. Food
and Beverages
14.4.3. Power
and Energy
14.4.4. Automobile
14.4.5. Chemical
and Materials
14.4.6. Manufacturing
14.4.7. Others
14.5. Middle
East and Africa Sustainable Supply Chain Finance Market Revenue (US$ Mn) and
Forecasts, By Country
14.5.1. Saudi
Arabia
14.5.1.1. Saudi
Arabia Sustainable Supply Chain Finance Market Revenue (US$ Mn) and Forecasts,
By Type
14.5.1.1.1. Financial
Institution
14.5.1.1.2. Buyer
Financed
14.5.1.1.3. Supplier
Financed
14.5.1.1.4. Multiple
Source
14.5.1.2. Saudi
Arabia Sustainable Supply Chain Finance Market Revenue (US$ Mn) and Forecasts,
By Organization Size
14.5.1.2.1. Large
Enterprises
14.5.1.2.2. Small
and Medium sized Enterprises
14.5.1.3. Saudi
Arabia Sustainable Supply Chain Finance Market Revenue (US$ Mn) and Forecasts,
By End-user
14.5.1.3.1. Foot
and Apparel
14.5.1.3.2. Food
and Beverages
14.5.1.3.3. Power
and Energy
14.5.1.3.4. Automobile
14.5.1.3.5. Chemical
and Materials
14.5.1.3.6. Manufacturing
14.5.1.3.7. Others
14.5.2. UAE
14.5.2.1. UAE
Sustainable Supply Chain Finance Market Revenue (US$ Mn) and Forecasts, By Type
14.5.2.1.1. Financial
Institution
14.5.2.1.2. Buyer
Financed
14.5.2.1.3. Supplier
Financed
14.5.2.1.4. Multiple
Source
14.5.2.2. UAE
Sustainable Supply Chain Finance Market Revenue (US$ Mn) and Forecasts, By
Organization Size
14.5.2.2.1. Large
Enterprises
14.5.2.2.2. Small
and Medium sized Enterprises
14.5.2.3. UAE
Sustainable Supply Chain Finance Market Revenue (US$ Mn) and Forecasts, By
End-user
14.5.2.3.1. Foot
and Apparel
14.5.2.3.2. Food
and Beverages
14.5.2.3.3. Power
and Energy
14.5.2.3.4. Automobile
14.5.2.3.5. Chemical
and Materials
14.5.2.3.6. Manufacturing
14.5.2.3.7. Others
14.5.3. Egypt
14.5.3.1. Egypt
Sustainable Supply Chain Finance Market Revenue (US$ Mn) and Forecasts, By Type
14.5.3.1.1. Financial
Institution
14.5.3.1.2. Buyer
Financed
14.5.3.1.3. Supplier
Financed
14.5.3.1.4. Multiple
Source
14.5.3.2. Egypt
Sustainable Supply Chain Finance Market Revenue (US$ Mn) and Forecasts, By
Organization Size
14.5.3.2.1. Large
Enterprises
14.5.3.2.2. Small
and Medium sized Enterprises
14.5.3.3. Egypt
Sustainable Supply Chain Finance Market Revenue (US$ Mn) and Forecasts, By
End-user
14.5.3.3.1. Foot
and Apparel
14.5.3.3.2. Food
and Beverages
14.5.3.3.3. Power
and Energy
14.5.3.3.4. Automobile
14.5.3.3.5. Chemical
and Materials
14.5.3.3.6. Manufacturing
14.5.3.3.7. Others
14.5.4. Kuwait
14.5.4.1. Kuwait
Sustainable Supply Chain Finance Market Revenue (US$ Mn) and Forecasts, By Type
14.5.4.1.1. Financial
Institution
14.5.4.1.2. Buyer
Financed
14.5.4.1.3. Supplier
Financed
14.5.4.1.4. Multiple
Source
14.5.4.2. Kuwait
Sustainable Supply Chain Finance Market Revenue (US$ Mn) and Forecasts, By
Organization Size
14.5.4.2.1. Large
Enterprises
14.5.4.2.2. Small
and Medium sized Enterprises
14.5.4.3. Kuwait
Sustainable Supply Chain Finance Market Revenue (US$ Mn) and Forecasts, By
End-user
14.5.4.3.1. Foot
and Apparel
14.5.4.3.2. Food
and Beverages
14.5.4.3.3. Power
and Energy
14.5.4.3.4. Automobile
14.5.4.3.5. Chemical
and Materials
14.5.4.3.6. Manufacturing
14.5.4.3.7. Others
14.5.5. South
Africa
14.5.5.1. South
Africa Sustainable Supply Chain Finance Market Revenue (US$ Mn) and Forecasts,
By Type
14.5.5.1.1. Financial
Institution
14.5.5.1.2. Buyer
Financed
14.5.5.1.3. Supplier
Financed
14.5.5.1.4. Multiple
Source
14.5.5.2. South
Africa Sustainable Supply Chain Finance Market Revenue (US$ Mn) and Forecasts,
By Organization Size
14.5.5.2.1. Large
Enterprises
14.5.5.2.2. Small
and Medium sized Enterprises
14.5.5.3. South
Africa Sustainable Supply Chain Finance Market Revenue (US$ Mn) and Forecasts,
By End-user
14.5.5.3.1. Foot
and Apparel
14.5.5.3.2. Food
and Beverages
14.5.5.3.3. Power
and Energy
14.5.5.3.4. Automobile
14.5.5.3.5. Chemical
and Materials
14.5.5.3.6. Manufacturing
14.5.5.3.7. Others
14.5.6. Rest of
Middle East & Africa
14.5.6.1. Rest
of Middle East & Africa Sustainable Supply Chain Finance Market Revenue
(US$ Mn) and Forecasts, By Type
14.5.6.1.1. Financial
Institution
14.5.6.1.2. Buyer
Financed
14.5.6.1.3. Supplier
Financed
14.5.6.1.4. Multiple
Source
14.5.6.2. Rest
of Middle East & Africa Sustainable Supply Chain Finance Market Revenue
(US$ Mn) and Forecasts, By Organization Size
14.5.6.2.1. Large
Enterprises
14.5.6.2.2. Small
and Medium sized Enterprises
14.5.6.3. Rest
of Middle East & Africa Sustainable Supply Chain Finance Market Revenue
(US$ Mn) and Forecasts, By End-user
14.5.6.3.1. Foot
and Apparel
14.5.6.3.2. Food
and Beverages
14.5.6.3.3. Power
and Energy
14.5.6.3.4. Automobile
14.5.6.3.5. Chemical
and Materials
14.5.6.3.6. Manufacturing
14.5.6.3.7. Others
14.6. Key
Segment for Channeling Investments
14.6.1. By
Country
14.6.2. By Type
14.6.3. By
Organization Size
14.6.4. By
End-user
15. Latin
America Sustainable Supply Chain Finance Market Analysis and Forecasts, 2019 -
2027
15.1. Overview
15.1.1. Latin
America Sustainable Supply Chain Finance Market Revenue (US$ Mn)
15.2. Latin
America Sustainable Supply Chain Finance Market Revenue (US$ Mn) and Forecasts,
By Type
15.2.1. Financial
Institution
15.2.2. Buyer
Financed
15.2.3. Supplier
Financed
15.2.4. Multiple
Source
15.3. Latin
America Sustainable Supply Chain Finance Market Revenue (US$ Mn) and Forecasts,
By Organization Size
15.3.1. Large
Enterprises
15.3.2. Small
and Medium sized Enterprises
15.4. Latin
America Sustainable Supply Chain Finance Market Revenue (US$ Mn) and Forecasts,
By End-user
15.4.1. Foot
and Apparel
15.4.2. Food
and Beverages
15.4.3. Power
and Energy
15.4.4. Automobile
15.4.5. Chemical
and Materials
15.4.6. Manufacturing
15.4.7. Others
15.5. Latin
America Sustainable Supply Chain Finance Market Revenue (US$ Mn) and Forecasts,
By Country
15.5.1. Brazil
15.5.1.1. Brazil
Sustainable Supply Chain Finance Market Revenue (US$ Mn) and Forecasts, By Type
15.5.1.1.1. Financial
Institution
15.5.1.1.2. Buyer
Financed
15.5.1.1.3. Supplier
Financed
15.5.1.1.4. Multiple
Source
15.5.1.2. Brazil
Sustainable Supply Chain Finance Market Revenue (US$ Mn) and Forecasts, By
Organization Size
15.5.1.2.1. Large
Enterprises
15.5.1.2.2. Small
and Medium sized Enterprises
15.5.1.3. Brazil
Sustainable Supply Chain Finance Market Revenue (US$ Mn) and Forecasts, By
End-user
15.5.1.3.1. Foot
and Apparel
15.5.1.3.2. Food
and Beverages
15.5.1.3.3. Power
and Energy
15.5.1.3.4. Automobile
15.5.1.3.5. Chemical
and Materials
15.5.1.3.6. Manufacturing
15.5.1.3.7. Others
15.5.2. Argentina
15.5.2.1. Argentina
Sustainable Supply Chain Finance Market Revenue (US$ Mn) and Forecasts, By Type
15.5.2.1.1. Financial
Institution
15.5.2.1.2. Buyer
Financed
15.5.2.1.3. Supplier
Financed
15.5.2.1.4. Multiple
Source
15.5.2.2. Argentina
Sustainable Supply Chain Finance Market Revenue (US$ Mn) and Forecasts, By
Organization Size
15.5.2.2.1. Large
Enterprises
15.5.2.2.2. Small
and Medium sized Enterprises
15.5.2.3. Argentina
Sustainable Supply Chain Finance Market Revenue (US$ Mn) and Forecasts, By
End-user
15.5.2.3.1. Foot
and Apparel
15.5.2.3.2. Food
and Beverages
15.5.2.3.3. Power
and Energy
15.5.2.3.4. Automobile
15.5.2.3.5. Chemical
and Materials
15.5.2.3.6. Manufacturing
15.5.2.3.7. Others
15.5.3. Rest of
Latin America
15.5.3.1. Rest
of Latin America Sustainable Supply Chain Finance Market Revenue (US$ Mn) and
Forecasts, By Type
15.5.3.1.1. Financial
Institution
15.5.3.1.2. Buyer
Financed
15.5.3.1.3. Supplier
Financed
15.5.3.1.4. Multiple
Source
15.5.3.2. Rest
of Latin America Sustainable Supply Chain Finance Market Revenue (US$ Mn) and
Forecasts, By Organization Size
15.5.3.2.1. Large
Enterprises
15.5.3.2.2. Small
and Medium sized Enterprises
15.5.3.3. Rest
of Latin America Sustainable Supply Chain Finance Market Revenue (US$ Mn) and
Forecasts, By End-user
15.5.3.3.1. Foot
and Apparel
15.5.3.3.2. Food
and Beverages
15.5.3.3.3. Power
and Energy
15.5.3.3.4. Automobile
15.5.3.3.5. Chemical
and Materials
15.5.3.3.6. Manufacturing
15.5.3.3.7. Others
15.6. Key
Segment for Channeling Investments
15.6.1. By
Country
15.6.2. By Type
15.6.3. By
Organization Size
15.6.4. By
End-user
16. Competitive
Benchmarking
16.1. Market
Share Analysis, 2018
16.2. Global
Presence and Growth Strategies
16.2.1. Mergers
and Acquisitions
16.2.2. Product
Launches
16.2.3. Investments
Trends
16.2.4. R&D
Initiatives
17. Player
Profiles
17.1. BNP
Paribas CIB
17.1.1. Company
Details
17.1.2. Company
Overview
17.1.3. Product
Offerings
17.1.4. Key
Developments
17.1.5. Financial
Analysis
17.1.6. SWOT
Analysis
17.1.7. Business
Strategies
17.2. Citigroup,
Inc.
17.2.1. Company
Details
17.2.2. Company
Overview
17.2.3. Product
Offerings
17.2.4. Key
Developments
17.2.5. Financial
Analysis
17.2.6. SWOT
Analysis
17.2.7. Business
Strategies
17.3. DBS Bank
Ltd Co.
17.3.1. Company
Details
17.3.2. Company
Overview
17.3.3. Product
Offerings
17.3.4. Key
Developments
17.3.5. Financial
Analysis
17.3.6. SWOT
Analysis
17.3.7. Business
Strategies
17.4. First Abu
Dhabi Bank (FAB)
17.4.1. Company
Details
17.4.2. Company
Overview
17.4.3. Product
Offerings
17.4.4. Key
Developments
17.4.5. Financial
Analysis
17.4.6. SWOT
Analysis
17.4.7. Business
Strategies
17.5. FMO (the
Netherlands Development Finance Company)
17.5.1. Company
Details
17.5.2. Company
Overview
17.5.3. Product
Offerings
17.5.4. Key Developments
17.5.5. Financial
Analysis
17.5.6. SWOT
Analysis
17.5.7. Business
Strategies
17.6. HSBC
Group
17.6.1. Company
Details
17.6.2. Company
Overview
17.6.3. Product
Offerings
17.6.4. Key
Developments
17.6.5. Financial
Analysis
17.6.6. SWOT
Analysis
17.6.7. Business
Strategies
17.7. ING Bank N.V.
17.7.1. Company
Details
17.7.2. Company
Overview
17.7.3. Product
Offerings
17.7.4. Key
Developments
17.7.5. Financial
Analysis
17.7.6. SWOT
Analysis
17.7.7. Business
Strategies
17.8. Standard
Chartered PLC
17.8.1. Company
Details
17.8.2. Company
Overview
17.8.3. Product
Offerings
17.8.4. Key
Developments
17.8.5. Financial
Analysis
17.8.6. SWOT
Analysis
17.8.7. Business
Strategies
17.9. Other
Market Participants
18. Key Findings
Note: This ToC is tentative
and can be changed according to the research study conducted during the course
of report completion.
**Exclusive for Multi-User and
Enterprise User.
At Absolute Markets Insights, we are engaged in building both global as well as country specific reports. As a result, the approach taken for deriving the estimation and forecast for a specific country is a bit unique and different in comparison to the global research studies. In this case, we not only study the concerned market factors & trends prevailing in a particular country (from secondary research) but we also tend to calculate the actual market size & forecast from the revenue generated from the market participants involved in manufacturing or distributing the any concerned product. These companies can also be service providers. For analyzing any country specifically, we do consider the growth factors prevailing under the states/cities/county for the same. For instance, if we are analyzing an industry specific to United States, we primarily need to study about the states present under the same(where the product/service has the highest growth). Similar analysis will be followed by other countries. Our scope of the report changes with different markets.
Our research study is mainly implement through a mix of both secondary and primary research. Various sources such as industry magazines, trade journals, and government websites and trade associations are reviewed for gathering precise data. Primary interviews are conducted to validate the market size derived from secondary research. Industry experts, major manufacturers and distributors are contacted for further validation purpose on the current market penetration and growth trends.
Prominent participants in our primary research process include:
- Key Opinion Leaders namely the CEOs, CSOs, VPs, purchasing managers, amongst others
- Research and development participants, distributors/suppliers and subject matter experts
Secondary Research includes data extracted from paid data sources:
- Reuters
- Factiva
- Bloomberg
- One Source
- Hoovers
Research Methodology

Key Inclusions


