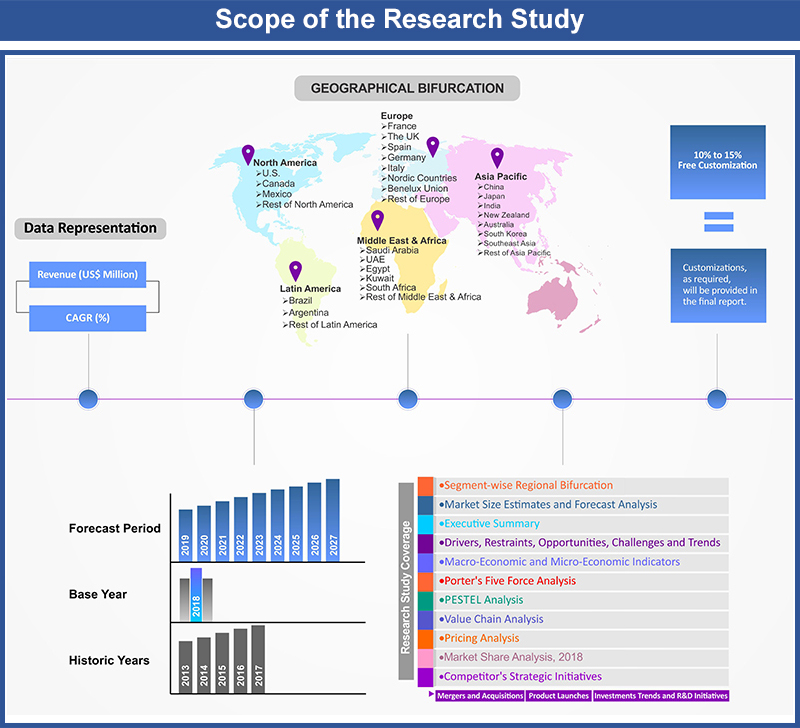
U.S. Home Infusion Therapy Market By Product (Infusion Pumps, Intravenous Sets, IV Cannulas, Needleless Connectors), By Application (Anti-infective, Hydration Therapy, Chemotherapy, Enteral Nutrition, Parenteral Nutrition, Specialty Pharmaceuticals, Others ), By Region (East North Central {Illinois, Indiana, Michigan, Ohio, Wisconsin}, West South Central {Arkansas, Louisiana, Oklahoma, Texas},South Atlantic {Delaware, Florida, Georgia, Maryland, North Carolina, South Carolina, Virginia, West Virginia, Washington, D.C}, North East {Connecticut, Maine, Massachusetts, New Hampshire, Rhode Island, Vermont, New Jersey, New York, Pennsylvania}, East South Central {Alabama, Kentucky, Mississippi, Tennessee}, West North Central {Iowa, Kansas, Minnesota, Missouri, Nebraska, North Dakota, South Dakota}, Pacific Central {Alaska, California, Hawaii, Oregon, Washington}, Mountain States {Arizona, Colorado, Utah, Nevada, New Mexico, Idaho, Montana, Wyoming}) – Global Insights, Growth, Size, Comparative Analysis, Trends and Forecast, 2019 – 2027
Industry Trends
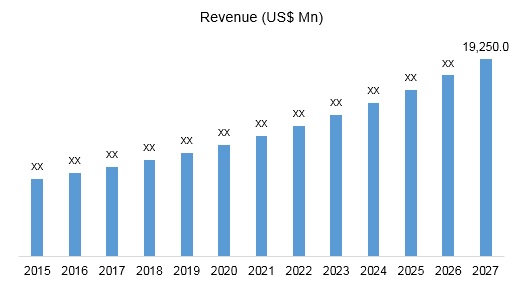
U.S. home infusion therapy market was valued at US$ 7,849.6 million in 2018 and is estimated to reach US$ 19,250.0 million by 2027, growing at a CAGR of 10.5% over the forecast period.
U.S. Home Infusion Therapy Market Revenue, 2019 - 2027
Increasing technological advancements with regards to automations in healthcare devices are fueling U.S. home infusion therapy market growth. Advancement such as modification of conventional insulin infusion pumps into smart ones with reduced dosage error and easy usage are prominent driving factors of market growth. Moreover, from the demand side, rapidly expanding geriatric patient pool happens to be the primary reason behind growing adoption of various home infusion therapy products across the U.S. Government funding in research and development to provide best possible solutions to the elderly is further promoting market expansion.
Rising incidences of chronic diseases such as diabetes, respiratory disorders, cancer, and so on, are augmenting demand for home infusion therapies. The need to provide continuous monitoring and therapy to patients with chronic diseases will spur demand for home care devices during the forecast timeframe.
High average household income and access to healthcare are other major market growth promoting factors in some of the regions across the U.S. Increasing affordability of various devices due to insurance provision will drive U.S. home infusion therapy market in certain regions.
However, reimbursement limitation proves to be a major hurdle in market expansion path. Lack of reimbursement and insurance on some of the devices hinder their adoption, and thus market growth. Furthermore, sporadic affordability across the nations restrains market expansion.
Infusion pumps, intravenous sets, IV cannulas and needleless connectors are some of the major products used in home therapy. Infusion pumps held the largest market share in 2018 and it is estimated to expand at a rapid rate over the projection period. Infusion pumps market growth is attributed to effectiveness and easy usage offered by modern pumps.
Anti-infective home infusion therapy accounted for the largest market share in 2018, owing to the high rate of hospital acquired infections. Over the forecast period, parenteral home infusion therapy will be largely responsible for driving market growth. Increasing incidences of gastro-intestinal tract disorders which require continuous parenteral infusion of food and medicine, will augment market expansion.
South Atlantic region home infusion therapy market, held largest market share and is estimated to hold its dominance in future years. High average household income and access to healthcare are the major reasons behind rising demand for home infusion products across the region.
Pacific central region home infusion market is anticipated to grow rapidly owing to increasing government efforts to offer affordable home care solutions to geriatric population across the region.
The report provides both, qualitative and quantitative research of U.S. home infusion therapy market, it also provides penetrative insights into the rational scenario and favored development methods adopted by key contenders. The report also offers extensive research on the key players in the market and detailed insights into the competitiveness of these players. Key business strategies such as mergers and acquisitions (M&A), affiliations, collaborations, and contracts adopted by major players are also recognized and analyzed in the report. For each company, the report recognizes its headquarter, competitors, product/service type, application and specification, pricing, and gross margin.
Competitive Landscape
Major industry participants in U.S. home infusion therapy market include Baxter International, Becton Dickinson, Fresenius Kabi, Smith Medical, B. Braun, Amsino International, Halyard Health and Terumo Corporation among others. New product launches, merger and acquisition, geographical expansion are some of the major strategies adopted by these players to gain a competitive edge.
U.S. Home Infusion Therapy Market :
- By Product
- Infusion pumps
- Intravenous sets
- IV cannulas
- Needleless connectors
- By Application
- Anti-infectives
- Hydration therapy
- Chemotherapy
- Enteral nutrition
- Parenteral nutrition
- Specialty pharmaceuticals
- Others
- By Geography
- East North Central
- Illinois
- Indiana
- Michigan
- Ohio
- Wisconsin
- West South Central
- Arkansas
- Louisiana
- Oklahoma
- Texas
- South Atlantic
- Delaware
- Georgia
- Maryland
- North Carolina
- South Carolina
- Virginia
- West Virginia
- Washington D.C.
- North East
- Connecticut
- Maine
- Massachusetts
- New Hampshire
- Rhode Islands
- Vermont
- New Jersey
- New York
- Pennsylvania
- East South Central
- Alabama
- Kentucky
- Mississippi
- Tennessee
- West North Central
- Iowa
- Kansas
- Minnesota
- Missouri
- Nebraska
- North Dakota
- South Dakota
- Pacific Central
- Alaska
- California
- Hawaii
- Oregon
- Washington
- Mountain States
- Arizona
- Colorado
- Utah
- Nevada
- New Mexico
- Idaho
- Montana
- Wyoming
- East North Central
1. Market Scope
1.1. Market
Segmentation
1.2. Years
Considered
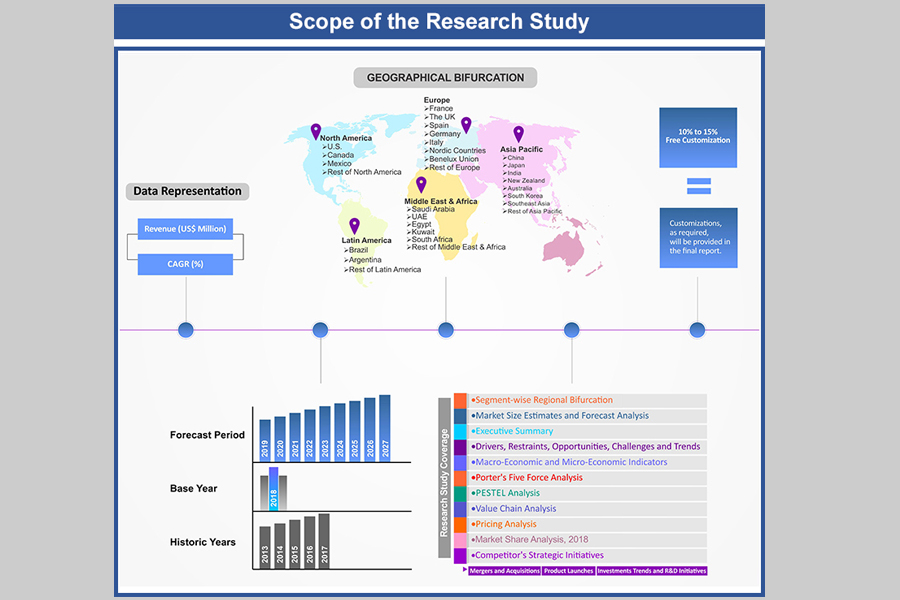
1.2.1. Historic Years: 2015 - 2017
1.2.2. Base
Year: 2018
1.2.3. Forecast
Years: 2019 – 2027
2. Key Target Audiences
3. Research Methodology
3.1. Primary
Research
3.1.1. Research
Questionnaire
3.1.2. U.S.
Percentage Breakdown
3.1.3. Primary
Interviews: Key Opinion Leaders (KOLs)
3.2. Secondary
Research
3.2.1. Paid
Databases
3.2.2. Secondary
Sources
3.3. Market
Size Estimates
3.3.1. Top-Down
Approach
3.3.2. Bottom-Up
Approach
3.4. Data
Triangulation Methodology
3.5. Research
Assumptions
4. Recommendations and Insights from AMI’s Perspective**
5. Holistic Overview of United States Home Infusion Therapy
Market
6. Market Synopsis: United
States Home Infusion Therapy Market
7. United States Home Infusion Therapy Market Analysis:
Qualitative Perspective
7.1. Introduction
7.1.1. Product
Definition
7.1.2. Industry
Development
7.2. Market
Dynamics
7.2.1. Drivers
7.2.2. Restraints
7.2.3. Opportunities
7.2.4. Challenges
7.3. Trends in
Home Infusion Therapy Market
7.4. Market
Determinants Radar Chart
7.5. Macro-Economic
and Micro-Economic Indicators: Home Infusion Therapy Market
7.6. Industry
Gross Margin Overview
7.7. Porter’s
Five Force Analysis
7.8. PESTEL
Analysis
8. U.S. Home Infusion Therapy Market Analysis and Forecasts,
2019 – 2027
8.1. Overview
8.1.1. U.S.
Home Infusion Therapy Market Revenue (US$ Mn)
8.2. U.S. Home
Infusion Therapy Market Revenue (US$ Mn) and
Forecasts, By Product
8.2.1. Infusion
pumps
8.2.1.1. Definition
8.2.1.2. Market
Penetration, 2018
8.2.1.3. Market
Estimation, 2015 – 2018
8.2.1.4. Market
Forecast, 2019 – 2027
8.2.1.5. Compound
Annual Growth Rate (CAGR)
8.2.1.6. Regional
Bifurcation
8.2.1.6.1. East North Central
8.2.1.6.1.1. Market
Estimation, 2015 – 2018
8.2.1.6.1.2. Market
Forecast, 2019 – 2027
8.2.1.6.2. West South Central
8.2.1.6.2.1. Market
Estimation, 2015 – 2018
8.2.1.6.2.2. Market
Forecast, 2019 – 2027
8.2.1.6.3. South Atlantic
8.2.1.6.3.1. Market
Estimation, 2015 – 2018
8.2.1.6.3.2. Market
Forecast, 2019 – 2027
8.2.1.6.4. North East
8.2.1.6.4.1. Market
Estimation, 2015 – 2018
8.2.1.6.4.2. Market
Forecast, 2019 – 2027
8.2.1.6.5. East South Central
8.2.1.6.5.1. Market
Estimation, 2015 – 2018
8.2.1.6.5.2. Market
Forecast, 2019 – 2027
8.2.1.6.6. West North Central
8.2.1.6.6.1. Market
Estimation, 2015 – 2018
8.2.1.6.6.2. Market
Forecast, 2019 – 2027
8.2.1.6.7. Pacific Central
8.2.1.6.7.1. Market
Estimation, 2015 – 2018
8.2.1.6.7.2. Market
Forecast, 2019 – 2027
8.2.1.6.8. Mountain States
8.2.1.6.8.1. Market
Estimation, 2015 – 2018
8.2.1.6.8.2. Market
Forecast, 2019 – 2027
8.2.2. Intravenous
sets
8.2.2.1. Definition
8.2.2.2. Market
Penetration, 2018
8.2.2.3. Market
Estimation, 2015 – 2018
8.2.2.4. Market
Forecast, 2019 – 2027
8.2.2.5. Compound
Annual Growth Rate (CAGR)
8.2.2.6. Regional
Bifurcation
8.2.2.6.1. East North Central
8.2.2.6.1.1. Market
Estimation, 2015 – 2018
8.2.2.6.1.2. Market
Forecast, 2019 – 2027
8.2.2.6.2. West South Central
8.2.2.6.2.1. Market
Estimation, 2015 – 2018
8.2.2.6.2.2. Market
Forecast, 2019 – 2027
8.2.2.6.3. South Atlantic
8.2.2.6.3.1. Market
Estimation, 2015 – 2018
8.2.2.6.3.2. Market
Forecast, 2019 – 2027
8.2.2.6.4. North East
8.2.2.6.4.1. Market
Estimation, 2015 – 2018
8.2.2.6.4.2. Market
Forecast, 2019 – 2027
8.2.2.6.5. East South Central
8.2.2.6.5.1. Market
Estimation, 2015 – 2018
8.2.2.6.5.2. Market
Forecast, 2019 – 2027
8.2.2.6.6. West North Central
8.2.2.6.6.1. Market
Estimation, 2015 – 2018
8.2.2.6.6.2. Market
Forecast, 2019 – 2027
8.2.2.6.7. Pacific Central
8.2.2.6.7.1. Market
Estimation, 2015 – 2018
8.2.2.6.7.2. Market
Forecast, 2019 – 2027
8.2.2.6.8. Mountain States
8.2.2.6.8.1. Market
Estimation, 2015 – 2018
8.2.2.6.8.2. Market
Forecast, 2019 – 2027
8.2.3. IV
cannulas
8.2.3.1. Definition
8.2.3.2. Market
Penetration, 2018
8.2.3.3. Market
Estimation, 2015 – 2018
8.2.3.4. Market
Forecast, 2019 – 2027
8.2.3.5. Compound
Annual Growth Rate (CAGR)
8.2.3.6. Regional
Bifurcation
8.2.3.6.1. East North Central
8.2.3.6.1.1. Market
Estimation, 2015 – 2018
8.2.3.6.1.2. Market
Forecast, 2019 – 2027
8.2.3.6.2. West South Central
8.2.3.6.2.1. Market
Estimation, 2015 – 2018
8.2.3.6.2.2. Market
Forecast, 2019 – 2027
8.2.3.6.3. South Atlantic
8.2.3.6.3.1. Market
Estimation, 2015 – 2018
8.2.3.6.3.2. Market
Forecast, 2019 – 2027
8.2.3.6.4. North East
8.2.3.6.4.1. Market
Estimation, 2015 – 2018
8.2.3.6.4.2. Market
Forecast, 2019 – 2027
8.2.3.6.5. East South Central
8.2.3.6.5.1. Market
Estimation, 2015 – 2018
8.2.3.6.5.2. Market
Forecast, 2019 – 2027
8.2.3.6.6. West North Central
8.2.3.6.6.1. Market
Estimation, 2015 – 2018
8.2.3.6.6.2. Market
Forecast, 2019 – 2027
8.2.3.6.7. Pacific Central
8.2.3.6.7.1. Market
Estimation, 2015 – 2018
8.2.3.6.7.2. Market
Forecast, 2019 – 2027
8.2.3.6.8. Mountain States
8.2.3.6.8.1. Market
Estimation, 2015 – 2018
8.2.3.6.8.2. Market
Forecast, 2019 – 2027
8.2.4. Needleless
connectors
8.2.4.1. Definition
8.2.4.2. Market
Penetration, 2018
8.2.4.3. Market
Estimation, 2015 – 2018
8.2.4.4. Market
Forecast, 2019 – 2027
8.2.4.5. Compound
Annual Growth Rate (CAGR)
8.2.4.6. Regional
Bifurcation
8.2.4.6.1. East North Central
8.2.4.6.1.1. Market
Estimation, 2015 – 2018
8.2.4.6.1.2. Market
Forecast, 2019 – 2027
8.2.4.6.2. West South Central
8.2.4.6.2.1. Market
Estimation, 2015 – 2018
8.2.4.6.2.2. Market
Forecast, 2019 – 2027
8.2.4.6.3. South Atlantic
8.2.4.6.3.1. Market
Estimation, 2015 – 2018
8.2.4.6.3.2. Market
Forecast, 2019 – 2027
8.2.4.6.4. North East
8.2.4.6.4.1. Market
Estimation, 2015 – 2018
8.2.4.6.4.2. Market
Forecast, 2019 – 2027
8.2.4.6.5. East South Central
8.2.4.6.5.1. Market
Estimation, 2015 – 2018
8.2.4.6.5.2. Market
Forecast, 2019 – 2027
8.2.4.6.6. West North Central
8.2.4.6.6.1. Market
Estimation, 2015 – 2018
8.2.4.6.6.2. Market
Forecast, 2019 – 2027
8.2.4.6.7. Pacific Central
8.2.4.6.7.1. Market
Estimation, 2015 – 2018
8.2.4.6.7.2. Market
Forecast, 2019 – 2027
8.2.4.6.8. Mountain States
8.2.4.6.8.1. Market
Estimation, 2015 – 2018
8.2.4.6.8.2. Market
Forecast, 2019 – 2027
8.2.5. Others
8.2.5.1. Definition
8.2.5.2. Market
Penetration, 2018
8.2.5.3. Market
Estimation, 2015 – 2018
8.2.5.4. Market
Forecast, 2019 – 2027
8.2.5.5. Compound
Annual Growth Rate (CAGR)
8.2.5.6. Regional
Bifurcation
8.2.5.6.1. East North Central
8.2.5.6.1.1. Market
Estimation, 2015 – 2018
8.2.5.6.1.2. Market
Forecast, 2019 – 2027
8.2.5.6.2. West South Central
8.2.5.6.2.1. Market
Estimation, 2015 – 2018
8.2.5.6.2.2. Market
Forecast, 2019 – 2027
8.2.5.6.3. South Atlantic
8.2.5.6.3.1. Market
Estimation, 2015 – 2018
8.2.5.6.3.2. Market
Forecast, 2019 – 2027
8.2.5.6.4. North East
8.2.5.6.4.1. Market
Estimation, 2015 – 2018
8.2.5.6.4.2. Market
Forecast, 2019 – 2027
8.2.5.6.5. East South Central
8.2.5.6.5.1. Market
Estimation, 2015 – 2018
8.2.5.6.5.2. Market
Forecast, 2019 – 2027
8.2.5.6.6. West North Central
8.2.5.6.6.1. Market
Estimation, 2015 – 2018
8.2.5.6.6.2. Market
Forecast, 2019 – 2027
8.2.5.6.7. Pacific Central
8.2.5.6.7.1. Market
Estimation, 2015 – 2018
8.2.5.6.7.2. Market
Forecast, 2019 – 2027
8.2.5.6.8. Mountain States
8.2.5.6.8.1. Market
Estimation, 2015 – 2018
8.2.5.6.8.2. Market
Forecast, 2019 – 2027
8.3. Key
Segment for Channeling Investments
8.3.1. By
Product
9. U.S. Home Infusion Therapy Market Analysis and Forecasts,
2019 – 2027
9.1. Overview
9.2. U.S. Home
Infusion Therapy Market Revenue (US$ Mn) and
Forecasts, By Application
9.2.1. Anti-infectives
9.2.1.1. Definition
9.2.1.2. Market
Penetration, 2018
9.2.1.3. Market
Estimation, 2015 – 2018
9.2.1.4. Market
Forecast, 2019 – 2027
9.2.1.5. Compound
Annual Growth Rate (CAGR)
9.2.1.6. Regional
Bifurcation
9.2.1.6.1. East North Central
9.2.1.6.1.1. Market
Estimation, 2015 – 2018
9.2.1.6.1.2. Market
Forecast, 2019 – 2027
9.2.1.6.2. West South Central
9.2.1.6.2.1. Market
Estimation, 2015 – 2018
9.2.1.6.2.2. Market
Forecast, 2019 – 2027
9.2.1.6.3. South Atlantic
9.2.1.6.3.1. Market
Estimation, 2015 – 2018
9.2.1.6.3.2. Market
Forecast, 2019 – 2027
9.2.1.6.4. North East
9.2.1.6.4.1. Market
Estimation, 2015 – 2018
9.2.1.6.4.2. Market
Forecast, 2019 – 2027
9.2.1.6.5. East South Central
9.2.1.6.5.1. Market
Estimation, 2015 – 2018
9.2.1.6.5.2. Market
Forecast, 2019 – 2027
9.2.1.6.6. West North Central
9.2.1.6.6.1. Market
Estimation, 2015 – 2018
9.2.1.6.6.2. Market
Forecast, 2019 – 2027
9.2.1.6.7. Pacific Central
9.2.1.6.7.1. Market
Estimation, 2015 – 2018
9.2.1.6.7.2. Market
Forecast, 2019 – 2027
9.2.1.6.8. Mountain States
9.2.1.6.8.1. Market
Estimation, 2015 – 2018
9.2.1.6.8.2. Market
Forecast, 2019 – 2027
9.2.2. Hydration
therapy
9.2.2.1. Definition
9.2.2.2. Market
Penetration, 2018
9.2.2.3. Market
Estimation, 2015 – 2018
9.2.2.4. Market
Forecast, 2019 – 2027
9.2.2.5. Compound
Annual Growth Rate (CAGR)
9.2.2.6. Regional
Bifurcation
9.2.2.6.1. East North Central
9.2.2.6.1.1. Market
Estimation, 2015 – 2018
9.2.2.6.1.2. Market
Forecast, 2019 – 2027
9.2.2.6.2. West South Central
9.2.2.6.2.1. Market
Estimation, 2015 – 2018
9.2.2.6.2.2. Market
Forecast, 2019 – 2027
9.2.2.6.3. South Atlantic
9.2.2.6.3.1. Market
Estimation, 2015 – 2018
9.2.2.6.3.2. Market
Forecast, 2019 – 2027
9.2.2.6.4. North East
9.2.2.6.4.1. Market
Estimation, 2015 – 2018
9.2.2.6.4.2. Market
Forecast, 2019 – 2027
9.2.2.6.5. East South Central
9.2.2.6.5.1. Market
Estimation, 2015 – 2018
9.2.2.6.5.2. Market
Forecast, 2019 – 2027
9.2.2.6.6. West North Central
9.2.2.6.6.1. Market
Estimation, 2015 – 2018
9.2.2.6.6.2. Market
Forecast, 2019 – 2027
9.2.2.6.7. Pacific Central
9.2.2.6.7.1. Market
Estimation, 2015 – 2018
9.2.2.6.7.2. Market
Forecast, 2019 – 2027
9.2.2.6.8. Mountain States
9.2.2.6.8.1. Market
Estimation, 2015 – 2018
9.2.2.6.8.2. Market
Forecast, 2019 – 2027
9.2.3. Chemotherapy
9.2.3.1. Definition
9.2.3.2. Market
Penetration, 2018
9.2.3.3. Market
Estimation, 2015 – 2018
9.2.3.4. Market
Forecast, 2019 – 2027
9.2.3.5. Compound
Annual Growth Rate (CAGR)
9.2.3.6. Regional
Bifurcation
9.2.3.6.1. East North Central
9.2.3.6.1.1. Market
Estimation, 2015 – 2018
9.2.3.6.1.2. Market
Forecast, 2019 – 2027
9.2.3.6.2. West South Central
9.2.3.6.2.1. Market
Estimation, 2015 – 2018
9.2.3.6.2.2. Market
Forecast, 2019 – 2027
9.2.3.6.3. South Atlantic
9.2.3.6.3.1. Market
Estimation, 2015 – 2018
9.2.3.6.3.2. Market
Forecast, 2019 – 2027
9.2.3.6.4. North East
9.2.3.6.4.1. Market
Estimation, 2015 – 2018
9.2.3.6.4.2. Market
Forecast, 2019 – 2027
9.2.3.6.5. East South Central
9.2.3.6.5.1. Market
Estimation, 2015 – 2018
9.2.3.6.5.2. Market
Forecast, 2019 – 2027
9.2.3.6.6. West North Central
9.2.3.6.6.1. Market
Estimation, 2015 – 2018
9.2.3.6.6.2. Market
Forecast, 2019 – 2027
9.2.3.6.7. Pacific Central
9.2.3.6.7.1. Market
Estimation, 2015 – 2018
9.2.3.6.7.2. Market
Forecast, 2019 – 2027
9.2.3.6.8. Mountain States
9.2.3.6.8.1. Market
Estimation, 2015 – 2018
9.2.3.6.8.2. Market
Forecast, 2019 – 2027
9.2.4. Enteral
nutrition
9.2.4.1. Definition
9.2.4.2. Market
Penetration, 2018
9.2.4.3. Market
Estimation, 2015 – 2018
9.2.4.4. Market
Forecast, 2019 – 2027
9.2.4.5. Compound
Annual Growth Rate (CAGR)
9.2.4.6. Regional
Bifurcation
9.2.4.6.1. East North Central
9.2.4.6.1.1. Market
Estimation, 2015 – 2018
9.2.4.6.1.2. Market
Forecast, 2019 – 2027
9.2.4.6.2. West South Central
9.2.4.6.2.1. Market
Estimation, 2015 – 2018
9.2.4.6.2.2. Market
Forecast, 2019 – 2027
9.2.4.6.3. South Atlantic
9.2.4.6.3.1. Market
Estimation, 2015 – 2018
9.2.4.6.3.2. Market
Forecast, 2019 – 2027
9.2.4.6.4. North East
9.2.4.6.4.1. Market
Estimation, 2015 – 2018
9.2.4.6.4.2. Market
Forecast, 2019 – 2027
9.2.4.6.5. East South Central
9.2.4.6.5.1. Market
Estimation, 2015 – 2018
9.2.4.6.5.2. Market
Forecast, 2019 – 2027
9.2.4.6.6. West North Central
9.2.4.6.6.1. Market
Estimation, 2015 – 2018
9.2.4.6.6.2. Market
Forecast, 2019 – 2027
9.2.4.6.7. Pacific Central
9.2.4.6.7.1. Market
Estimation, 2015 – 2018
9.2.4.6.7.2. Market
Forecast, 2019 – 2027
9.2.4.6.8. Mountain States
9.2.4.6.8.1. Market
Estimation, 2015 – 2018
9.2.4.6.8.2. Market
Forecast, 2019 – 2027
9.2.5. Parenteral
nutrition
9.2.5.1. Definition
9.2.5.2. Market
Penetration, 2018
9.2.5.3. Market
Estimation, 2015 – 2018
9.2.5.4. Market
Forecast, 2019 – 2027
9.2.5.5. Compound
Annual Growth Rate (CAGR)
9.2.5.6. Regional
Bifurcation
9.2.5.6.1. East North Central
9.2.5.6.1.1. Market
Estimation, 2015 – 2018
9.2.5.6.1.2. Market
Forecast, 2019 – 2027
9.2.5.6.2. West South Central
9.2.5.6.2.1. Market
Estimation, 2015 – 2018
9.2.5.6.2.2. Market
Forecast, 2019 – 2027
9.2.5.6.3. South Atlantic
9.2.5.6.3.1. Market
Estimation, 2015 – 2018
9.2.5.6.3.2. Market
Forecast, 2019 – 2027
9.2.5.6.4. North East
9.2.5.6.4.1. Market
Estimation, 2015 – 2018
9.2.5.6.4.2. Market
Forecast, 2019 – 2027
9.2.5.6.5. East South Central
9.2.5.6.5.1. Market
Estimation, 2015 – 2018
9.2.5.6.5.2. Market
Forecast, 2019 – 2027
9.2.5.6.6. West North Central
9.2.5.6.6.1. Market
Estimation, 2015 – 2018
9.2.5.6.6.2. Market
Forecast, 2019 – 2027
9.2.5.6.7. Pacific Central
9.2.5.6.7.1. Market
Estimation, 2015 – 2018
9.2.5.6.7.2. Market
Forecast, 2019 – 2027
9.2.5.6.8. Mountain States
9.2.5.6.8.1. Market
Estimation, 2015 – 2018
9.2.5.6.8.2. Market
Forecast, 2019 – 2027
9.2.6. Specialty
pharmaceuticals
9.2.6.1. Definition
9.2.6.2. Market
Penetration, 2018
9.2.6.3. Market
Estimation, 2015 – 2018
9.2.6.4. Market
Forecast, 2019 – 2027
9.2.6.5. Compound
Annual Growth Rate (CAGR)
9.2.6.6. Regional
Bifurcation
9.2.6.6.1. East North Central
9.2.6.6.1.1. Market
Estimation, 2015 – 2018
9.2.6.6.1.2. Market
Forecast, 2019 – 2027
9.2.6.6.2. West South Central
9.2.6.6.2.1. Market
Estimation, 2015 – 2018
9.2.6.6.2.2. Market
Forecast, 2019 – 2027
9.2.6.6.3. South Atlantic
9.2.6.6.3.1. Market
Estimation, 2015 – 2018
9.2.6.6.3.2. Market
Forecast, 2019 – 2027
9.2.6.6.4. North East
9.2.6.6.4.1. Market
Estimation, 2015 – 2018
9.2.6.6.4.2. Market
Forecast, 2019 – 2027
9.2.6.6.5. East South Central
9.2.6.6.5.1. Market
Estimation, 2015 – 2018
9.2.6.6.5.2. Market
Forecast, 2019 – 2027
9.2.6.6.6. West North Central
9.2.6.6.6.1. Market
Estimation, 2015 – 2018
9.2.6.6.6.2. Market
Forecast, 2019 – 2027
9.2.6.6.7. Pacific Central
9.2.6.6.7.1. Market
Estimation, 2015 – 2018
9.2.6.6.7.2. Market
Forecast, 2019 – 2027
9.2.6.6.8. Mountain States
9.2.6.6.8.1. Market
Estimation, 2015 – 2018
9.2.6.6.8.2. Market
Forecast, 2019 – 2027
9.2.7. Other
application
9.2.7.1. Definition
9.2.7.2. Market
Penetration, 2018
9.2.7.3. Market
Estimation, 2015 – 2018
9.2.7.4. Market
Forecast, 2019 – 2027
9.2.7.5. Compound
Annual Growth Rate (CAGR)
9.2.7.6. Regional
Bifurcation
9.2.7.6.1. East North Central
9.2.7.6.1.1. Market
Estimation, 2015 – 2018
9.2.7.6.1.2. Market
Forecast, 2019 – 2027
9.2.7.6.2. West South Central
9.2.7.6.2.1. Market
Estimation, 2015 – 2018
9.2.7.6.2.2. Market
Forecast, 2019 – 2027
9.2.7.6.3. South Atlantic
9.2.7.6.3.1. Market
Estimation, 2015 – 2018
9.2.7.6.3.2. Market
Forecast, 2019 – 2027
9.2.7.6.4. North East
9.2.7.6.4.1. Market
Estimation, 2015 – 2018
9.2.7.6.4.2. Market
Forecast, 2019 – 2027
9.2.7.6.5. East South Central
9.2.7.6.5.1. Market
Estimation, 2015 – 2018
9.2.7.6.5.2. Market
Forecast, 2019 – 2027
9.2.7.6.6. West North Central
9.2.7.6.6.1. Market
Estimation, 2015 – 2018
9.2.7.6.6.2. Market
Forecast, 2019 – 2027
9.2.7.6.7. Pacific Central
9.2.7.6.7.1. Market
Estimation, 2015 – 2018
9.2.7.6.7.2. Market
Forecast, 2019 – 2027
9.2.7.6.8. Mountain States
9.2.7.6.8.1. Market
Estimation, 2015 – 2018
9.2.7.6.8.2. Market
Forecast, 2019 – 2027
9.3. Key
Segment for Channeling Investments
9.3.1. By
Application
10. U.S. Home Infusion Therapy Market Analysis and Forecasts,
2019 – 2027
10.1. Overview
10.2. U.S. Home
Infusion Therapy Market Revenue (US$ Mn) and Forecasts By Zones
10.2.1. East
North Central
10.2.1.1. East
North Central Home Infusion Therapy Market Revenue (US$ Mn) and Forecasts, By
Product
10.2.1.1.1. Infusion pumps
10.2.1.1.2. Intravenous sets
10.2.1.1.3. IV cannulas
10.2.1.1.4. Needleless connectors
10.2.1.1.5. Others
10.2.1.2. East
North Central Home Infusion Therapy Market Revenue (US$ Mn) and Forecasts, By
Application
10.2.1.2.1. Anti-infectives
10.2.1.2.2. Hydration therapy
10.2.1.2.3. Chemotherapy
10.2.1.2.4. Enteral nutrition
10.2.1.2.5. Parenteral nutrition
10.2.1.2.6. Specialty pharmaceuticals
10.2.1.2.7.
Other application
10.2.1.3. East
North Central Home Infusion Therapy Market Revenue (US$ Mn) and Forecasts, By
State
10.2.1.3.1. Illinois
10.2.1.3.2. Indiana
10.2.1.3.3. Michigan
10.2.1.3.4. Ohio
10.2.1.3.5. Wisconsin
10.2.2. West
South Central
10.2.2.1. West
South Central Home Infusion Therapy Market Revenue (US$ Mn) and Forecasts, By
Product
10.2.2.1.1. Infusion pumps
10.2.2.1.2. Intravenous sets
10.2.2.1.3. IV cannulas
10.2.2.1.4. Needleless connectors
10.2.2.1.5. Others
10.2.2.2. West
South Central Home Infusion Therapy Market Revenue (US$ Mn) and Forecasts, By
Application
10.2.2.2.1. Anti-infectives
10.2.2.2.2. Hydration therapy
10.2.2.2.3. Chemotherapy
10.2.2.2.4. Enteral nutrition
10.2.2.2.5. Parenteral nutrition
10.2.2.2.6. Specialty pharmaceuticals
10.2.2.2.7.
Other application
10.2.2.3. West
South Central Home Infusion Therapy Market Revenue (US$ Mn) and Forecasts, By
State
10.2.2.3.1.
Arkansas
10.2.2.3.2.
Louisiana
10.2.2.3.3.
Oklahoma
10.2.2.3.4.
Texas
10.2.3. South
Atlantic
10.2.3.1. South
Atlantic Home Infusion Therapy Market Revenue (US$ Mn) and Forecasts, By
Product
10.2.3.1.1. Infusion pumps
10.2.3.1.2. Intravenous sets
10.2.3.1.3. IV cannulas
10.2.3.1.4. Needleless connectors
10.2.3.1.5. Others
10.2.3.2. South
Atlantic Home Infusion Therapy Market Revenue (US$ Mn) and Forecasts, By
Application
10.2.3.2.1. Anti-infectives
10.2.3.2.2. Hydration therapy
10.2.3.2.3. Chemotherapy
10.2.3.2.4. Enteral nutrition
10.2.3.2.5. Parenteral nutrition
10.2.3.2.6. Specialty pharmaceuticals
10.2.3.2.7.
Other application
10.2.3.3. South
Atlantic Home Infusion Therapy Market Revenue (US$ Mn) and Forecasts, By States
10.2.3.3.1.
Delaware
10.2.3.3.2. Georgia
10.2.3.3.3. Maryland
10.2.3.3.4. North
Carolina
10.2.3.3.5. South
Carolina
10.2.3.3.6. Virginia
10.2.3.3.7. West
Virginia
10.2.3.3.8. Washington
D.C.
10.2.4. North
East
10.2.4.1. North
East Home Infusion Therapy Market Revenue (US$ Mn) and Forecasts, By Product
10.2.4.1.1. Infusion pumps
10.2.4.1.2. Intravenous sets
10.2.4.1.3. IV cannulas
10.2.4.1.4. Needleless connectors
10.2.4.1.5. Others
10.2.4.2. North
East Home Infusion Therapy Market Revenue (US$ Mn) and Forecasts, By
Application
10.2.4.2.1. Anti-infectives
10.2.4.2.2. Hydration therapy
10.2.4.2.3. Chemotherapy
10.2.4.2.4. Enteral nutrition
10.2.4.2.5. Parenteral nutrition
10.2.4.2.6. Specialty pharmaceuticals
10.2.4.2.7.
Other application
10.2.4.3. North
East Home Infusion Therapy Market Revenue (US$ Mn) and Forecasts, By States
10.2.4.3.1.
Connecticut
10.2.4.3.2.
Maine
10.2.4.3.3.
Massachusetts
10.2.4.3.4.
New Hampshire
10.2.4.3.5.
Rhode Islands
10.2.4.3.6.
Vermont
10.2.4.3.7.
New Jersey
10.2.4.3.8.
New York
10.2.4.3.9.
Pennsylvania
10.2.5. East
South Central
10.2.5.1. East
South-Central Home Infusion Therapy Market Revenue (US$ Mn) and Forecasts, By
Product
10.2.5.1.1. Infusion pumps
10.2.5.1.2. Intravenous sets
10.2.5.1.3. IV cannulas
10.2.5.1.4. Needleless connectors
10.2.5.1.5. Others
10.2.5.2. East
South Central Home Infusion Therapy Market Revenue (US$ Mn) and Forecasts, By
Application
10.2.5.2.1. Anti-infectives
10.2.5.2.2. Hydration therapy
10.2.5.2.3. Chemotherapy
10.2.5.2.4. Enteral nutrition
10.2.5.2.5. Parenteral nutrition
10.2.5.2.6. Specialty pharmaceuticals
10.2.5.2.7.
Other application
10.2.5.3. East
South Central Home Infusion Therapy Market Revenue (US$ Mn) and Forecasts, By
States
10.2.5.3.1.
Alabama
10.2.5.3.2.
Kentucky
10.2.5.3.3.
Mississippi
10.2.5.3.4.
Tennessee
10.2.6. West
North Central
10.2.6.1. West
North Central Home Infusion Therapy Market Revenue (US$ Mn) and Forecasts, By
Product
10.2.6.1.1. Infusion pumps
10.2.6.1.2. Intravenous sets
10.2.6.1.3. IV cannulas
10.2.6.1.4. Needleless connectors
10.2.6.1.5. Others
10.2.6.2. West
North Central Home Infusion Therapy Market Revenue (US$ Mn) and Forecasts, By
Application
10.2.6.2.1. Anti-infectives
10.2.6.2.2. Hydration therapy
10.2.6.2.3. Chemotherapy
10.2.6.2.4. Enteral nutrition
10.2.6.2.5. Parenteral nutrition
10.2.6.2.6. Specialty pharmaceuticals
10.2.6.2.7.
Other application
10.2.6.3. West
North Central Home Infusion Therapy Market Revenue (US$ Mn) and Forecasts, By
Application
10.2.6.3.1.
Iowa
10.2.6.3.2.
Kansas
10.2.6.3.3.
Minnesota
10.2.6.3.4.
Missouri
10.2.6.3.5.
Nebraska
10.2.6.3.6.
North Dakota
10.2.6.3.7.
South Dakota
10.2.7. Pacific
Central
10.2.7.1. Pacific
Central Home Infusion Therapy Market Revenue (US$ Mn) and Forecasts, By Product
10.2.7.1.1. Infusion pumps
10.2.7.1.2. Intravenous sets
10.2.7.1.3. IV cannulas
10.2.7.1.4. Needleless connectors
10.2.7.1.5. Others
10.2.7.2. Pacific
Central Home Infusion Therapy Market Revenue (US$ Mn) and Forecasts, By
Application
10.2.7.2.1. Anti-infectives
10.2.7.2.2. Hydration therapy
10.2.7.2.3. Chemotherapy
10.2.7.2.4. Enteral nutrition
10.2.7.2.5. Parenteral nutrition
10.2.7.2.6. Specialty pharmaceuticals
10.2.7.2.7.
Other application
10.2.7.3. Pacific
Central Home Infusion Therapy Market Revenue (US$ Mn) and Forecasts, By States
10.2.7.3.1.
Alaska
10.2.7.3.2.
California
10.2.7.3.3.
Hawaii
10.2.7.3.4.
Oregon
10.2.7.3.5.
Washington
10.2.8. Mountain
States
10.2.8.1. Mountain
States Home Infusion Therapy Market Revenue (US$ Mn) and Forecasts, By Product
10.2.8.1.1. Infusion pumps
10.2.8.1.2. Intravenous sets
10.2.8.1.3. IV cannulas
10.2.8.1.4. Needleless connectors
10.2.8.1.5. Others
10.2.8.2. Mountain
States Home Infusion Therapy Market Revenue (US$ Mn) and Forecasts, By
Application
10.2.8.2.1. Anti-infectives
10.2.8.2.2. Hydration therapy
10.2.8.2.3. Chemotherapy
10.2.8.2.4. Enteral nutrition
10.2.8.2.5. Parenteral nutrition
10.2.8.2.6. Specialty pharmaceuticals
10.2.8.2.7.
Other application
10.2.8.3. Mountain
States Home Infusion Therapy Market Revenue (US$ Mn) and Forecasts, By States
10.2.8.3.1.
Arizona
10.2.8.3.2.
Colorado
10.2.8.3.3.
Utah
10.2.8.3.4.
Nevada
10.2.8.3.5.
New Mexico
10.2.8.3.6.
Idaho
10.2.8.3.7.
Montana
10.2.8.3.8.
Wyoming
11. Competitive Benchmarking
11.1. Brand
Benchmarking
11.2. Market Share
Analysis, 2018
11.3. U.S.
Presence and Growth Strategies
11.3.1. Mergers
and Acquisitions
11.3.2. Product
Launches
11.3.3. Investments
Trends
11.3.4. R&D
Initiatives
12. Player Profiles
12.1. Baxter
International
12.1.1. Company
Details
12.1.2. Company
Overview
12.1.3. Product
Offerings
12.1.4. Key
Developments
12.1.5. Financial
Analysis
12.1.6. SWOT
Analysis
12.1.7. Business
Strategies
12.2. Becton
Dickinson
12.2.1. Company
Details
12.2.2. Company
Overview
12.2.3. Product
Offerings
12.2.4. Key
Developments
12.2.5. Financial
Analysis
12.2.6. SWOT
Analysis
12.2.7. Business
Strategies
12.3. Fresenius
Kabi
12.3.1. Company
Details
12.3.2. Company
Overview
12.3.3. Product
Offerings
12.3.4. Key
Developments
12.3.5. Financial
Analysis
12.3.6. SWOT
Analysis
12.3.7. Business
Strategies
12.4. Smith
Medical
12.4.1. Company
Details
12.4.2. Company
Overview
12.4.3. Product
Offerings
12.4.4. Key
Developments
12.4.5. Financial
Analysis
12.4.6. SWOT
Analysis
12.4.7. Business
Strategies
12.5. B. Braun
12.5.1. Company
Details
12.5.2. Company
Overview
12.5.3. Product
Offerings
12.5.4. Key Developments
12.5.5. Financial
Analysis
12.5.6. SWOT
Analysis
12.5.7. Business
Strategies
12.6. Amsino
International
12.6.1. Company
Details
12.6.2. Company
Overview
12.6.3. Product
Offerings
12.6.4. Key
Developments
12.6.5. Financial
Analysis
12.6.6. SWOT
Analysis
12.6.7. Business
Strategies
12.7. Halyard
Health
12.7.1. Company
Details
12.7.2. Company
Overview
12.7.3. Product
Offerings
12.7.4. Key
Developments
12.7.5. Financial
Analysis
12.7.6. SWOT
Analysis
12.7.7. Business
Strategies
12.8. Terumo
Corporation
12.8.1. Company
Details
12.8.2. Company
Overview
12.8.3. Product
Offerings
12.8.4. Key
Developments
12.8.5. Financial
Analysis
12.8.6. SWOT
Analysis
12.8.7. Business
Strategies
12.9. Other
industry participants
12.9.1. Company
Details
12.9.2. Company
Overview
12.9.3. Product
Offerings
12.9.4. Key
Developments
12.9.5. Financial
Analysis
12.9.6. SWOT
Analysis
12.9.7. Business
Strategies
13. Key Findings: Home Infusion Therapy Market
Note: This ToC is tentative and can
be changed according to the research study conducted during the course of
report completion.
**Exclusive for Multi-User and
Enterprise User.
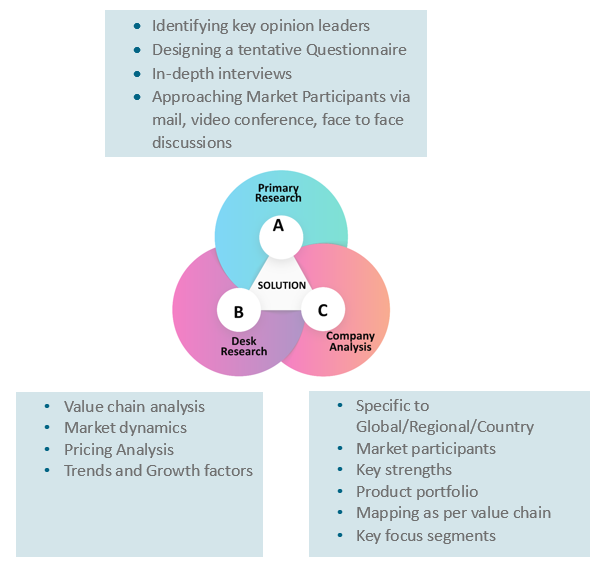
At Absolute Markets Insights, we are engaged in building both global as well as country specific reports. As a result, the approach taken for deriving the estimation and forecast for a specific country is a bit unique and different in comparison to the global research studies. In this case, we not only study the concerned market factors & trends prevailing in a particular country (from secondary research) but we also tend to calculate the actual market size & forecast from the revenue generated from the market participants involved in manufacturing or distributing the any concerned product. These companies can also be service providers. For analyzing any country specifically, we do consider the growth factors prevailing under the states/cities/county for the same. For instance, if we are analyzing an industry specific to United States, we primarily need to study about the states present under the same(where the product/service has the highest growth). Similar analysis will be followed by other countries. Our scope of the report changes with different markets.
Our research study is mainly implement through a mix of both secondary and primary research. Various sources such as industry magazines, trade journals, and government websites and trade associations are reviewed for gathering precise data. Primary interviews are conducted to validate the market size derived from secondary research. Industry experts, major manufacturers and distributors are contacted for further validation purpose on the current market penetration and growth trends.
Prominent participants in our primary research process include:
- Key Opinion Leaders namely the CEOs, CSOs, VPs, purchasing managers, amongst others
- Research and development participants, distributors/suppliers and subject matter experts
Secondary Research includes data extracted from paid data sources:
- Reuters
- Factiva
- Bloomberg
- One Source
- Hoovers
Research Methodology
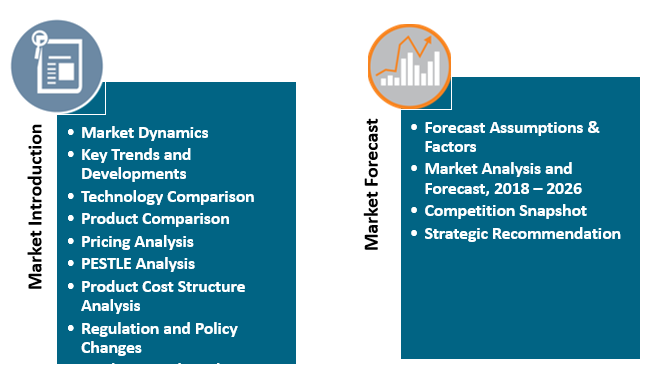
Key Inclusions
Why Absolute Markets Insights?
An effective strategy is the entity that influences a business to stand out of the crowd. An organization with a phenomenal strategy for success dependably has the edge over the rivals in the market. It offers the organizations a head start in planning their strategy. Absolute Market Insights is the new initiation in the industry that will furnish you with the lead your business needs. Absolute Market Insights is the best destination for your business intelligence and analytical solutions; essentially because our qualitative and quantitative sources of information are competent to give one-stop solutions. We inventively combine qualitative and quantitative research in accurate proportions to have the best report, which not only gives the most recent insights but also assists you to grow.
