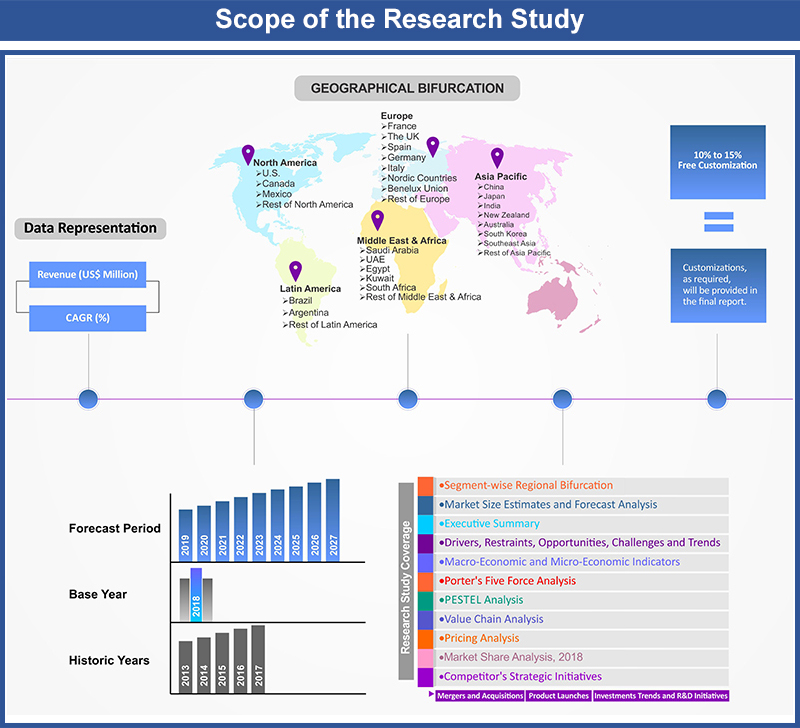
U.S and Asia Pacific Personal Productivity Software Market By Deployment Mode (Cloud Based and On Premise); By Application (Document Processing (Reports, Spreadsheets, Presentations, Databases and Others), Team Collaboration, Time Tracking, Project Management, Content Creation, Others); By End Users (Leisure and Corporate); By Region (U.S., (Northeast, Midwest, West, South), China, Japan, India, New Zealand, Australia, South Korea, Southeast Asia (Indonesia, Thailand, Malaysia, Singapore, Rest of Southeast Asia)) – Insights, Growth, Size, Comparative Analysis, Trends and Forecast, 2019 - 2027
Industry Trends
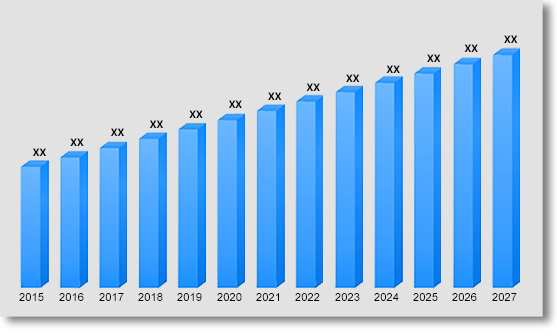
Global U.S and Asia Pacific personal productivity software market was valued at US$ 3,614.5 Mn in 2018 and is anticipated to grow at a CAGR of 13.6% over the forecast period to reach US$ 11,410.8 Mn by 2027. Increasing complexity of professional environments have increased multi-tasking in order to survive in this fast pacing and challenging world. Multi-tasking performed by most of the individuals are prone to erroneous and time consuming. This creates a demand for an external assistance to streamline the productivity and increase effectiveness of an individual. Corporates and freelance individuals are using certain tools to enhance their productivity and time utilization.
Since it’s invention, the computer has gradually developed to become an integral part of our day-to-day life. It has transformed many activities from their conventional way of practice to software based activity thus increasing their effectiveness and value. Productivity software are applications essentially designed to make everyday activities hassle-free. These software are multi-purpose tools catering a wide array of applications and requirements such as database management systems, graphics software, content creation and many others. These productivity software make people highly efficient and effective in their daily activities. With the introduction of Microsoft Office suites in 1980s, word processing, spreadsheet, relational database programs over the desktop, among others was revolutionary in productivity software market. Since then, market participants in productivity software market have expanded the offerings to cater to time management, team management, communications and many other such activities. These software are designed to address the needs of effective and efficient productivity are offered to customers either as standalone or as suites with different payment and licensing models to befit custom requirements. Thus, the multiple offerings in productivity tools to cater the transforming customer requirements in enhancing efficiency of their activities has contributed towards the growth of the U.S and Asia Pacific personal productivity software market over the forecast period.
Demand for skilled labour has surged up in recent years with modifications in workplaces and work cultures. In 2017, according to the World Bank Government of India estimates a requirement of more than 109.0 million skilled workers by 2022 across 24 key sectors of the national economy. With the advent of industry 4.0, enabled by advancements through cutting-edge technologies and enhanced capabilities through better internet connectivity led to better monitoring and management of devices. This trend of industrial revolution has up-surged the demand for skilled labour. Productivity software tools are becoming more popular and there is an increase in demand to learn productivity software skills for employment. Productivity software have also evolved with better hardware and connectivity thus becoming more consumer oriented compared to its predecessors, hence, rising the integration into personal as well as corporate life. Therefore, rise in requirement for skilled labour owing to on-going industrial revolution has boosted the growth in the U.S and Asia Pacific personal productivity software market.
Deployment Outlook:
Based on the type of deployment, on-premise deployed productivity software tools held the largest market share in the U.S. and Asia pacific personal productivity software market in 2018owing to the benefits offered including free form internet connectivity and other external factors. However, cloud based productivity software are poised to grow at highest CAGR over the forecast period. The changing work culture with increasing number of remote workers have mandated corporates to deploy cloud based tools to facilitate remote access. For instance, in 2018 according to the statistics published by U.S. Bureau of Labor around 22.0% of full time workers in U.S worked from home. The cloud based deployment has streamlined the transfer of data and application access between employer and employee thus creating a more happier and productive workforce. These cloud based solutions also supports the emerging trend of Bring Your Own Device which provides greater flexibility to employees and cut down business costs. The advancements in business intelligence and data analytics tools are gaining popularity owing to the high processing power of cloud computing which are further enhances productivity. The on-going outbreak of pandemic COVID-19 has forced many organizations to shut-down their offices and allow their employees to work remotely from their homes. This has further pushed the adoption of cloud based productivity tools by organizations to facilitate their remote working employees. Thus, the changing workplace requirements are poised to boost the growth of cloud based deployment in the U.S and Asia Pacific personal productivity software market over the forecast period.
Application Outlook
Personal productivity software tools have a wide scope of applications in document processing, team collaboration, time tracking, project management, content creation and many others. Based on the type of application, monitoring productivity tools are witnessing high adoption amongst users for finding elements hampering their productivity. Time tracking productivity software tools are the most commonly used by organizations to evaluate an employee efficiency. In 2018, time tracking software productivity tools held the highest market share in the U.S and Asia Pacific personal productivity software market. However, document processing is expected to show the fastest growth rate over the forecast period. Document processing software tools essentially include writing, formatting and printing memos, reports, spreadsheets, presentations and other documents. As majority of professionals highly encounter aforementioned tasks in their daily work routine, productivity software tools to enhance document processing are witnessing high demand. The evolution in producing documents and reports using a typewriter has led to use of computers in current scenarios. Drafting of reports constitutes a major part of document creation and processing activities practiced by individuals and organizations, thus making report processing productivity software tools a leading segment under document processing segment. Rising adoption of productivity tools by individuals and corporates to enhance their document quality is poised to boost their growth in the U.S and Asia Pacific personal productivity software market over forecast period.
End Use Outlook:
Based on the type of end use, in 2018 corporates dominated the U.S and Asia Pacific personal productivity software market. High adoption of productivity tools by corporates to monitor their workforce’s productivity and enhance their efficiency and effectiveness along the value chain has increased their market share in the personal productivity software market. In the U.S., this trend of corporate users dominating the market of productivity tools is anticipated to continue over the forecast period, however, in Asia Pacific, leisure users are anticipated to show the fastest growth rate over the forecast period. Rise in individual users opting to enhance their productivity in everyday life apart from their work is high in this region. In China, India among others stringent competition for getting employment and surviving due to large population is increasing the demand for personal productivity software.
Regional Outlook:
In 2018, the U.S accounted for the highest share in the personal productivity software market. High number of IT companies pose nurturing environment for adoption of technologies and to reap their benefits at earliest. These factors have contributed towards the high share of and the fastest growth rate of the U.S and Asia Pacific personal productivity software market over the forecast period. The study analyses the market in terms of revenue across all the major countries.
U.S Asia Pacific Personal Productivity Software Market Revenue & Forecast, (US$ Million), 2015 – 2027
Competitive Landscape
The report provides both, qualitative and quantitative research of personal productivity software market, as well as provides comprehensive insights and development methods adopted by the key contenders. The report also offers extensive research on the key players in this market and details on the competitiveness of these players. Key business strategies such as mergers and acquisitions (M&A), affiliations, collaborations, and contracts adopted by these major market participants are also recognized and analysed in the report. For each company, the report studies their U.S Asia Pacific presence, competitors, service offerings and specification amongst others.
Some of the players operating in the personal productivity software market are Adobe, Atlassian, Corel Corporation, Flock FZ-LLC, Google LLC, Harvest, HyperOffice, Infraware, Kingsoft Office Software, Memory AS, Microsoft and Zoho Corporation Pvt. Ltd amongst others.
U.S Asia Pacific Personal Productivity Software Market:
By Deployment Mode
Cloud Based
On Premise
By Application
Document Processing
- Reports
- Spreadsheets
- Presentations
- Databases
- Others
Team Collaboration
Time Tracking
Project Management
Content Creation
Others
By End Users
Leisure
Corporate
By Region
U.S
- Northeast
- Midwest
- West
- South
Asia Pacific
- China
- Japan
- India
- New Zealand
- Australia
- South Korea
Southeast Asia
- Indonesia
- Thailand
- Malaysia
- Singapore
- Rest of Southeast Asia
Rest of Asia Pacific
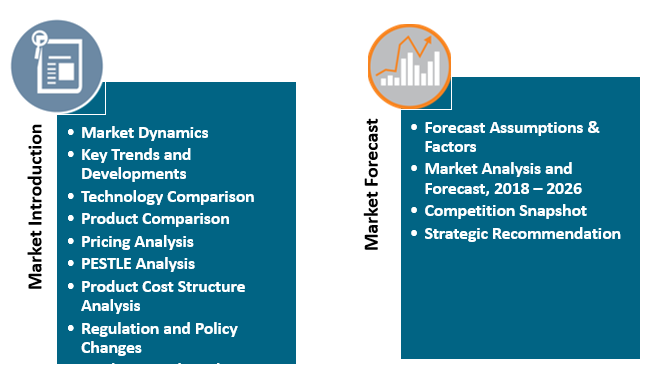
Table of Contents
![]()
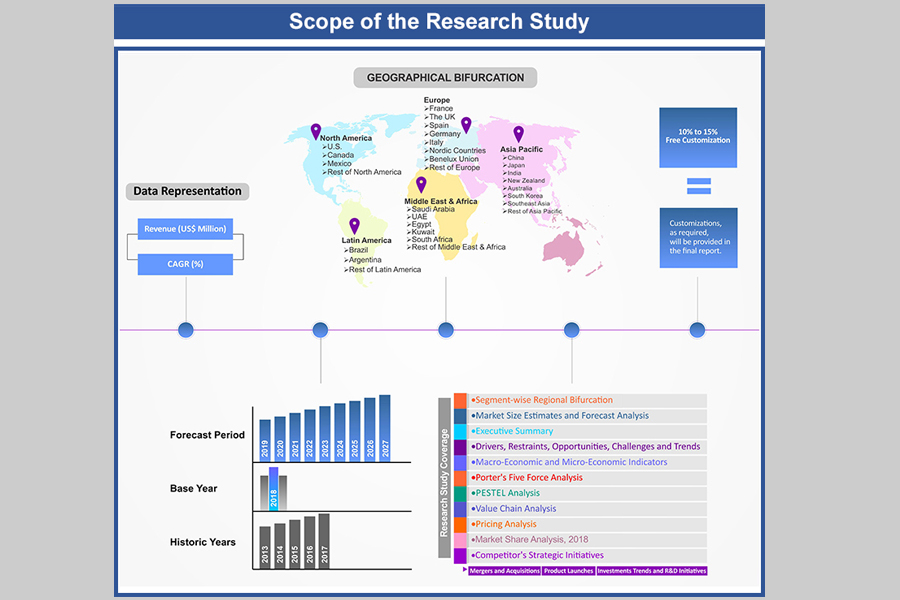
1. Market Scope
1.1. Market
Segmentation
1.2. Years
Considered
1.2.1. Historic
Years: 2013 - 2017
1.2.2. Base
Year: 2018
1.2.3. Forecast
Years: 2019 – 2027
2. Key Target Audiences
3. Research Methodology
3.1. Primary
Research
3.1.1. Research
Questionnaire
3.1.2. Asia
Pacific Percentage Breakdown
3.1.3. Primary
Interviews: Key Opinion Leaders (KOLs)
3.2. Secondary
Research
3.2.1. Paid
Databases
3.2.2. Secondary
Sources
3.3. Market
Size Estimates
3.3.1. Top-Down
Approach
3.3.2. Bottom-Up
Approach
3.4. Data
Triangulation Methodology
3.5. Research
Assumptions
4. Recommendations and Insights from AMI’s Perspective**
5. Holistic Overview of Personal Productivity Software Market
6. Market Synopsis:
Personal Productivity Software Market
7. Personal Productivity Software Market Analysis: Qualitative
Perspective
7.1. Introduction
7.1.1. Product Definition
7.1.2. Industry
Development
7.2. Market
Dynamics
7.2.1. Drivers
7.2.2. Restraints
7.2.3. Opportunities
7.2.4. Challenges
7.3. Trends in
Personal Productivity Software Market
7.4. Market
Determinants Radar Chart
7.5. Macro-Economic
and Micro-Economic Indicators: Personal Productivity Software Market
7.6. Industry
Gross Margin Overview
7.7. Porter’s
Five Force Analysis
7.8. PESTEL
Analysis
7.9. Value
Chain Analysis
7.10. Pricing
Analysis, By Asia Pacific (2017 and 2018)
7.10.1. China
7.10.2. Japan
7.10.3. India
7.10.4. New
Zealand
7.10.5. Australia
7.10.6. South
Korea
7.10.7. Southeast
Asia
7.10.7.1.1. Indonesia
7.10.7.1.2. Thailand
7.10.7.1.3. Malaysia
7.10.7.1.4. Singapore
7.10.7.1.5. Rest of Southeast Asia
7.10.8. Rest of
Asia Pacific
8. Asia Pacific Personal Productivity Software Market Analysis
and Forecasts, 2019 – 2027
8.1. Overview
8.1.1. Asia
Pacific Personal Productivity Software Market Revenue (US$ Mn)
8.2. Asia
Pacific Personal Productivity Software Market Revenue (US$ Mn) and Forecasts,
By Deployment Mode
8.2.1. Cloud
Based
8.2.1.1. Definition
8.2.1.2. Market Penetration, 2018
8.2.1.3. Market Estimation, 2013 – 2018
8.2.1.4. Market Forecast, 2019 – 2027
8.2.1.5. Compound Annual Growth Rate (CAGR)
8.2.1.6. Regional Bifurcation
8.2.1.6.1. China
8.2.1.6.1.1. Market
Estimation, 2013 – 2018
8.2.1.6.1.2. Market
Forecast, 2019 – 2027
8.2.1.6.2. Japan
8.2.1.6.2.1. Market
Estimation, 2013 – 2018
8.2.1.6.2.2. Market
Forecast, 2019 – 2027
8.2.1.6.3. India
8.2.1.6.3.1. Market
Estimation, 2013 – 2018
8.2.1.6.3.2. Market
Forecast, 2019 – 2027
8.2.1.6.4. New Zealand
8.2.1.6.4.1. Market
Estimation, 2013 – 2018
8.2.1.6.4.2. Market
Forecast, 2019 – 2027
8.2.1.6.5. Australia
8.2.1.6.5.1. Market
Estimation, 2013 – 2018
8.2.1.6.5.2. Market
Forecast, 2019 – 2027
8.2.1.6.6. South Korea
8.2.1.6.6.1. Market
Estimation, 2013 – 2018
8.2.1.6.6.2. Market
Forecast, 2019 – 2027
8.2.1.6.7. Southeast Asia
8.2.1.6.7.1. Market
Estimation, 2013 – 2018
8.2.1.6.7.2. Market
Forecast, 2019 – 2027
8.2.1.6.8. Rest of Asia Pacific
8.2.1.6.8.1. Market
Estimation, 2013 – 2018
8.2.1.6.8.2. Market
Forecast, 2019 – 2027
8.2.2. On
Premise
8.2.2.1. Definition
8.2.2.2. Market Penetration, 2018
8.2.2.3. Market Estimation, 2013 – 2018
8.2.2.4. Market Forecast, 2019 – 2027
8.2.2.5. Compound Annual Growth Rate (CAGR)
8.2.2.6. Regional Bifurcation
8.2.2.6.1. China
8.2.2.6.1.1. Market
Estimation, 2013 – 2018
8.2.2.6.1.2. Market
Forecast, 2019 – 2027
8.2.2.6.2. Japan
8.2.2.6.2.1. Market
Estimation, 2013 – 2018
8.2.2.6.2.2. Market
Forecast, 2019 – 2027
8.2.2.6.3. India
8.2.2.6.3.1. Market
Estimation, 2013 – 2018
8.2.2.6.3.2. Market
Forecast, 2019 – 2027
8.2.2.6.4. New Zealand
8.2.2.6.4.1. Market
Estimation, 2013 – 2018
8.2.2.6.4.2. Market
Forecast, 2019 – 2027
8.2.2.6.5. Australia
8.2.2.6.5.1. Market
Estimation, 2013 – 2018
8.2.2.6.5.2. Market
Forecast, 2019 – 2027
8.2.2.6.6. South Korea
8.2.2.6.6.1. Market
Estimation, 2013 – 2018
8.2.2.6.6.2. Market
Forecast, 2019 – 2027
8.2.2.6.7. Southeast Asia
8.2.2.6.7.1. Market
Estimation, 2013 – 2018
8.2.2.6.7.2. Market
Forecast, 2019 – 2027
8.2.2.6.8. Rest of Asia Pacific
8.2.2.6.8.1. Market
Estimation, 2013 – 2018
8.2.2.6.8.2. Market
Forecast, 2019 – 2027
8.3. Key
Segment for Channeling Investments
8.3.1. By
Deployment Mode
9. Asia Pacific Personal Productivity Software Market Analysis
and Forecasts, 2019 – 2027
9.1. Overview
9.2. Asia
Pacific Personal Productivity Software Market Revenue (US$ Mn) and Forecasts,
By Application
9.2.1. Document
Processing (Definition, Market Penetration (2018), Market Estimation (2013 –
2018), Market Forecast (2019 – 2027), Compound Annual Growth Rate (CAGR),
Regional Bifurcation (China, Japan, India, New Zealand, Australia, South Korea,
Southeast Asia, Rest of Asia Pacific) and Information on Reports, Spreadsheets,
Presentations, Databases, Others)
9.2.1.1. Reports
9.2.1.2. Spreadsheets
9.2.1.3. Presentations
9.2.1.4. Databases
9.2.1.5. Others
9.2.2. Team
Collaboration
9.2.2.1. Definition
9.2.2.2. Market Penetration, 2018
9.2.2.3. Market Estimation, 2013 – 2018
9.2.2.4. Market Forecast, 2019 – 2027
9.2.2.5. Compound Annual Growth Rate (CAGR)
9.2.2.6. Regional Bifurcation
9.2.2.6.1. China
9.2.2.6.1.1. Market
Estimation, 2013 – 2018
9.2.2.6.1.2. Market
Forecast, 2019 – 2027
9.2.2.6.2. Japan
9.2.2.6.2.1. Market
Estimation, 2013 – 2018
9.2.2.6.2.2. Market
Forecast, 2019 – 2027
9.2.2.6.3. India
9.2.2.6.3.1. Market
Estimation, 2013 – 2018
9.2.2.6.3.2. Market
Forecast, 2019 – 2027
9.2.2.6.4. New Zealand
9.2.2.6.4.1. Market
Estimation, 2013 – 2018
9.2.2.6.4.2. Market
Forecast, 2019 – 2027
9.2.2.6.5. Australia
9.2.2.6.5.1. Market
Estimation, 2013 – 2018
9.2.2.6.5.2. Market
Forecast, 2019 – 2027
9.2.2.6.6. South Korea
9.2.2.6.6.1. Market
Estimation, 2013 – 2018
9.2.2.6.6.2. Market
Forecast, 2019 – 2027
9.2.2.6.7. Southeast Asia
9.2.2.6.7.1. Market
Estimation, 2013 – 2018
9.2.2.6.7.2. Market
Forecast, 2019 – 2027
9.2.2.6.8. Rest of Asia Pacific
9.2.2.6.8.1. Market
Estimation, 2013 – 2018
9.2.2.6.8.2. Market
Forecast, 2019 – 2027
9.2.3. Time
Tracking
9.2.3.1. Definition
9.2.3.2. Market Penetration, 2018
9.2.3.3. Market Estimation, 2013 – 2018
9.2.3.4. Market Forecast, 2019 – 2027
9.2.3.5. Compound Annual Growth Rate (CAGR)
9.2.3.6. Regional Bifurcation
9.2.3.6.1. China
9.2.3.6.1.1. Market
Estimation, 2013 – 2018
9.2.3.6.1.2. Market
Forecast, 2019 – 2027
9.2.3.6.2. Japan
9.2.3.6.2.1. Market
Estimation, 2013 – 2018
9.2.3.6.2.2. Market
Forecast, 2019 – 2027
9.2.3.6.3. India
9.2.3.6.3.1. Market
Estimation, 2013 – 2018
9.2.3.6.3.2. Market
Forecast, 2019 – 2027
9.2.3.6.4. New Zealand
9.2.3.6.4.1. Market
Estimation, 2013 – 2018
9.2.3.6.4.2. Market
Forecast, 2019 – 2027
9.2.3.6.5. Australia
9.2.3.6.5.1. Market
Estimation, 2013 – 2018
9.2.3.6.5.2. Market
Forecast, 2019 – 2027
9.2.3.6.6. South Korea
9.2.3.6.6.1. Market
Estimation, 2013 – 2018
9.2.3.6.6.2. Market
Forecast, 2019 – 2027
9.2.3.6.7. Southeast Asia
9.2.3.6.7.1. Market
Estimation, 2013 – 2018
9.2.3.6.7.2. Market
Forecast, 2019 – 2027
9.2.3.6.8. Rest of Asia Pacific
9.2.3.6.8.1. Market
Estimation, 2013 – 2018
9.2.3.6.8.2. Market
Forecast, 2019 – 2027
9.2.4. Project
Management
9.2.4.1. Definition
9.2.4.2. Market Penetration, 2018
9.2.4.3. Market Estimation, 2013 – 2018
9.2.4.4. Market Forecast, 2019 – 2027
9.2.4.5. Compound Annual Growth Rate (CAGR)
9.2.4.6. Regional Bifurcation
9.2.4.6.1. China
9.2.4.6.1.1. Market
Estimation, 2013 – 2018
9.2.4.6.1.2. Market
Forecast, 2019 – 2027
9.2.4.6.2. Japan
9.2.4.6.2.1. Market
Estimation, 2013 – 2018
9.2.4.6.2.2. Market
Forecast, 2019 – 2027
9.2.4.6.3. India
9.2.4.6.3.1. Market
Estimation, 2013 – 2018
9.2.4.6.3.2. Market
Forecast, 2019 – 2027
9.2.4.6.4. New Zealand
9.2.4.6.4.1. Market
Estimation, 2013 – 2018
9.2.4.6.4.2. Market
Forecast, 2019 – 2027
9.2.4.6.5. Australia
9.2.4.6.5.1. Market
Estimation, 2013 – 2018
9.2.4.6.5.2. Market
Forecast, 2019 – 2027
9.2.4.6.6. South Korea
9.2.4.6.6.1. Market
Estimation, 2013 – 2018
9.2.4.6.6.2. Market
Forecast, 2019 – 2027
9.2.4.6.7. Southeast Asia
9.2.4.6.7.1. Market
Estimation, 2013 – 2018
9.2.4.6.7.2. Market
Forecast, 2019 – 2027
9.2.4.6.8. Rest of Asia Pacific
9.2.4.6.8.1. Market
Estimation, 2013 – 2018
9.2.4.6.8.2. Market
Forecast, 2019 – 2027
9.2.5. Content
Creation
9.2.5.1. Definition
9.2.5.2. Market Penetration, 2018
9.2.5.3. Market Estimation, 2013 – 2018
9.2.5.4. Market Forecast, 2019 – 2027
9.2.5.5. Compound Annual Growth Rate (CAGR)
9.2.5.6. Regional Bifurcation
9.2.5.6.1. China
9.2.5.6.1.1. Market
Estimation, 2013 – 2018
9.2.5.6.1.2. Market
Forecast, 2019 – 2027
9.2.5.6.2. Japan
9.2.5.6.2.1. Market
Estimation, 2013 – 2018
9.2.5.6.2.2. Market
Forecast, 2019 – 2027
9.2.5.6.3. India
9.2.5.6.3.1. Market
Estimation, 2013 – 2018
9.2.5.6.3.2. Market
Forecast, 2019 – 2027
9.2.5.6.4. New Zealand
9.2.5.6.4.1. Market
Estimation, 2013 – 2018
9.2.5.6.4.2. Market
Forecast, 2019 – 2027
9.2.5.6.5. Australia
9.2.5.6.5.1. Market
Estimation, 2013 – 2018
9.2.5.6.5.2. Market
Forecast, 2019 – 2027
9.2.5.6.6. South Korea
9.2.5.6.6.1. Market
Estimation, 2013 – 2018
9.2.5.6.6.2. Market
Forecast, 2019 – 2027
9.2.5.6.7. Southeast Asia
9.2.5.6.7.1. Market
Estimation, 2013 – 2018
9.2.5.6.7.2. Market
Forecast, 2019 – 2027
9.2.5.6.8. Rest of Asia Pacific
9.2.5.6.8.1. Market
Estimation, 2013 – 2018
9.2.5.6.8.2. Market
Forecast, 2019 – 2027
9.2.6. Others
9.2.6.1. Definition
9.2.6.2. Market Penetration, 2018
9.2.6.3. Market Estimation, 2013 – 2018
9.2.6.4. Market Forecast, 2019 – 2027
9.2.6.5. Compound Annual Growth Rate (CAGR)
9.2.6.6. Regional Bifurcation
9.2.6.6.1. China
9.2.6.6.1.1. Market
Estimation, 2013 – 2018
9.2.6.6.1.2. Market
Forecast, 2019 – 2027
9.2.6.6.2. Japan
9.2.6.6.2.1. Market
Estimation, 2013 – 2018
9.2.6.6.2.2. Market
Forecast, 2019 – 2027
9.2.6.6.3. India
9.2.6.6.3.1. Market
Estimation, 2013 – 2018
9.2.6.6.3.2. Market
Forecast, 2019 – 2027
9.2.6.6.4. New Zealand
9.2.6.6.4.1. Market
Estimation, 2013 – 2018
9.2.6.6.4.2. Market
Forecast, 2019 – 2027
9.2.6.6.5. Australia
9.2.6.6.5.1. Market
Estimation, 2013 – 2018
9.2.6.6.5.2. Market
Forecast, 2019 – 2027
9.2.6.6.6. South Korea
9.2.6.6.6.1. Market
Estimation, 2013 – 2018
9.2.6.6.6.2. Market
Forecast, 2019 – 2027
9.2.6.6.7. Southeast Asia
9.2.6.6.7.1. Market
Estimation, 2013 – 2018
9.2.6.6.7.2. Market
Forecast, 2019 – 2027
9.2.6.6.8. Rest of Asia Pacific
9.2.6.6.8.1. Market
Estimation, 2013 – 2018
9.2.6.6.8.2. Market
Forecast, 2019 – 2027
9.3. Key
Segment for Channeling Investments
9.3.1. By
Application
10. Asia Pacific Personal Productivity Software Market Analysis
and Forecasts, 2019 – 2027
10.1. Overview
10.2. Asia
Pacific Personal Productivity Software Market Revenue (US$ Mn) and Forecasts,
By End Users
10.2.1. Leisure
10.2.1.1. Definition
10.2.1.2. Market Penetration, 2018
10.2.1.3. Market Estimation, 2013 – 2018
10.2.1.4. Market Forecast, 2019 – 2027
10.2.1.5. Compound Annual Growth Rate (CAGR)
10.2.1.6. Regional Bifurcation
10.2.1.6.1. China
10.2.1.6.1.1. Market
Estimation, 2013 – 2018
10.2.1.6.1.2. Market
Forecast, 2019 – 2027
10.2.1.6.2. Japan
10.2.1.6.2.1. Market
Estimation, 2013 – 2018
10.2.1.6.2.2. Market
Forecast, 2019 – 2027
10.2.1.6.3. India
10.2.1.6.3.1. Market
Estimation, 2013 – 2018
10.2.1.6.3.2. Market
Forecast, 2019 – 2027
10.2.1.6.4. New Zealand
10.2.1.6.4.1. Market
Estimation, 2013 – 2018
10.2.1.6.4.2. Market
Forecast, 2019 – 2027
10.2.1.6.5. Australia
10.2.1.6.5.1. Market
Estimation, 2013 – 2018
10.2.1.6.5.2. Market
Forecast, 2019 – 2027
10.2.1.6.6. South Korea
10.2.1.6.6.1. Market
Estimation, 2013 – 2018
10.2.1.6.6.2. Market
Forecast, 2019 – 2027
10.2.1.6.7. Southeast Asia
10.2.1.6.7.1. Market
Estimation, 2013 – 2018
10.2.1.6.7.2. Market
Forecast, 2019 – 2027
10.2.1.6.8. Rest of Asia Pacific
10.2.1.6.8.1. Market
Estimation, 2013 – 2018
10.2.1.6.8.2. Market
Forecast, 2019 – 2027
10.2.2. Corporate
10.2.2.1. Definition
10.2.2.2. Market Penetration, 2018
10.2.2.3. Market Estimation, 2013 – 2018
10.2.2.4. Market Forecast, 2019 – 2027
10.2.2.5. Compound Annual Growth Rate (CAGR)
10.2.2.6. Regional Bifurcation
10.2.2.6.1. China
10.2.2.6.1.1. Market
Estimation, 2013 – 2018
10.2.2.6.1.2. Market
Forecast, 2019 – 2027
10.2.2.6.2. Japan
10.2.2.6.2.1. Market
Estimation, 2013 – 2018
10.2.2.6.2.2. Market
Forecast, 2019 – 2027
10.2.2.6.3. India
10.2.2.6.3.1. Market
Estimation, 2013 – 2018
10.2.2.6.3.2. Market
Forecast, 2019 – 2027
10.2.2.6.4. New Zealand
10.2.2.6.4.1. Market
Estimation, 2013 – 2018
10.2.2.6.4.2. Market
Forecast, 2019 – 2027
10.2.2.6.5. Australia
10.2.2.6.5.1. Market
Estimation, 2013 – 2018
10.2.2.6.5.2. Market
Forecast, 2019 – 2027
10.2.2.6.6. South Korea
10.2.2.6.6.1. Market
Estimation, 2013 – 2018
10.2.2.6.6.2. Market
Forecast, 2019 – 2027
10.2.2.6.7. Southeast Asia
10.2.2.6.7.1. Market
Estimation, 2013 – 2018
10.2.2.6.7.2. Market
Forecast, 2019 – 2027
10.2.2.6.8. Rest of Asia Pacific
10.2.2.6.8.1. Market
Estimation, 2013 – 2018
10.2.2.6.8.2. Market
Forecast, 2019 – 2027
10.3. Key
Segment for Channeling Investments
10.3.1. By End
Users
11. Asia Pacific Personal Productivity Software Market Analysis
and Forecasts, 2019 - 2027
11.1. Asia
Pacific Personal Productivity Software Market Revenue (US$ Mn), By Country
11.1.1. China
11.1.1.1. China Personal Productivity Software Market Revenue (US$ Mn)
and Forecasts, By Deployment Mode
11.1.1.1.1. Cloud Based
11.1.1.1.2. On Premise
11.1.1.2. China Personal Productivity Software Market Revenue (US$ Mn)
and Forecasts, By Application
11.1.1.2.1. Document Processing
11.1.1.2.1.1. Reports
11.1.1.2.1.2. Spreadsheets
11.1.1.2.1.3. Presentations
11.1.1.2.1.4. Databases
11.1.1.2.1.5. Others
11.1.1.2.2. Team Collaboration
11.1.1.2.3. Time Tracking
11.1.1.2.4. Project Management
11.1.1.2.5. Content Creation
11.1.1.2.6. Others
11.1.1.3. China Personal Productivity Software Market Revenue (US$ Mn)
and Forecasts, By End Users
11.1.1.3.1. Leisure
11.1.1.3.2. Corporate
11.1.2. Japan
11.1.2.1. Japan Personal Productivity Software Market Revenue (US$ Mn)
and Forecasts, By Deployment Mode
11.1.2.1.1. Cloud Based
11.1.2.1.2. On Premise
11.1.2.2. Japan Personal Productivity Software Market Revenue (US$ Mn)
and Forecasts, By Application
11.1.2.2.1. Document Processing
11.1.2.2.1.1. Reports
11.1.2.2.1.2. Spreadsheets
11.1.2.2.1.3. Presentations
11.1.2.2.1.4. Databases
11.1.2.2.1.5. Others
11.1.2.2.2. Team Collaboration
11.1.2.2.3. Time Tracking
11.1.2.2.4. Project Management
11.1.2.2.5. Content Creation
11.1.2.2.6. Others
11.1.2.3. Japan Personal Productivity Software Market Revenue (US$ Mn)
and Forecasts, By End Users
11.1.2.3.1. Leisure
11.1.2.3.2. Corporate
11.1.3. India
11.1.3.1. India Personal Productivity Software Market Revenue (US$ Mn)
and Forecasts, By Deployment Mode
11.1.3.1.1. Cloud Based
11.1.3.1.2. On Premise
11.1.3.2. India Personal Productivity Software Market Revenue (US$ Mn)
and Forecasts, By Application
11.1.3.2.1. Document Processing
11.1.3.2.1.1. Reports
11.1.3.2.1.2. Spreadsheets
11.1.3.2.1.3. Presentations
11.1.3.2.1.4. Databases
11.1.3.2.1.5. Others
11.1.3.2.2. Team Collaboration
11.1.3.2.3. Time Tracking
11.1.3.2.4. Project Management
11.1.3.2.5. Content Creation
11.1.3.2.6. Others
11.1.3.3. India Personal Productivity Software Market Revenue (US$ Mn)
and Forecasts, By End Users
11.1.3.3.1. Leisure
11.1.3.3.2. Corporate
11.1.4. New
Zealand
11.1.4.1. New Zealand Personal Productivity Software Market Revenue (US$
Mn) and Forecasts, By Deployment Mode
11.1.4.1.1. Cloud Based
11.1.4.1.2. On Premise
11.1.4.2. New Zealand Personal Productivity Software Market Revenue (US$
Mn) and Forecasts, By Application
11.1.4.2.1. Document Processing
11.1.4.2.1.1. Reports
11.1.4.2.1.2. Spreadsheets
11.1.4.2.1.3. Presentations
11.1.4.2.1.4. Databases
11.1.4.2.1.5. Others
11.1.4.2.2. Team Collaboration
11.1.4.2.3. Time Tracking
11.1.4.2.4. Project Management
11.1.4.2.5. Content Creation
11.1.4.2.6. Others
11.1.4.3. New Zealand Personal Productivity Software Market Revenue (US$
Mn) and Forecasts, By End Users
11.1.4.3.1. Leisure
11.1.4.3.2. Corporate
11.1.5. Australia
11.1.5.1. Australia Personal Productivity Software Market Revenue (US$
Mn) and Forecasts, By Deployment Mode
11.1.5.1.1. Cloud Based
11.1.5.1.2. On Premise
11.1.5.2. Australia Personal Productivity Software Market Revenue (US$
Mn) and Forecasts, By Application
11.1.5.2.1. Document Processing
11.1.5.2.1.1. Reports
11.1.5.2.1.2. Spreadsheets
11.1.5.2.1.3. Presentations
11.1.5.2.1.4. Databases
11.1.5.2.1.5. Others
11.1.5.2.2. Team Collaboration
11.1.5.2.3. Time Tracking
11.1.5.2.4. Project Management
11.1.5.2.5. Content Creation
11.1.5.2.6. Others
11.1.5.3. Australia Personal Productivity Software Market Revenue (US$
Mn) and Forecasts, By End Users
11.1.5.3.1. Leisure
11.1.5.3.2. Corporate
11.1.6. South
Korea
11.1.6.1. South Korea Personal Productivity Software Market Revenue (US$
Mn) and Forecasts, By Deployment Mode
11.1.6.1.1. Cloud Based
11.1.6.1.2. On Premise
11.1.6.2. South Korea Personal Productivity Software Market Revenue (US$
Mn) and Forecasts, By Application
11.1.6.2.1. Document Processing
11.1.6.2.1.1. Reports
11.1.6.2.1.2. Spreadsheets
11.1.6.2.1.3. Presentations
11.1.6.2.1.4. Databases
11.1.6.2.1.5. Others
11.1.6.2.2. Team Collaboration
11.1.6.2.3. Time Tracking
11.1.6.2.4. Project Management
11.1.6.2.5. Content Creation
11.1.6.2.6. Others
11.1.6.3. South Korea Personal Productivity Software Market Revenue (US$
Mn) and Forecasts, By End Users
11.1.6.3.1. Leisure
11.1.6.3.2. Corporate
11.1.7. Southeast
Asia
11.1.7.1. Southeast Asia Personal Productivity Software Market Revenue
(US$ Mn) and Forecasts, By Deployment Mode
11.1.7.1.1. Cloud Based
11.1.7.1.2. On Premise
11.1.7.2. Southeast Asia Personal Productivity Software Market Revenue
(US$ Mn) and Forecasts, By Application
11.1.7.2.1. Document Processing
11.1.7.2.1.1. Reports
11.1.7.2.1.2. Spreadsheets
11.1.7.2.1.3. Presentations
11.1.7.2.1.4. Databases
11.1.7.2.1.5. Others
11.1.7.2.2. Team Collaboration
11.1.7.2.3. Time Tracking
11.1.7.2.4. Project Management
11.1.7.2.5. Content Creation
11.1.7.2.6. Others
11.1.7.3. Southeast Asia Personal Productivity Software Market Revenue
(US$ Mn) and Forecasts, By End Users
11.1.7.3.1. Leisure
11.1.7.3.2. Corporate
11.1.7.4. Southeast Asia Personal Productivity Software Market Revenue
(US$ Mn) and Forecasts, By Country
11.1.7.4.1. Indonesia
11.1.7.4.2. Thailand
11.1.7.4.3. Malaysia
11.1.7.4.4. Singapore
11.1.7.4.5. Rest of Southeast Asia
11.1.8. Rest of
Asia Pacific
11.1.8.1. Rest of Asia Pacific Personal Productivity Software Market
Revenue (US$ Mn) and Forecasts, By Deployment Mode
11.1.8.1.1. Cloud Based
11.1.8.1.2. On Premise
11.1.8.2. Rest of Asia Pacific Personal Productivity Software Market
Revenue (US$ Mn) and Forecasts, By Application
11.1.8.2.1. Document Processing
11.1.8.2.1.1. Reports
11.1.8.2.1.2. Spreadsheets
11.1.8.2.1.3. Presentations
11.1.8.2.1.4. Databases
11.1.8.2.1.5. Others
11.1.8.2.2. Team Collaboration
11.1.8.2.3. Time Tracking
11.1.8.2.4. Project Management
11.1.8.2.5. Content Creation
11.1.8.2.6. Others
11.1.8.3. Rest of Asia Pacific Personal Productivity Software Market
Revenue (US$ Mn) and Forecasts, By End Users
11.1.8.3.1. Leisure
11.1.8.3.2. Corporate
11.2. Key
Segment for Channeling Investments
11.2.1. By
Country
11.2.2. By
Deployment Mode
11.2.3. By
Application
11.2.4. By End
Users
12. United States Personal Productivity Software Market Analysis
and Forecasts, 2019 – 2027
12.1. Overview
12.1.1. United
States Personal Productivity Software Market Revenue (US$ Mn)
12.2. United
States Personal Productivity Software Market Revenue (US$ Mn) and Forecasts, By
Deployment Mode
12.2.1. Cloud
Based
12.2.1.1. Market Penetration, 2018
12.2.1.2. Market Estimation, 2013 – 2018
12.2.1.3. Market Forecast, 2019 – 2027
12.2.1.4. Compound Annual Growth Rate (CAGR)
12.2.1.5. Regional Bifurcation
12.2.1.5.1. Northeast
12.2.1.5.1.1. Market
Estimation, 2013 – 2018
12.2.1.5.1.2. Market
Forecast, 2019 – 2027
12.2.1.5.2. West
12.2.1.5.2.1. Market
Estimation, 2013 – 2018
12.2.1.5.2.2. Market
Forecast, 2019 – 2027
12.2.1.5.3. South
12.2.1.5.3.1. Market
Estimation, 2013 – 2018
12.2.1.5.3.2. Market
Forecast, 2019 – 2027
12.2.1.5.4. Midwest
12.2.1.5.4.1. Market
Estimation, 2013 – 2018
12.2.1.5.4.2. Market
Forecast, 2019 – 2027
12.2.2. On
Premise
12.2.2.1. Market Penetration, 2018
12.2.2.2. Market Estimation, 2013 – 2018
12.2.2.3. Market Forecast, 2019 – 2027
12.2.2.4. Compound Annual Growth Rate (CAGR)
12.2.2.5. Regional Bifurcation
12.2.2.5.1. Northeast
12.2.2.5.1.1. Market
Estimation, 2013 – 2018
12.2.2.5.1.2. Market
Forecast, 2019 – 2027
12.2.2.5.2. West
12.2.2.5.2.1. Market
Estimation, 2013 – 2018
12.2.2.5.2.2. Market
Forecast, 2019 – 2027
12.2.2.5.3. South
12.2.2.5.3.1. Market
Estimation, 2013 – 2018
12.2.2.5.3.2. Market
Forecast, 2019 – 2027
12.2.2.5.4. Midwest
12.2.2.5.4.1. Market
Estimation, 2013 – 2018
12.2.2.5.4.2. Market
Forecast, 2019 – 2027
12.3. Key
Segment for Channeling Investments
12.3.1. By
Deployment Mode
13. United States Personal Productivity Software Market Analysis
and Forecasts, 2019 – 2027
13.1. Overview
13.2. United
States Personal Productivity Software Market Revenue (US$ Mn) and Forecasts, By
Application
13.2.1. Document
Processing (Definition, Market Penetration (2018), Market Estimation (2013 –
2018), Market Forecast (2019 – 2027), Compound Annual Growth Rate (CAGR),
Regional Bifurcation (Northeast, West, South, Midwest) and Information on
Reports, Spreadsheets, Presentations, Databases, Others)
13.2.1.1. Reports
13.2.1.2. Spreadsheets
13.2.1.3. Presentations
13.2.1.4. Databases
13.2.1.5. Others
13.2.2. Team
Collaboration
13.2.2.1. Market Penetration, 2018
13.2.2.2. Market Estimation, 2013 – 2018
13.2.2.3. Market Forecast, 2019 – 2027
13.2.2.4. Compound Annual Growth Rate (CAGR)
13.2.2.5. Regional Bifurcation
13.2.2.5.1. Northeast
13.2.2.5.1.1. Market
Estimation, 2013 – 2018
13.2.2.5.1.2. Market
Forecast, 2019 – 2027
13.2.2.5.2. West
13.2.2.5.2.1. Market
Estimation, 2013 – 2018
13.2.2.5.2.2. Market
Forecast, 2019 – 2027
13.2.2.5.3. South
13.2.2.5.3.1. Market
Estimation, 2013 – 2018
13.2.2.5.3.2. Market
Forecast, 2019 – 2027
13.2.2.5.4. Midwest
13.2.2.5.4.1. Market
Estimation, 2013 – 2018
13.2.2.5.4.2. Market
Forecast, 2019 – 2027
13.2.3. Time
Tracking
13.2.3.1. Market Penetration, 2018
13.2.3.2. Market Estimation, 2013 – 2018
13.2.3.3. Market Forecast, 2019 – 2027
13.2.3.4. Compound Annual Growth Rate (CAGR)
13.2.3.5. Regional Bifurcation
13.2.3.5.1. Northeast
13.2.3.5.1.1. Market
Estimation, 2013 – 2018
13.2.3.5.1.2. Market
Forecast, 2019 – 2027
13.2.3.5.2. West
13.2.3.5.2.1. Market
Estimation, 2013 – 2018
13.2.3.5.2.2. Market
Forecast, 2019 – 2027
13.2.3.5.3. South
13.2.3.5.3.1. Market
Estimation, 2013 – 2018
13.2.3.5.3.2. Market
Forecast, 2019 – 2027
13.2.3.5.4. Midwest
13.2.3.5.4.1. Market
Estimation, 2013 – 2018
13.2.3.5.4.2. Market
Forecast, 2019 – 2027
13.2.4. Project
Management
13.2.4.1. Market Penetration, 2018
13.2.4.2. Market Estimation, 2013 – 2018
13.2.4.3. Market Forecast, 2019 – 2027
13.2.4.4. Compound Annual Growth Rate (CAGR)
13.2.4.5. Regional Bifurcation
13.2.4.5.1. Northeast
13.2.4.5.1.1. Market
Estimation, 2013 – 2018
13.2.4.5.1.2. Market
Forecast, 2019 – 2027
13.2.4.5.2. West
13.2.4.5.2.1. Market
Estimation, 2013 – 2018
13.2.4.5.2.2. Market
Forecast, 2019 – 2027
13.2.4.5.3. South
13.2.4.5.3.1. Market
Estimation, 2013 – 2018
13.2.4.5.3.2. Market
Forecast, 2019 – 2027
13.2.4.5.4. Midwest
13.2.4.5.4.1. Market
Estimation, 2013 – 2018
13.2.4.5.4.2. Market
Forecast, 2019 – 2027
13.2.5. Content
Creation
13.2.5.1. Market Penetration, 2018
13.2.5.2. Market Estimation, 2013 – 2018
13.2.5.3. Market Forecast, 2019 – 2027
13.2.5.4. Compound Annual Growth Rate (CAGR)
13.2.5.5. Regional Bifurcation
13.2.5.5.1. Northeast
13.2.5.5.1.1. Market
Estimation, 2013 – 2018
13.2.5.5.1.2. Market
Forecast, 2019 – 2027
13.2.5.5.2. West
13.2.5.5.2.1. Market
Estimation, 2013 – 2018
13.2.5.5.2.2. Market
Forecast, 2019 – 2027
13.2.5.5.3. South
13.2.5.5.3.1. Market
Estimation, 2013 – 2018
13.2.5.5.3.2. Market
Forecast, 2019 – 2027
13.2.5.5.4. Midwest
13.2.5.5.4.1. Market
Estimation, 2013 – 2018
13.2.5.5.4.2. Market
Forecast, 2019 – 2027
13.2.6. Others
13.2.6.1. Market Penetration, 2018
13.2.6.2. Market Estimation, 2013 – 2018
13.2.6.3. Market Forecast, 2019 – 2027
13.2.6.4. Compound Annual Growth Rate (CAGR)
13.2.6.5. Regional Bifurcation
13.2.6.5.1. Northeast
13.2.6.5.1.1. Market
Estimation, 2013 – 2018
13.2.6.5.1.2. Market
Forecast, 2019 – 2027
13.2.6.5.2. West
13.2.6.5.2.1. Market
Estimation, 2013 – 2018
13.2.6.5.2.2. Market
Forecast, 2019 – 2027
13.2.6.5.3. South
13.2.6.5.3.1. Market
Estimation, 2013 – 2018
13.2.6.5.3.2. Market
Forecast, 2019 – 2027
13.2.6.5.4. Midwest
13.2.6.5.4.1. Market
Estimation, 2013 – 2018
13.2.6.5.4.2. Market
Forecast, 2019 – 2027
13.3. Key
Segment for Channeling Investments
13.3.1. By
Application
14. United States Personal Productivity Software Market Analysis
and Forecasts, 2019 – 2027
14.1. Overview
14.2. United
States Personal Productivity Software Market Revenue (US$ Mn) and Forecasts, By End Users
14.2.1. Leisure
14.2.1.1. Market Penetration, 2018
14.2.1.2. Market Estimation, 2013 – 2018
14.2.1.3. Market Forecast, 2019 – 2027
14.2.1.4. Compound Annual Growth Rate (CAGR)
14.2.1.5. Regional Bifurcation
14.2.1.5.1. Northeast
14.2.1.5.1.1. Market
Estimation, 2013 – 2018
14.2.1.5.1.2. Market
Forecast, 2019 – 2027
14.2.1.5.2. West
14.2.1.5.2.1. Market
Estimation, 2013 – 2018
14.2.1.5.2.2. Market
Forecast, 2019 – 2027
14.2.1.5.3. South
14.2.1.5.3.1. Market
Estimation, 2013 – 2018
14.2.1.5.3.2. Market
Forecast, 2019 – 2027
14.2.1.5.4. Midwest
14.2.1.5.4.1. Market
Estimation, 2013 – 2018
14.2.1.5.4.2. Market
Forecast, 2019 – 2027
14.2.2. Corporate
14.2.2.1. Market Penetration, 2018
14.2.2.2. Market Estimation, 2013 – 2018
14.2.2.3. Market Forecast, 2019 – 2027
14.2.2.4. Compound Annual Growth Rate (CAGR)
14.2.2.5. Regional Bifurcation
14.2.2.5.1. Northeast
14.2.2.5.1.1. Market
Estimation, 2013 – 2018
14.2.2.5.1.2. Market
Forecast, 2019 – 2027
14.2.2.5.2. West
14.2.2.5.2.1. Market
Estimation, 2013 – 2018
14.2.2.5.2.2. Market
Forecast, 2019 – 2027
14.2.2.5.3. South
14.2.2.5.3.1. Market
Estimation, 2013 – 2018
14.2.2.5.3.2. Market
Forecast, 2019 – 2027
14.2.2.5.4. Midwest
14.2.2.5.4.1. Market
Estimation, 2013 – 2018
14.2.2.5.4.2. Market
Forecast, 2019 – 2027
14.3. Key
Segment for Channeling Investments
14.3.1. By End
Users
15. United States Personal Productivity Software Market Analysis
and Forecasts, 2019 – 2027
15.1. Overview
15.2. United
States Personal Productivity Software Market Revenue (US$ Mn) and Forecasts By
Region
15.2.1. Northeast
15.2.1.1. Northeast Personal Productivity Software Market Revenue (US$
Mn) and Forecasts, By Deployment Mode
15.2.1.1.1. Cloud Based
15.2.1.1.2. On Premise
15.2.1.2. Northeast Personal Productivity Software Market Revenue (US$
Mn) and Forecasts, By Application
15.2.1.2.1. Document Processing
15.2.1.2.1.1. Reports
15.2.1.2.1.2. Spreadsheets
15.2.1.2.1.3. Presentations
15.2.1.2.1.4. Databases
15.2.1.2.1.5. Others
15.2.1.2.2. Team Collaboration
15.2.1.2.3. Time Tracking
15.2.1.2.4. Project Management
15.2.1.2.5. Content Creation
15.2.1.2.6. Others
15.2.1.3. Northeast Personal Productivity Software Market Revenue (US$
Mn) and Forecasts, By End Users
15.2.1.3.1. Leisure
15.2.1.3.2. Corporate
15.2.2. West
15.2.2.1. West Personal Productivity Software Market Revenue (US$ Mn)
and Forecasts, By Deployment Mode
15.2.2.1.1. Cloud Based
15.2.2.1.2. On Premise
15.2.2.2. West Personal Productivity Software Market Revenue (US$ Mn)
and Forecasts, By Application
15.2.2.2.1. Document Processing
15.2.2.2.1.1. Reports
15.2.2.2.1.2. Spreadsheets
15.2.2.2.1.3. Presentations
15.2.2.2.1.4. Databases
15.2.2.2.1.5. Others
15.2.2.2.2. Team Collaboration
15.2.2.2.3. Time Tracking
15.2.2.2.4. Project Management
15.2.2.2.5. Content Creation
15.2.2.2.6. Others
15.2.2.3. West Personal Productivity Software Market Revenue (US$ Mn)
and Forecasts, By End Users
15.2.2.3.1. Leisure
15.2.2.3.2. Corporate
15.2.3. South
15.2.3.1. South Personal Productivity Software Market Revenue (US$ Mn)
and Forecasts, By Deployment Mode
15.2.3.1.1. Cloud Based
15.2.3.1.2. On Premise
15.2.3.2. South Personal Productivity Software Market Revenue (US$ Mn)
and Forecasts, By Application
15.2.3.2.1. Document Processing
15.2.3.2.1.1. Reports
15.2.3.2.1.2. Spreadsheets
15.2.3.2.1.3. Presentations
15.2.3.2.1.4. Databases
15.2.3.2.1.5. Others
15.2.3.2.2. Team Collaboration
15.2.3.2.3. Time Tracking
15.2.3.2.4. Project Management
15.2.3.2.5. Content Creation
15.2.3.2.6. Others
15.2.3.3. South Personal Productivity Software Market Revenue (US$ Mn)
and Forecasts, By End Users
15.2.3.3.1. Leisure
15.2.3.3.2. Corporate
15.2.4. Midwest
15.2.4.1. Midwest Personal Productivity Software Market Revenue (US$ Mn)
and Forecasts, By Deployment Mode
15.2.4.1.1. Cloud Based
15.2.4.1.2. On Premise
15.2.4.2. Midwest Personal Productivity Software Market Revenue (US$ Mn)
and Forecasts, By Application
15.2.4.2.1. Document Processing
15.2.4.2.1.1. Reports
15.2.4.2.1.2. Spreadsheets
15.2.4.2.1.3. Presentations
15.2.4.2.1.4. Databases
15.2.4.2.1.5. Others
15.2.4.2.2. Team Collaboration
15.2.4.2.3. Time Tracking
15.2.4.2.4. Project Management
15.2.4.2.5. Content Creation
15.2.4.2.6. Others
15.2.4.3. Midwest Personal Productivity Software Market Revenue (US$ Mn)
and Forecasts, By End Users
15.2.4.3.1. Leisure
15.2.4.3.2. Corporate
16. Competitive Benchmarking
16.1. Brand
Benchmarking
16.2. Market
Share Analysis, 2018
16.3. Asia
Pacific Presence and Growth Strategies
16.3.1. Mergers
and Acquisitions
16.3.2. Product
Launches
16.3.3. Investments
Trends
16.3.4. R&D
Initiatives
17. Player Profiles
17.1. Adobe
17.1.1. Company
Details
17.1.2. Company
Overview
17.1.3. Product
Offerings
17.1.4. Key
Developments
17.1.5. Financial
Analysis
17.1.6. SWOT
Analysis
17.1.7. Business
Strategies
17.2. Atlassian
17.2.1. Company
Details
17.2.2. Company
Overview
17.2.3. Product
Offerings
17.2.4. Key
Developments
17.2.5. Financial
Analysis
17.2.6. SWOT
Analysis
17.2.7. Business
Strategies
17.3. Corel
Corporation
17.3.1. Company
Details
17.3.2. Company
Overview
17.3.3. Product
Offerings
17.3.4. Key
Developments
17.3.5. Financial
Analysis
17.3.6. SWOT
Analysis
17.3.7. Business
Strategies
17.4. Flock
FZ-LLC
17.4.1. Company
Details
17.4.2. Company
Overview
17.4.3. Product
Offerings
17.4.4. Key
Developments
17.4.5. Financial
Analysis
17.4.6. SWOT
Analysis
17.4.7. Business
Strategies
17.5. Google LLC
17.5.1. Company
Details
17.5.2. Company
Overview
17.5.3. Product
Offerings
17.5.4. Key
Developments
17.5.5. Financial
Analysis
17.5.6. SWOT
Analysis
17.5.7. Business
Strategies
17.6. Harvest
17.6.1. Company
Details
17.6.2. Company
Overview
17.6.3. Product
Offerings
17.6.4. Key
Developments
17.6.5. Financial
Analysis
17.6.6. SWOT
Analysis
17.6.7. Business
Strategies
17.7. HyperOffice
17.7.1. Company
Details
17.7.2. Company
Overview
17.7.3. Product
Offerings
17.7.4. Key
Developments
17.7.5. Financial
Analysis
17.7.6. SWOT
Analysis
17.7.7. Business
Strategies
17.8. Infraware
17.8.1. Company
Details
17.8.2. Company
Overview
17.8.3. Product
Offerings
17.8.4. Key
Developments
17.8.5. Financial
Analysis
17.8.6. SWOT
Analysis
17.8.7. Business
Strategies
17.9. Kingsoft
Office Software
17.9.1. Company
Details
17.9.2. Company
Overview
17.9.3. Product
Offerings
17.9.4. Key
Developments
17.9.5. Financial
Analysis
17.9.6. SWOT
Analysis
17.9.7. Business
Strategies
17.10. Memory
AS
17.10.1. Company
Details
17.10.2. Company
Overview
17.10.3. Product
Offerings
17.10.4. Key
Developments
17.10.5. Financial
Analysis
17.10.6. SWOT
Analysis
17.10.7. Business
Strategies
17.11. Microsoft
17.11.1. Company
Details
17.11.2. Company
Overview
17.11.3. Product
Offerings
17.11.4. Key
Developments
17.11.5. Financial
Analysis
17.11.6. SWOT
Analysis
17.11.7. Business
Strategies
17.12. Zoho
Corporation Pvt. Ltd.
17.12.1. Company
Details
17.12.2. Company
Overview
17.12.3. Product
Offerings
17.12.4. Key
Developments
17.12.5. Financial
Analysis
17.12.6. SWOT
Analysis
17.12.7. Business
Strategies
17.13. Other
Market Participants
18. Key Findings
Note: This ToC is tentative
and can be changed according to the research study conducted during the course
of report completion.
**Exclusive for Multi-User and
Enterprise User.
At Absolute Markets Insights, we are engaged in building both global as well as country specific reports. As a result, the approach taken for deriving the estimation and forecast for a specific country is a bit unique and different in comparison to the global research studies. In this case, we not only study the concerned market factors & trends prevailing in a particular country (from secondary research) but we also tend to calculate the actual market size & forecast from the revenue generated from the market participants involved in manufacturing or distributing the any concerned product. These companies can also be service providers. For analyzing any country specifically, we do consider the growth factors prevailing under the states/cities/county for the same. For instance, if we are analyzing an industry specific to United States, we primarily need to study about the states present under the same(where the product/service has the highest growth). Similar analysis will be followed by other countries. Our scope of the report changes with different markets.
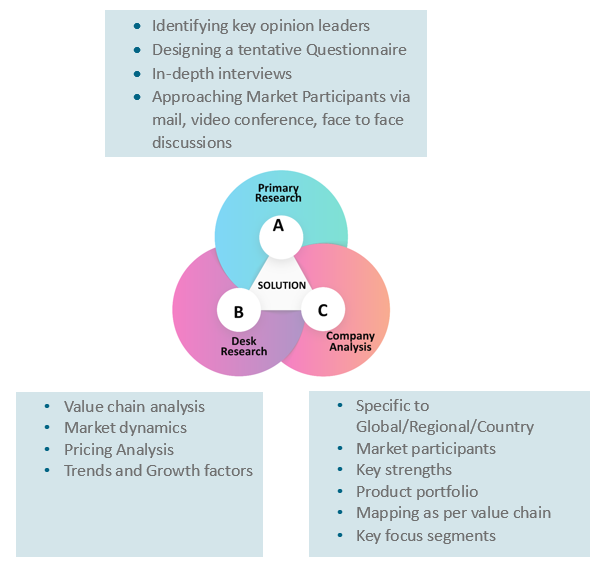
Our research study is mainly implement through a mix of both secondary and primary research. Various sources such as industry magazines, trade journals, and government websites and trade associations are reviewed for gathering precise data. Primary interviews are conducted to validate the market size derived from secondary research. Industry experts, major manufacturers and distributors are contacted for further validation purpose on the current market penetration and growth trends.
Prominent participants in our primary research process include:
- Key Opinion Leaders namely the CEOs, CSOs, VPs, purchasing managers, amongst others
- Research and development participants, distributors/suppliers and subject matter experts
Secondary Research includes data extracted from paid data sources:
- Reuters
- Factiva
- Bloomberg
- One Source
- Hoovers
Research Methodology
Key Inclusions
Why Absolute Markets Insights?
An effective strategy is the entity that influences a business to stand out of the crowd. An organization with a phenomenal strategy for success dependably has the edge over the rivals in the market. It offers the organizations a head start in planning their strategy. Absolute Market Insights is the new initiation in the industry that will furnish you with the lead your business needs. Absolute Market Insights is the best destination for your business intelligence and analytical solutions; essentially because our qualitative and quantitative sources of information are competent to give one-stop solutions. We inventively combine qualitative and quantitative research in accurate proportions to have the best report, which not only gives the most recent insights but also assists you to grow.


