
U.S. and Canada Marketing Dashboard Market, By Deployment (On-premise, Cloud); By Organization Size (SME, Large Enterprises); By License Type (Individual, Enterprise); By Industry Vertical (BFSI Products, Retail & E-commerce, Healthcare, Manufacturing, IT and Telecommunication, Transportation and Logistics, Travel and Hospitality, Others); By Country (U.S., Canada) – U.S., Canada Insights, Growth, Size, Comparative Analysis, Trends and Forecast, 2019 – 2027
Industry Trends
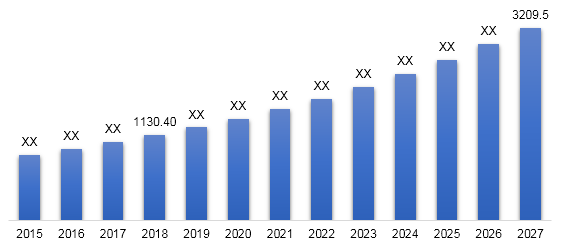
The U.S. and Canada marketing dashboard market revenue stood at US$ 1130.40 million in 2018 and is expected to reach US$ 3209.5 by 2027 expanding at a CAGR of 12.3% during the forecast period of 2019 - 2027.
The marketing dashboard is a graphical interface that enables the user to have an overview of their complete marketing strategy in a single view. Marketing dashboards provide a platform to users to easily read the key marketing metrics in a scientific way. It displays all the important information, such as KPIs, analytics, and metrics using data visualizations and helps the business to monitor and analyze its marketing effectiveness. Thus, the growing need among the organizations to enhance its return on marketing effectiveness in order to expand the customer base is driving the growth of U.S. and Canada marketing dashboard market. For instance, Datapine GmbH offers Google analytics connector, which consists of five different Google analytics dashboard templates, and provides proper customization in order to expand google analytics functionalities. The five dashboards templates increase the marketing effectiveness as it provides more flexibility to design, share and customize the data visualizations in comparison to traditional Google analytics dashboards.
Marketing dashboards are the marketing reports that are designed for continuous monitoring, provides a broad distribution of data that empowers the organization to drive and achieve their goals by understanding the facts of what is presently going on in the market domain. Additionally, the advantage of using marketing dashboards is that it provides a course correction on a daily, or hourly basis to an organization, which was not feasible in traditional monthly or quarterly reporting methods. The different types of marketing dashboards are marketing performance dashboard, digital marketing dashboard, SEO analytics dashboard, online marketing dashboard, web analytics dashboard, social media dashboard, Adwords campaign dashboard and email marketing dashboard amongst others. The marketing dashboards enables the marketer to understand the progress of their work and compare both forecasted goals and market trends. Thus, the growing need of organizations to obtain real time data and insights to facilitate efficient decision-making is propelling the growth of U.S. and Canada marketing dashboard market.
The marketing dashboards software is primarily deployed in two different modes, which includes cloud based deployment and on premise deployment. In 2018, on premise held the largest share in terms of revenue in the U.S. and Canada marketing dashboard market. However, cloud based deployment is anticipated to register the highest CAGR over the forecast period.
The organizations of multiple sizes implement marketing dashboards, which includes small and medium enterprises (SME) and large scale enterprises. Large scale enterprise is expected to hold the largest market share during the forecast period. The high adoption of marketing dashboards by large scale enterprises is attributed to the need for enhancement and upgrade of their large operations, which ultimately increases efficiency. However, small and medium enterprises in U.S. and Canada marketing dashboard market are anticipated to record the highest CAGR during the forecast period.
The industrial sectors which are predominantly implementing marketing dashboard in U.S. and Canada include BFSI, retail & e-commerce, healthcare, manufacturing, IT and telecommunication, transportation and logistics, travel and hospitality and other industrial sectors. Retail and e-commerce held the largest market share in 2018. Increasing the need of retail and e-commerce industrial sector to identify consumer patterns, improve stock management, a lower rate of returns in order to increase sales as along with profitability is a major factor contributing towards the growth of the segment, aiding towards the growth of U.S. and Canada marketing dashboard market. However, IT and telecommunications sector is expected to register highest CAGR during the forecast period. In 2018, U.S. held the largest share in marketing dashboard market, and is expected to register highest CAGR during forecast period. The highly developed industrial sectors, and presence of numerous large scale industries is leading to high adoption marketing dashboards software in the nation. Furthermore, the presence of key market players, such as Oracle, Microsoft, Tableau Software, Inc., and Sisense Inc. in the region is supporting the growth of marketing dashboard market.
U.S. and Canada Marketing Dashboard Market Revenue (US$ Million), 2015 - 2027
Competitive Landscape
The report provides both, qualitative and quantitative research of U.S. and Canada marketing dashboard market, as well as provides worthy insights into the rational scenario and favored development methods adopted by key contenders. The report also offers extensive research on the key players in U.S. and Canada marketing dashboard market and detailed insights on the competitiveness of these players. Key business strategies such as mergers and acquisitions (M&A), affiliations, collaborations, and contracts adopted by the major players are also recognized and analyzed in the report. For each company, the report recognizes their headquarters, competitors, product/service type, application and specification, pricing, and gross margin.
The primary market participants in the U.S. and Canada marketing dashboard market include Dundas Data Visualization, Inc., Klipfolio Inc., Sisense Inc., Tableau Software, Inc., Zoho Corporation Pvt. Ltd., Cyfe, Inc., Domo, Inc., Microsoft, Oracle, amongst others.

U.S. and Canada Marketing Dashboard Market
- By Deployment
- On-premise
- Cloud
- By Organization Size
- SME
- Large Enterprises
- By License Type
- Individual
- Enterprise
- By Industry Vertical
- BFSI
- Retail & E-commerce
- Healthcare
- Manufacturing
- IT and Telecommunication
- Transportation and Logistics
- Travel and Hospitality
- Others
- By Country
- U.S.
- Northwest
- Midwest
- West
- South
- Canada
- Ontario
- Quebec
- Nova Scotia
- New Brunswick
- Rest of Canada
- U.S.
Table of Contents
![]()
1. Market Scope
1.1. Market
Segmentation
1.2. Years
Considered
1.2.1. Historic
Years: 2013 - 2017
1.2.2. Base
Year: 2018
1.2.3. Forecast
Years: 2019 – 2027
2. Key Target Audiences
3. Research Methodology
3.1. Primary
Research
3.1.1. Research
Questionnaire
3.1.2. United
States Percentage Breakdown
3.1.3. Primary
Interviews: Key Opinion Leaders (KOLs)
3.2. Secondary
Research
3.2.1. Paid
Databases
3.2.2. Secondary
Sources
3.3. Market
Size Estimates
3.3.1. Top-Down
Approach
3.3.2. Bottom-Up
Approach
3.4. Data
Triangulation Methodology
3.5. Research
Assumptions
4. Recommendations and Insights from AMI’s Perspective**
5. Holistic Overview of Marketing Dashboard Market
6. Market Synopsis:
Marketing Dashboard Market
7. Marketing Dashboard Market Analysis: Qualitative Perspective
7.1. Introduction
7.1.1. Product
Definition
7.1.2. Industry
Development
7.2. Market
Dynamics
7.2.1. Drivers
7.2.2. Restraints
7.2.3. Opportunities
7.3. Trends in
Marketing Dashboard Market
7.4. Market
Determinants Radar Chart
7.5. Macro-Economic
and Micro-Economic Indicators: Marketing Dashboard Market
7.6. Porter’s
Five Force Analysis
8. United States Marketing Dashboard Market Analysis and
Forecasts, 2019 – 2027
8.1. Overview
8.1.1. United
States Marketing Dashboard Market Revenue (US$ Mn)
8.2. United
States Marketing Dashboard Market Revenue (US$ Mn) and Forecasts, By Deployment
8.2.1. On
Premise
8.2.1.1. Definition
8.2.1.2. Market
Penetration, 2018
8.2.1.3. Market
Estimation, 2013 – 2018
8.2.1.4. Market
Forecast, 2019 – 2027
8.2.1.5. Compound
Annual Growth Rate (CAGR)
8.2.1.6. Regional
Bifurcation
8.2.1.6.1. Northwest
8.2.1.6.1.1. Market
Estimation, 2013 – 2018
8.2.1.6.1.2. Market
Forecast, 2019 – 2027
8.2.1.6.2. Midwest
8.2.1.6.2.1. Market
Estimation, 2013 – 2018
8.2.1.6.2.2. Market
Forecast, 2019 – 2027
8.2.1.6.3. West
8.2.1.6.3.1. Market
Estimation, 2013 – 2018
8.2.1.6.3.2. Market
Forecast, 2019 – 2027
8.2.1.6.4. South
8.2.1.6.4.1. Market
Estimation, 2013 – 2018
8.2.1.6.4.2. Market
Forecast, 2019 – 2027
8.2.2. Cloud
8.2.2.1. Definition
8.2.2.2. Market
Penetration, 2018
8.2.2.3. Market
Estimation, 2013 – 2018
8.2.2.4. Market
Forecast, 2019 – 2027
8.2.2.5. Compound
Annual Growth Rate (CAGR)
8.2.2.6. Regional
Bifurcation
8.2.2.6.1. Northwest
8.2.2.6.1.1. Market
Estimation, 2013 – 2018
8.2.2.6.1.2. Market
Forecast, 2019 – 2027
8.2.2.6.2. Midwest
8.2.2.6.2.1. Market
Estimation, 2013 – 2018
8.2.2.6.2.2. Market
Forecast, 2019 – 2027
8.2.2.6.3. West
8.2.2.6.3.1. Market
Estimation, 2013 – 2018
8.2.2.6.3.2. Market
Forecast, 2019 – 2027
8.2.2.6.4. South
8.2.2.6.4.1. Market
Estimation, 2013 – 2018
8.2.2.6.4.2. Market
Forecast, 2019 – 2027
8.3. Key
Segment for Channeling Investments
8.3.1. By
Deployment
9. United States Marketing Dashboard Market Analysis and
Forecasts, 2019 – 2027
9.1. Overview
9.2. United
States Marketing Dashboard Market Revenue (US$ Mn) and Forecasts, By Organization Size
9.2.1. SME
9.2.1.1. Definition
9.2.1.2. Market
Penetration, 2018
9.2.1.3. Market
Estimation, 2013 – 2018
9.2.1.4. Market
Forecast, 2019 – 2027
9.2.1.5. Compound
Annual Growth Rate (CAGR)
9.2.1.6. Regional
Bifurcation
9.2.1.6.1. Northwest
9.2.1.6.1.1. Market
Estimation, 2013 – 2018
9.2.1.6.1.2. Market
Forecast, 2019 – 2027
9.2.1.6.2. Midwest
9.2.1.6.2.1. Market
Estimation, 2013 – 2018
9.2.1.6.2.2. Market
Forecast, 2019 – 2027
9.2.1.6.3. West
9.2.1.6.3.1. Market
Estimation, 2013 – 2018
9.2.1.6.3.2. Market
Forecast, 2019 – 2027
9.2.1.6.4. South
9.2.1.6.4.1. Market
Estimation, 2013 – 2018
9.2.1.6.4.2. Market
Forecast, 2019 – 2027
9.2.2. Large
Enterprises
9.2.2.1. Definition
9.2.2.2. Market
Penetration, 2018
9.2.2.3. Market
Estimation, 2013 – 2018
9.2.2.4. Market
Forecast, 2019 – 2027
9.2.2.5. Compound
Annual Growth Rate (CAGR)
9.2.2.6. Regional
Bifurcation
9.2.2.6.1. Northwest
9.2.2.6.1.1. Market
Estimation, 2013 – 2018
9.2.2.6.1.2. Market
Forecast, 2019 – 2027
9.2.2.6.2. Midwest
9.2.2.6.2.1. Market
Estimation, 2013 – 2018
9.2.2.6.2.2. Market
Forecast, 2019 – 2027
9.2.2.6.3. West
9.2.2.6.3.1. Market
Estimation, 2013 – 2018
9.2.2.6.3.2. Market
Forecast, 2019 – 2027
9.2.2.6.4. South
9.2.2.6.4.1. Market
Estimation, 2013 – 2018
9.2.2.6.4.2. Market
Forecast, 2019 – 2027
9.3. Key
Segment for Channeling Investments
9.3.1. By
Organization Size
10. United States Marketing Dashboard Market Analysis and
Forecasts, 2019 – 2027
10.1. Overview
10.2. United
States Marketing Dashboard Market Revenue (US$ Mn) and Forecasts, By License Type
10.2.1. Individual
10.2.1.1. Definition
10.2.1.2. Market
Penetration, 2018
10.2.1.3. Market
Estimation, 2013 – 2018
10.2.1.4. Market
Forecast, 2019 – 2027
10.2.1.5. Compound
Annual Growth Rate (CAGR)
10.2.1.6. Regional
Bifurcation
10.2.1.6.1. Northwest
10.2.1.6.1.1. Market
Estimation, 2013 – 2018
10.2.1.6.1.2. Market
Forecast, 2019 – 2027
10.2.1.6.2. Midwest
10.2.1.6.2.1. Market
Estimation, 2013 – 2018
10.2.1.6.2.2. Market
Forecast, 2019 – 2027
10.2.1.6.3. West
10.2.1.6.3.1. Market
Estimation, 2013 – 2018
10.2.1.6.3.2. Market
Forecast, 2019 – 2027
10.2.1.6.4. South
10.2.1.6.4.1. Market
Estimation, 2013 – 2018
10.2.1.6.4.2. Market
Forecast, 2019 – 2027
10.2.2. Enterprise
10.2.2.1. Definition
10.2.2.2. Market
Penetration, 2018
10.2.2.3. Market
Estimation, 2013 – 2018
10.2.2.4. Market
Forecast, 2019 – 2027
10.2.2.5. Compound
Annual Growth Rate (CAGR)
10.2.2.6. Regional
Bifurcation
10.2.2.6.1. Northwest
10.2.2.6.1.1. Market
Estimation, 2013 – 2018
10.2.2.6.1.2. Market
Forecast, 2019 – 2027
10.2.2.6.2. Midwest
10.2.2.6.2.1. Market
Estimation, 2013 – 2018
10.2.2.6.2.2. Market
Forecast, 2019 – 2027
10.2.2.6.3. West
10.2.2.6.3.1. Market
Estimation, 2013 – 2018
10.2.2.6.3.2. Market
Forecast, 2019 – 2027
10.2.2.6.4. South
10.2.2.6.4.1. Market
Estimation, 2013 – 2018
10.2.2.6.4.2. Market
Forecast, 2019 – 2027
10.3. Key
Segment for Channeling Investments
10.3.1. By
License Type
11. United States Marketing Dashboard Market Analysis and
Forecasts, 2019 – 2027
11.1. Overview
11.2. United
States Marketing Dashboard Market Revenue (US$ Mn) and Forecasts, By Industry Verticals
11.2.1. BFSI
11.2.1.1. Definition
11.2.1.2. Market
Penetration, 2018
11.2.1.3. Market
Estimation, 2013 – 2018
11.2.1.4. Market
Forecast, 2019 – 2027
11.2.1.5. Compound
Annual Growth Rate (CAGR)
11.2.1.6. Regional
Bifurcation
11.2.1.6.1. Northwest
11.2.1.6.1.1. Market
Estimation, 2013 – 2018
11.2.1.6.1.2. Market
Forecast, 2019 – 2027
11.2.1.6.2. Midwest
11.2.1.6.2.1. Market
Estimation, 2013 – 2018
11.2.1.6.2.2. Market
Forecast, 2019 – 2027
11.2.1.6.3. West
11.2.1.6.3.1. Market
Estimation, 2013 – 2018
11.2.1.6.3.2. Market
Forecast, 2019 – 2027
11.2.1.6.4. South
11.2.1.6.4.1. Market
Estimation, 2013 – 2018
11.2.1.6.4.2. Market
Forecast, 2019 – 2027
11.2.2. Retail
and Ecommerce
11.2.2.1. Definition
11.2.2.2. Market
Penetration, 2018
11.2.2.3. Market
Estimation, 2013 – 2018
11.2.2.4. Market
Forecast, 2019 – 2027
11.2.2.5. Compound
Annual Growth Rate (CAGR)
11.2.2.6. Regional
Bifurcation
11.2.2.6.1. Northwest
11.2.2.6.1.1. Market
Estimation, 2013 – 2018
11.2.2.6.1.2. Market
Forecast, 2019 – 2027
11.2.2.6.2. Midwest
11.2.2.6.2.1. Market
Estimation, 2013 – 2018
11.2.2.6.2.2. Market
Forecast, 2019 – 2027
11.2.2.6.3. West
11.2.2.6.3.1. Market
Estimation, 2013 – 2018
11.2.2.6.3.2. Market
Forecast, 2019 – 2027
11.2.2.6.4. South
11.2.2.6.4.1. Market
Estimation, 2013 – 2018
11.2.2.6.4.2. Market
Forecast, 2019 – 2027
11.2.3. Healthcare
11.2.3.1. Definition
11.2.3.2. Market
Penetration, 2018
11.2.3.3. Market
Estimation, 2013 – 2018
11.2.3.4. Market
Forecast, 2019 – 2027
11.2.3.5. Compound
Annual Growth Rate (CAGR)
11.2.3.6. Regional
Bifurcation
11.2.3.6.1. Northwest
11.2.3.6.1.1. Market
Estimation, 2013 – 2018
11.2.3.6.1.2. Market
Forecast, 2019 – 2027
11.2.3.6.2. Midwest
11.2.3.6.2.1. Market
Estimation, 2013 – 2018
11.2.3.6.2.2. Market
Forecast, 2019 – 2027
11.2.3.6.3. West
11.2.3.6.3.1. Market
Estimation, 2013 – 2018
11.2.3.6.3.2. Market
Forecast, 2019 – 2027
11.2.3.6.4. South
11.2.3.6.4.1. Market
Estimation, 2013 – 2018
11.2.3.6.4.2. Market
Forecast, 2019 – 2027
11.2.4. Manufacturing
11.2.4.1. Definition
11.2.4.2. Market
Penetration, 2018
11.2.4.3. Market
Estimation, 2013 – 2018
11.2.4.4. Market
Forecast, 2019 – 2027
11.2.4.5. Compound
Annual Growth Rate (CAGR)
11.2.4.6. Regional
Bifurcation
11.2.4.6.1. Northwest
11.2.4.6.1.1. Market
Estimation, 2013 – 2018
11.2.4.6.1.2. Market
Forecast, 2019 – 2027
11.2.4.6.2. Midwest
11.2.4.6.2.1. Market
Estimation, 2013 – 2018
11.2.4.6.2.2. Market
Forecast, 2019 – 2027
11.2.4.6.3. West
11.2.4.6.3.1. Market
Estimation, 2013 – 2018
11.2.4.6.3.2. Market
Forecast, 2019 – 2027
11.2.4.6.4. South
11.2.4.6.4.1. Market
Estimation, 2013 – 2018
11.2.4.6.4.2. Market
Forecast, 2019 – 2027
11.2.5. IT and
Telecommunication
11.2.5.1. Definition
11.2.5.2. Market
Penetration, 2018
11.2.5.3. Market
Estimation, 2013 – 2018
11.2.5.4. Market
Forecast, 2019 – 2027
11.2.5.5. Compound
Annual Growth Rate (CAGR)
11.2.5.6. Regional
Bifurcation
11.2.5.6.1. Northwest
11.2.5.6.1.1. Market
Estimation, 2013 – 2018
11.2.5.6.1.2. Market
Forecast, 2019 – 2027
11.2.5.6.2. Midwest
11.2.5.6.2.1. Market
Estimation, 2013 – 2018
11.2.5.6.2.2. Market
Forecast, 2019 – 2027
11.2.5.6.3. West
11.2.5.6.3.1. Market
Estimation, 2013 – 2018
11.2.5.6.3.2. Market
Forecast, 2019 – 2027
11.2.5.6.4. South
11.2.5.6.4.1. Market
Estimation, 2013 – 2018
11.2.5.6.4.2. Market
Forecast, 2019 – 2027
11.2.6. Transportation
and Logistics
11.2.6.1. Definition
11.2.6.2. Market
Penetration, 2018
11.2.6.3. Market
Estimation, 2013 – 2018
11.2.6.4. Market
Forecast, 2019 – 2027
11.2.6.5. Compound
Annual Growth Rate (CAGR)
11.2.6.6. Regional
Bifurcation
11.2.6.6.1. Northwest
11.2.6.6.1.1. Market
Estimation, 2013 – 2018
11.2.6.6.1.2. Market
Forecast, 2019 – 2027
11.2.6.6.2. Midwest
11.2.6.6.2.1. Market
Estimation, 2013 – 2018
11.2.6.6.2.2. Market
Forecast, 2019 – 2027
11.2.6.6.3. West
11.2.6.6.3.1. Market
Estimation, 2013 – 2018
11.2.6.6.3.2. Market
Forecast, 2019 – 2027
11.2.6.6.4. South
11.2.6.6.4.1. Market
Estimation, 2013 – 2018
11.2.6.6.4.2. Market
Forecast, 2019 – 2027
11.2.7. Travel
and Hospitality
11.2.7.1. Definition
11.2.7.2. Market
Penetration, 2018
11.2.7.3. Market
Estimation, 2013 – 2018
11.2.7.4. Market
Forecast, 2019 – 2027
11.2.7.5. Compound
Annual Growth Rate (CAGR)
11.2.7.6. Regional
Bifurcation
11.2.7.6.1. Northwest
11.2.7.6.1.1. Market
Estimation, 2013 – 2018
11.2.7.6.1.2. Market
Forecast, 2019 – 2027
11.2.7.6.2. Midwest
11.2.7.6.2.1. Market
Estimation, 2013 – 2018
11.2.7.6.2.2. Market
Forecast, 2019 – 2027
11.2.7.6.3. West
11.2.7.6.3.1. Market
Estimation, 2013 – 2018
11.2.7.6.3.2. Market
Forecast, 2019 – 2027
11.2.7.6.4. South
11.2.7.6.4.1. Market
Estimation, 2013 – 2018
11.2.7.6.4.2. Market
Forecast, 2019 – 2027
11.2.8. Others
11.2.8.1. Definition
11.2.8.2. Market
Penetration, 2018
11.2.8.3. Market
Estimation, 2013 – 2018
11.2.8.4. Market
Forecast, 2019 – 2027
11.2.8.5. Compound
Annual Growth Rate (CAGR)
11.2.8.6. Regional
Bifurcation
11.2.8.6.1. Northwest
11.2.8.6.1.1. Market
Estimation, 2013 – 2018
11.2.8.6.1.2. Market
Forecast, 2019 – 2027
11.2.8.6.2. Midwest
11.2.8.6.2.1. Market
Estimation, 2013 – 2018
11.2.8.6.2.2. Market
Forecast, 2019 – 2027
11.2.8.6.3. West
11.2.8.6.3.1. Market
Estimation, 2013 – 2018
11.2.8.6.3.2. Market
Forecast, 2019 – 2027
11.2.8.6.4. South
11.2.8.6.4.1. Market
Estimation, 2013 – 2018
11.2.8.6.4.2. Market
Forecast, 2019 – 2027
11.3. Key
Segment for Channeling Investments
11.3.1. By
Industry Verticals
12. United States Marketing Dashboard Market Analysis and
Forecasts, 2019 – 2027
12.1. Overview
12.2. United
States Marketing Dashboard Market Revenue (US$ Mn) and Forecasts, By Region
12.2.1. Northwest
12.2.1.1. Northwest
Marketing Dashboard Market Revenue (US$ Mn) and Forecasts, By Deployment
12.2.1.1.1. On
Premise
12.2.1.1.2. Cloud
12.2.1.2. Northwest
Marketing Dashboard Market Revenue (US$ Mn) and Forecasts, By Organization Size
12.2.1.2.1. SME
12.2.1.2.2. Large
Enterprises
12.2.1.3. Northwest
Marketing Dashboard Market Revenue (US$ Mn) and Forecasts, By License Type
12.2.1.3.1. Individual
12.2.1.3.2. Enterprise
12.2.1.4. Northwest
Marketing Dashboard Market Revenue (US$ Mn) and Forecasts, By Industry
Verticals
12.2.1.4.1. BFSI
12.2.1.4.2. Retail
and Ecommerce
12.2.1.4.3. Healthcare
12.2.1.4.4. Manufacturing
12.2.1.4.5. IT
and Telecommunication
12.2.1.4.6. Transportation
and Logistics
12.2.1.4.7. Travel
and Hospitality
12.2.1.4.8. Others
12.2.2. Midwest
12.2.2.1. Midwest
Marketing Dashboard Market Revenue (US$ Mn) and Forecasts, By Deployment
12.2.2.1.1. On
Premise
12.2.2.1.2. Cloud
12.2.2.2. Midwest
Marketing Dashboard Market Revenue (US$ Mn) and Forecasts, By Organization Size
12.2.2.2.1. SME
12.2.2.2.2. Large
Enterprises
12.2.2.3. Midwest
Marketing Dashboard Market Revenue (US$ Mn) and Forecasts, By License Type
12.2.2.3.1. Individual
12.2.2.3.2. Enterprise
12.2.2.4. Midwest
Marketing Dashboard Market Revenue (US$ Mn) and Forecasts, By Industry
Verticals
12.2.2.4.1. BFSI
12.2.2.4.2. Retail
and Ecommerce
12.2.2.4.3. Healthcare
12.2.2.4.4. Manufacturing
12.2.2.4.5. IT
and Telecommunication
12.2.2.4.6. Transportation
and Logistics
12.2.2.4.7. Travel
and Hospitality
12.2.2.4.8. Others
12.2.3. West
12.2.3.1. West
Marketing Dashboard Market Revenue (US$ Mn) and Forecasts, By Deployment
12.2.3.1.1. On
Premise
12.2.3.1.2. Cloud
12.2.3.2. West
Marketing Dashboard Market Revenue (US$ Mn) and Forecasts, By Organization Size
12.2.3.2.1. SME
12.2.3.2.2. Large
Enterprises
12.2.3.3. West
Marketing Dashboard Market Revenue (US$ Mn) and Forecasts, By License Type
12.2.3.3.1. Individual
12.2.3.3.2. Enterprise
12.2.3.4. West
Marketing Dashboard Market Revenue (US$ Mn) and Forecasts, By Industry Verticals
12.2.3.4.1. BFSI
12.2.3.4.2. Retail
and Ecommerce
12.2.3.4.3. Healthcare
12.2.3.4.4. Manufacturing
12.2.3.4.5. IT
and Telecommunication
12.2.3.4.6. Transportation
and Logistics
12.2.3.4.7. Travel
and Hospitality
12.2.3.4.8. Others
12.2.4. South
12.2.4.1. South
Marketing Dashboard Market Revenue (US$ Mn) and Forecasts, By Deployment
12.2.4.1.1. On
Premise
12.2.4.1.2. Cloud
12.2.4.2. South
Marketing Dashboard Market Revenue (US$ Mn) and Forecasts, By Organization Size
12.2.4.2.1. SME
12.2.4.2.2. Large
Enterprises
12.2.4.3. South
Marketing Dashboard Market Revenue (US$ Mn) and Forecasts, By License Type
12.2.4.3.1. Individual
12.2.4.3.2. Enterprise
12.2.4.4. South
Marketing Dashboard Market Revenue (US$ Mn) and Forecasts, By Industry
Verticals
12.2.4.4.1. BFSI
12.2.4.4.2. Retail
and Ecommerce
12.2.4.4.3. Healthcare
12.2.4.4.4. Manufacturing
12.2.4.4.5. IT
and Telecommunication
12.2.4.4.6. Transportation
and Logistics
12.2.4.4.7. Travel
and Hospitality
12.2.4.4.8. Others
13. Canada Marketing Dashboard Market Analysis and Forecasts,
2019 – 2027
13.1. Overview
13.1.1. Canada
Marketing Dashboard Market Revenue (US$ Mn)
13.2. Canada
Marketing Dashboard Market Revenue (US$ Mn) and
Forecasts, By Deployment
13.2.1. On
Premise
13.2.1.1. Market
Penetration, 2018
13.2.1.2. Market
Estimation, 2013 – 2018
13.2.1.3. Market
Forecast, 2019 – 2027
13.2.1.4. Compound
Annual Growth Rate (CAGR)
13.2.1.5. Regional
Bifurcation
13.2.1.5.1. Ontario
13.2.1.5.1.1. Market
Estimation, 2013 – 2018
13.2.1.5.1.2. Market
Forecast, 2019 – 2027
13.2.1.5.2. Quebec
13.2.1.5.2.1. Market
Estimation, 2013 – 2018
13.2.1.5.2.2. Market
Forecast, 2019 – 2027
13.2.1.5.3. Nova
Scotia
13.2.1.5.3.1. Market
Estimation, 2013 – 2018
13.2.1.5.3.2. Market
Forecast, 2019 – 2027
13.2.1.5.4. New
Brunswick
13.2.1.5.4.1. Market
Estimation, 2013 – 2018
13.2.1.5.4.2. Market
Forecast, 2019 – 2027
13.2.1.5.5. Rest
of Canada
13.2.1.5.5.1. Market
Estimation, 2013 – 2018
13.2.1.5.5.2. Market
Forecast, 2019 – 2027
13.2.2. Cloud
13.2.2.1. Market
Penetration, 2018
13.2.2.2. Market
Estimation, 2013 – 2018
13.2.2.3. Market
Forecast, 2019 – 2027
13.2.2.4. Compound
Annual Growth Rate (CAGR)
13.2.2.5. Regional
Bifurcation
13.2.2.5.1. Ontario
13.2.2.5.1.1. Market
Estimation, 2013 – 2018
13.2.2.5.1.2. Market
Forecast, 2019 – 2027
13.2.2.5.2. Quebec
13.2.2.5.2.1. Market
Estimation, 2013 – 2018
13.2.2.5.2.2. Market
Forecast, 2019 – 2027
13.2.2.5.3. Nova
Scotia
13.2.2.5.3.1. Market
Estimation, 2013 – 2018
13.2.2.5.3.2. Market
Forecast, 2019 – 2027
13.2.2.5.4. New
Brunswick
13.2.2.5.4.1. Market
Estimation, 2013 – 2018
13.2.2.5.4.2. Market
Forecast, 2019 – 2027
13.2.2.5.5. Rest
of Canada
13.2.2.5.5.1. Market
Estimation, 2013 – 2018
13.2.2.5.5.2. Market
Forecast, 2019 – 2027
13.3. Key
Segment for Channeling Investments
13.3.1. By
Deployment
14. Canada Marketing Dashboard Market Analysis and Forecasts, 2019
– 2027
14.1. Overview
14.2. Canada
Marketing Dashboard Market Revenue (US$ Mn) and
Forecasts, By Organization Size
14.2.1. SME
14.2.1.1. Market
Penetration, 2018
14.2.1.2. Market
Estimation, 2013 – 2018
14.2.1.3. Market
Forecast, 2019 – 2027
14.2.1.4. Compound
Annual Growth Rate (CAGR)
14.2.1.5. Regional
Bifurcation
14.2.1.5.1. Ontario
14.2.1.5.1.1. Market
Estimation, 2013 – 2018
14.2.1.5.1.2. Market
Forecast, 2019 – 2027
14.2.1.5.2. Quebec
14.2.1.5.2.1. Market
Estimation, 2013 – 2018
14.2.1.5.2.2. Market
Forecast, 2019 – 2027
14.2.1.5.3. Nova
Scotia
14.2.1.5.3.1. Market
Estimation, 2013 – 2018
14.2.1.5.3.2. Market
Forecast, 2019 – 2027
14.2.1.5.4. New
Brunswick
14.2.1.5.4.1. Market
Estimation, 2013 – 2018
14.2.1.5.4.2. Market
Forecast, 2019 – 2027
14.2.1.5.5. Rest
of Canada
14.2.1.5.5.1. Market
Estimation, 2013 – 2018
14.2.1.5.5.2. Market
Forecast, 2019 – 2027
14.2.2. Large
Enterprises
14.2.2.1. Market
Penetration, 2018
14.2.2.2. Market
Estimation, 2013 – 2018
14.2.2.3. Market
Forecast, 2019 – 2027
14.2.2.4. Compound
Annual Growth Rate (CAGR)
14.2.2.5. Regional
Bifurcation
14.2.2.5.1. Ontario
14.2.2.5.1.1. Market
Estimation, 2013 – 2018
14.2.2.5.1.2. Market
Forecast, 2019 – 2027
14.2.2.5.2. Quebec
14.2.2.5.2.1. Market
Estimation, 2013 – 2018
14.2.2.5.2.2. Market
Forecast, 2019 – 2027
14.2.2.5.3. Nova
Scotia
14.2.2.5.3.1. Market
Estimation, 2013 – 2018
14.2.2.5.3.2. Market
Forecast, 2019 – 2027
14.2.2.5.4. New
Brunswick
14.2.2.5.4.1. Market
Estimation, 2013 – 2018
14.2.2.5.4.2. Market
Forecast, 2019 – 2027
14.2.2.5.5. Rest
of Canada
14.2.2.5.5.1. Market
Estimation, 2013 – 2018
14.2.2.5.5.2. Market
Forecast, 2019 – 2027
14.3. Key
Segment for Channeling Investments
14.3.1. By
Organization Size
15. Canada Marketing Dashboard Market Analysis and Forecasts,
2019 – 2027
15.1. Overview
15.2. Canada
Marketing Dashboard Market Revenue (US$ Mn) and
Forecasts, By License Type
15.2.1. Individual
15.2.1.1. Market
Penetration, 2018
15.2.1.2. Market
Estimation, 2013 – 2018
15.2.1.3. Market
Forecast, 2019 – 2027
15.2.1.4. Compound
Annual Growth Rate (CAGR)
15.2.1.5. Regional
Bifurcation
15.2.1.5.1. Ontario
15.2.1.5.1.1. Market
Estimation, 2013 – 2018
15.2.1.5.1.2. Market
Forecast, 2019 – 2027
15.2.1.5.2. Quebec
15.2.1.5.2.1. Market
Estimation, 2013 – 2018
15.2.1.5.2.2. Market
Forecast, 2019 – 2027
15.2.1.5.3. Nova
Scotia
15.2.1.5.3.1. Market
Estimation, 2013 – 2018
15.2.1.5.3.2. Market
Forecast, 2019 – 2027
15.2.1.5.4. New
Brunswick
15.2.1.5.4.1. Market
Estimation, 2013 – 2018
15.2.1.5.4.2. Market
Forecast, 2019 – 2027
15.2.1.5.5. Rest
of Canada
15.2.1.5.5.1. Market
Estimation, 2013 – 2018
15.2.1.5.5.2. Market
Forecast, 2019 – 2027
15.2.2. Enterprise
15.2.2.1. Market
Penetration, 2018
15.2.2.2. Market
Estimation, 2013 – 2018
15.2.2.3. Market
Forecast, 2019 – 2027
15.2.2.4. Compound
Annual Growth Rate (CAGR)
15.2.2.5. Regional
Bifurcation
15.2.2.5.1. Ontario
15.2.2.5.1.1. Market
Estimation, 2013 – 2018
15.2.2.5.1.2. Market
Forecast, 2019 – 2027
15.2.2.5.2. Quebec
15.2.2.5.2.1. Market
Estimation, 2013 – 2018
15.2.2.5.2.2. Market
Forecast, 2019 – 2027
15.2.2.5.3. Nova
Scotia
15.2.2.5.3.1. Market
Estimation, 2013 – 2018
15.2.2.5.3.2. Market
Forecast, 2019 – 2027
15.2.2.5.4. New
Brunswick
15.2.2.5.4.1. Market
Estimation, 2013 – 2018
15.2.2.5.4.2. Market
Forecast, 2019 – 2027
15.2.2.5.5. Rest
of Canada
15.2.2.5.5.1. Market
Estimation, 2013 – 2018
15.2.2.5.5.2. Market
Forecast, 2019 – 2027
15.3. Key
Segment for Channeling Investments
15.3.1. By
License Type
16. Canada Marketing Dashboard Market Analysis and Forecasts,
2019 – 2027
16.1. Overview
16.2. Canada
Marketing Dashboard Market Revenue (US$ Mn) and
Forecasts, By Industry Verticals
16.2.1. BFSI
16.2.1.1. Market
Penetration, 2018
16.2.1.2. Market
Estimation, 2013 – 2018
16.2.1.3. Market
Forecast, 2019 – 2027
16.2.1.4. Compound
Annual Growth Rate (CAGR)
16.2.1.5. Regional
Bifurcation
16.2.1.5.1. Ontario
16.2.1.5.1.1. Market
Estimation, 2013 – 2018
16.2.1.5.1.2. Market
Forecast, 2019 – 2027
16.2.1.5.2. Quebec
16.2.1.5.2.1. Market
Estimation, 2013 – 2018
16.2.1.5.2.2. Market
Forecast, 2019 – 2027
16.2.1.5.3. Nova
Scotia
16.2.1.5.3.1. Market
Estimation, 2013 – 2018
16.2.1.5.3.2. Market
Forecast, 2019 – 2027
16.2.1.5.4. New
Brunswick
16.2.1.5.4.1. Market
Estimation, 2013 – 2018
16.2.1.5.4.2. Market
Forecast, 2019 – 2027
16.2.1.5.5. Rest
of Canada
16.2.1.5.5.1. Market
Estimation, 2013 – 2018
16.2.1.5.5.2. Market
Forecast, 2019 – 2027
16.2.2. Retail
and Ecommerce
16.2.2.1. Market
Penetration, 2018
16.2.2.2. Market
Estimation, 2013 – 2018
16.2.2.3. Market
Forecast, 2019 – 2027
16.2.2.4. Compound
Annual Growth Rate (CAGR)
16.2.2.5. Regional
Bifurcation
16.2.2.5.1. Ontario
16.2.2.5.1.1. Market
Estimation, 2013 – 2018
16.2.2.5.1.2. Market
Forecast, 2019 – 2027
16.2.2.5.2. Quebec
16.2.2.5.2.1. Market
Estimation, 2013 – 2018
16.2.2.5.2.2. Market
Forecast, 2019 – 2027
16.2.2.5.3. Nova
Scotia
16.2.2.5.3.1. Market
Estimation, 2013 – 2018
16.2.2.5.3.2. Market
Forecast, 2019 – 2027
16.2.2.5.4. New
Brunswick
16.2.2.5.4.1. Market
Estimation, 2013 – 2018
16.2.2.5.4.2. Market
Forecast, 2019 – 2027
16.2.2.5.5. Rest
of Canada
16.2.2.5.5.1. Market
Estimation, 2013 – 2018
16.2.2.5.5.2. Market
Forecast, 2019 – 2027
16.2.3. Healthcare
16.2.3.1. Market
Penetration, 2018
16.2.3.2. Market
Estimation, 2013 – 2018
16.2.3.3. Market
Forecast, 2019 – 2027
16.2.3.4. Compound
Annual Growth Rate (CAGR)
16.2.3.5. Regional
Bifurcation
16.2.3.5.1. Ontario
16.2.3.5.1.1. Market
Estimation, 2013 – 2018
16.2.3.5.1.2. Market
Forecast, 2019 – 2027
16.2.3.5.2. Quebec
16.2.3.5.2.1. Market
Estimation, 2013 – 2018
16.2.3.5.2.2. Market
Forecast, 2019 – 2027
16.2.3.5.3. Nova
Scotia
16.2.3.5.3.1. Market
Estimation, 2013 – 2018
16.2.3.5.3.2. Market
Forecast, 2019 – 2027
16.2.3.5.4. New
Brunswick
16.2.3.5.4.1. Market
Estimation, 2013 – 2018
16.2.3.5.4.2. Market
Forecast, 2019 – 2027
16.2.3.5.5. Rest
of Canada
16.2.3.5.5.1. Market
Estimation, 2013 – 2018
16.2.3.5.5.2. Market
Forecast, 2019 – 2027
16.2.4. Manufacturing
16.2.4.1. Market
Penetration, 2018
16.2.4.2. Market
Estimation, 2013 – 2018
16.2.4.3. Market
Forecast, 2019 – 2027
16.2.4.4. Compound
Annual Growth Rate (CAGR)
16.2.4.5. Regional
Bifurcation
16.2.4.5.1. Ontario
16.2.4.5.1.1. Market
Estimation, 2013 – 2018
16.2.4.5.1.2. Market
Forecast, 2019 – 2027
16.2.4.5.2. Quebec
16.2.4.5.2.1. Market
Estimation, 2013 – 2018
16.2.4.5.2.2. Market
Forecast, 2019 – 2027
16.2.4.5.3. Nova
Scotia
16.2.4.5.3.1. Market
Estimation, 2013 – 2018
16.2.4.5.3.2. Market
Forecast, 2019 – 2027
16.2.4.5.4. New
Brunswick
16.2.4.5.4.1. Market
Estimation, 2013 – 2018
16.2.4.5.4.2. Market
Forecast, 2019 – 2027
16.2.4.5.5. Rest
of Canada
16.2.4.5.5.1. Market
Estimation, 2013 – 2018
16.2.4.5.5.2. Market
Forecast, 2019 – 2027
16.2.5. IT and
Telecommunication
16.2.5.1. Market
Penetration, 2018
16.2.5.2. Market
Estimation, 2013 – 2018
16.2.5.3. Market
Forecast, 2019 – 2027
16.2.5.4. Compound
Annual Growth Rate (CAGR)
16.2.5.5. Regional
Bifurcation
16.2.5.5.1. Ontario
16.2.5.5.1.1. Market
Estimation, 2013 – 2018
16.2.5.5.1.2. Market
Forecast, 2019 – 2027
16.2.5.5.2. Quebec
16.2.5.5.2.1. Market
Estimation, 2013 – 2018
16.2.5.5.2.2. Market
Forecast, 2019 – 2027
16.2.5.5.3. Nova
Scotia
16.2.5.5.3.1. Market
Estimation, 2013 – 2018
16.2.5.5.3.2. Market
Forecast, 2019 – 2027
16.2.5.5.4. New
Brunswick
16.2.5.5.4.1. Market
Estimation, 2013 – 2018
16.2.5.5.4.2. Market
Forecast, 2019 – 2027
16.2.5.5.5. Rest
of Canada
16.2.5.5.5.1. Market
Estimation, 2013 – 2018
16.2.5.5.5.2. Market
Forecast, 2019 – 2027
16.2.6. Transportation
and Logistics
16.2.6.1. Market
Penetration, 2018
16.2.6.2. Market
Estimation, 2013 – 2018
16.2.6.3. Market
Forecast, 2019 – 2027
16.2.6.4. Compound
Annual Growth Rate (CAGR)
16.2.6.5. Regional
Bifurcation
16.2.6.5.1. Ontario
16.2.6.5.1.1. Market
Estimation, 2013 – 2018
16.2.6.5.1.2. Market
Forecast, 2019 – 2027
16.2.6.5.2. Quebec
16.2.6.5.2.1. Market
Estimation, 2013 – 2018
16.2.6.5.2.2. Market
Forecast, 2019 – 2027
16.2.6.5.3. Nova
Scotia
16.2.6.5.3.1. Market
Estimation, 2013 – 2018
16.2.6.5.3.2. Market
Forecast, 2019 – 2027
16.2.6.5.4. New
Brunswick
16.2.6.5.4.1. Market
Estimation, 2013 – 2018
16.2.6.5.4.2. Market
Forecast, 2019 – 2027
16.2.6.5.5. Rest
of Canada
16.2.6.5.5.1. Market
Estimation, 2013 – 2018
16.2.6.5.5.2. Market
Forecast, 2019 – 2027
16.2.7. Travel
and Hospitality
16.2.7.1. Market
Penetration, 2018
16.2.7.2. Market
Estimation, 2013 – 2018
16.2.7.3. Market
Forecast, 2019 – 2027
16.2.7.4. Compound
Annual Growth Rate (CAGR)
16.2.7.5. Regional
Bifurcation
16.2.7.5.1. Ontario
16.2.7.5.1.1. Market
Estimation, 2013 – 2018
16.2.7.5.1.2. Market
Forecast, 2019 – 2027
16.2.7.5.2. Quebec
16.2.7.5.2.1. Market
Estimation, 2013 – 2018
16.2.7.5.2.2. Market
Forecast, 2019 – 2027
16.2.7.5.3. Nova
Scotia
16.2.7.5.3.1. Market
Estimation, 2013 – 2018
16.2.7.5.3.2. Market
Forecast, 2019 – 2027
16.2.7.5.4. New
Brunswick
16.2.7.5.4.1. Market
Estimation, 2013 – 2018
16.2.7.5.4.2. Market
Forecast, 2019 – 2027
16.2.7.5.5. Rest
of Canada
16.2.7.5.5.1. Market
Estimation, 2013 – 2018
16.2.7.5.5.2. Market
Forecast, 2019 – 2027
16.2.8. Others
16.2.8.1. Market
Penetration, 2018
16.2.8.2. Market
Estimation, 2013 – 2018
16.2.8.3. Market
Forecast, 2019 – 2027
16.2.8.4. Compound
Annual Growth Rate (CAGR)
16.2.8.5. Regional
Bifurcation
16.2.8.5.1. Ontario
16.2.8.5.1.1. Market
Estimation, 2013 – 2018
16.2.8.5.1.2. Market
Forecast, 2019 – 2027
16.2.8.5.2. Quebec
16.2.8.5.2.1. Market
Estimation, 2013 – 2018
16.2.8.5.2.2. Market
Forecast, 2019 – 2027
16.2.8.5.3. Nova
Scotia
16.2.8.5.3.1. Market
Estimation, 2013 – 2018
16.2.8.5.3.2. Market
Forecast, 2019 – 2027
16.2.8.5.4. New
Brunswick
16.2.8.5.4.1. Market
Estimation, 2013 – 2018
16.2.8.5.4.2. Market
Forecast, 2019 – 2027
16.2.8.5.5. Rest
of Canada
16.2.8.5.5.1. Market
Estimation, 2013 – 2018
16.2.8.5.5.2. Market
Forecast, 2019 – 2027
16.3. Key
Segment for Channeling Investments
16.3.1. By
Industry Verticals
17. Canada Marketing Dashboard Market Analysis and Forecasts,
2019 – 2027
17.1. Overview
17.2. Canada
Marketing Dashboard Market Revenue (US$ Mn) and Forecasts, By Region
17.2.1. Ontario
17.2.1.1. Ontario
Marketing Dashboard Market Revenue (US$ Mn) and Forecasts, By Deployment
17.2.1.1.1. On
Premise
17.2.1.1.2. Cloud
17.2.1.2. Ontario
Marketing Dashboard Market Revenue (US$ Mn) and Forecasts, By Organization Size
17.2.1.2.1. SME
17.2.1.2.2. Large
Enterprises
17.2.1.3. Ontario
Marketing Dashboard Market Revenue (US$ Mn) and Forecasts, By License Type
17.2.1.3.1. Individual
17.2.1.3.2. Enterprise
17.2.1.4. Ontario
Marketing Dashboard Market Revenue (US$ Mn) and Forecasts, By Industry
Verticals
17.2.1.4.1. BFSI
17.2.1.4.2. Retail
and Ecommerce
17.2.1.4.3. Healthcare
17.2.1.4.4. Manufacturing
17.2.1.4.5. IT
and Telecommunication
17.2.1.4.6. Transportation
and Logistics
17.2.1.4.7. Travel
and Hospitality
17.2.1.4.8. Others
17.2.2. Quebec
17.2.2.1. Quebec
Marketing Dashboard Market Revenue (US$ Mn) and Forecasts, By Deployment
17.2.2.1.1. On
Premise
17.2.2.1.2. Cloud
17.2.2.2. Quebec
Marketing Dashboard Market Revenue (US$ Mn) and Forecasts, By Organization Size
17.2.2.2.1. SME
17.2.2.2.2. Large
Enterprises
17.2.2.3. Quebec
Marketing Dashboard Market Revenue (US$ Mn) and Forecasts, By License Type
17.2.2.3.1. Individual
17.2.2.3.2. Enterprise
17.2.2.4. Quebec
Marketing Dashboard Market Revenue (US$ Mn) and Forecasts, By Industry
Verticals
17.2.2.4.1. BFSI
17.2.2.4.2. Retail
and Ecommerce
17.2.2.4.3. Healthcare
17.2.2.4.4. Manufacturing
17.2.2.4.5. IT
and Telecommunication
17.2.2.4.6. Transportation
and Logistics
17.2.2.4.7. Travel
and Hospitality
17.2.2.4.8. Others
17.2.3. Nova
Scotia
17.2.3.1. Nova
Scotia Marketing Dashboard Market Revenue (US$ Mn) and Forecasts, By Deployment
17.2.3.1.1. On
Premise
17.2.3.1.2. Cloud
17.2.3.2. Nova
Scotia Marketing Dashboard Market Revenue (US$ Mn) and Forecasts, By
Organization Size
17.2.3.2.1. SME
17.2.3.2.2. Large
Enterprises
17.2.3.3. Nova
Scotia Marketing Dashboard Market Revenue (US$ Mn) and Forecasts, By License
Type
17.2.3.3.1. Individual
17.2.3.3.2. Enterprise
17.2.3.4. Nova
Scotia Marketing Dashboard Market Revenue (US$ Mn) and Forecasts, By Industry
Verticals
17.2.3.4.1. BFSI
17.2.3.4.2. Retail
and Ecommerce
17.2.3.4.3. Healthcare
17.2.3.4.4. Manufacturing
17.2.3.4.5. IT
and Telecommunication
17.2.3.4.6. Transportation
and Logistics
17.2.3.4.7. Travel
and Hospitality
17.2.3.4.8. Others
17.2.4. New
Brunswick
17.2.4.1. New
Brunswick Marketing Dashboard Market Revenue (US$ Mn) and Forecasts, By
Deployment
17.2.4.1.1. On
Premise
17.2.4.1.2. Cloud
17.2.4.2. New
Brunswick Marketing Dashboard Market Revenue (US$ Mn) and Forecasts, By
Organization Size
17.2.4.2.1. SME
17.2.4.2.2. Large
Enterprises
17.2.4.3. New
Brunswick Marketing Dashboard Market Revenue (US$ Mn) and Forecasts, By License
Type
17.2.4.3.1. Individual
17.2.4.3.2. Enterprise
17.2.4.4. New
Brunswick Marketing Dashboard Market Revenue (US$ Mn) and Forecasts, By
Industry Verticals
17.2.4.4.1. BFSI
17.2.4.4.2. Retail
and Ecommerce
17.2.4.4.3. Healthcare
17.2.4.4.4. Manufacturing
17.2.4.4.5. IT
and Telecommunication
17.2.4.4.6. Transportation
and Logistics
17.2.4.4.7. Travel
and Hospitality
17.2.4.4.8. Others
17.2.5. Rest of
Canada
17.2.5.1. Rest
of Canada Marketing Dashboard Market Revenue (US$ Mn) and Forecasts, By
Deployment
17.2.5.1.1. On
Premise
17.2.5.1.2. Cloud
17.2.5.2. Rest
of Canada Marketing Dashboard Market Revenue (US$ Mn) and Forecasts, By
Organization Size
17.2.5.2.1. SME
17.2.5.2.2. Large
Enterprises
17.2.5.3. Rest
of Canada Marketing Dashboard Market Revenue (US$ Mn) and Forecasts, By License
Type
17.2.5.3.1. Individual
17.2.5.3.2. Enterprise
17.2.5.4. Rest
of Canada Marketing Dashboard Market Revenue (US$ Mn) and Forecasts, By
Industry Verticals
17.2.5.4.1. BFSI
17.2.5.4.2. Retail
and Ecommerce
17.2.5.4.3. Healthcare
17.2.5.4.4. Manufacturing
17.2.5.4.5. IT
and Telecommunication
17.2.5.4.6. Transportation
and Logistics
17.2.5.4.7. Travel
and Hospitality
17.2.5.4.8. Others
18. Competitive Benchmarking
18.1. Market
Share Analysis, 2018
18.2. United
States & Canada Presence and Growth Strategies
18.2.1. Mergers
and Acquisitions
18.2.2. Product
Launches
18.2.3. Investments
Trends
18.2.4. R&D
Initiatives
19. Player Profiles
19.1. Cyfe,
Inc.
19.1.1. Company
Details
19.1.2. Company
Overview
19.1.3. Product
Offerings
19.1.4. Key
Developments
19.1.5. Financial
Analysis
19.1.6. SWOT
Analysis
19.1.7. Business
Strategies
19.2. Domo,
Inc.
19.2.1. Company
Details
19.2.2. Company
Overview
19.2.3. Product
Offerings
19.2.4. Key
Developments
19.2.5. Financial
Analysis
19.2.6. SWOT
Analysis
19.2.7. Business
Strategies
19.3. Dundas
Data Visualization, Inc.
19.3.1. Company
Details
19.3.2. Company
Overview
19.3.3. Product
Offerings
19.3.4. Key
Developments
19.3.5. Financial
Analysis
19.3.6. SWOT
Analysis
19.3.7. Business
Strategies
19.4. Klipfolio
Inc.
19.4.1. Company
Details
19.4.2. Company
Overview
19.4.3. Product
Offerings
19.4.4. Key
Developments
19.4.5. Financial
Analysis
19.4.6. SWOT
Analysis
19.4.7. Business
Strategies
19.5. Microsoft
19.5.1. Company
Details
19.5.2. Company
Overview
19.5.3. Product
Offerings
19.5.4. Key
Developments
19.5.5. Financial
Analysis
19.5.6. SWOT
Analysis
19.5.7. Business
Strategies
19.6. Oracle
19.6.1. Company
Details
19.6.2. Company
Overview
19.6.3. Product
Offerings
19.6.4. Key
Developments
19.6.5. Financial
Analysis
19.6.6. SWOT Analysis
19.6.7. Business
Strategies
19.7. Sisense
Inc.
19.7.1. Company
Details
19.7.2. Company
Overview
19.7.3. Product
Offerings
19.7.4. Key
Developments
19.7.5. Financial
Analysis
19.7.6. SWOT
Analysis
19.7.7. Business
Strategies
19.8. Tableau
Software, Inc.
19.8.1. Company
Details
19.8.2. Company
Overview
19.8.3. Product
Offerings
19.8.4. Key
Developments
19.8.5. Financial
Analysis
19.8.6. SWOT
Analysis
19.8.7. Business
Strategies
19.9. Zoho
Corporation Pvt. Ltd.
19.9.1. Company
Details
19.9.2. Company
Overview
19.9.3. Product
Offerings
19.9.4. Key
Developments
19.9.5. Financial
Analysis
19.9.6. SWOT
Analysis
19.9.7. Business
Strategies
19.10. Other
Market Participants
20. Key Findings
Note: This ToC is tentative
and can be changed according to the research study conducted during the course
of report completion.
**Exclusive for Multi-User and
Enterprise User
At Absolute Markets Insights, we are engaged in building both global as well as country specific reports. As a result, the approach taken for deriving the estimation and forecast for a specific country is a bit unique and different in comparison to the global research studies. In this case, we not only study the concerned market factors & trends prevailing in a particular country (from secondary research) but we also tend to calculate the actual market size & forecast from the revenue generated from the market participants involved in manufacturing or distributing the any concerned product. These companies can also be service providers. For analyzing any country specifically, we do consider the growth factors prevailing under the states/cities/county for the same. For instance, if we are analyzing an industry specific to United States, we primarily need to study about the states present under the same(where the product/service has the highest growth). Similar analysis will be followed by other countries. Our scope of the report changes with different markets.
Our research study is mainly implement through a mix of both secondary and primary research. Various sources such as industry magazines, trade journals, and government websites and trade associations are reviewed for gathering precise data. Primary interviews are conducted to validate the market size derived from secondary research. Industry experts, major manufacturers and distributors are contacted for further validation purpose on the current market penetration and growth trends.
Prominent participants in our primary research process include:
- Key Opinion Leaders namely the CEOs, CSOs, VPs, purchasing managers, amongst others
- Research and development participants, distributors/suppliers and subject matter experts
Secondary Research includes data extracted from paid data sources:
- Reuters
- Factiva
- Bloomberg
- One Source
- Hoovers
Research Methodology

Key Inclusions


