
Visitor Identification Software Market by Pricing Model (Fixed Pricing, Variable Pricing); by Enterprise Size (Small and Medium Enterprises, Large Enterprise); by Industry Verticals (Banking Financial Services and Insurances, IT and Telecom, Consumer Durables and Electronics, Travel and Hospitality, Automotive, Others); By Region (West, Southwest, Northeast, Southeast, Midwest) – United States Insights, Growth, Size, Comparative Analysis, Trends and Forecast, 2019 – 2027
Industry Trends
Digitization being one of the major trends in all sectors, various methods are being adopted to change the traditional approach of work. Visitor identification software market is witnessing a robust technological advancement with an aim to provide enhanced user experience. The software is used by various organizations to keep a track of any anonymous visitors who could possibly have access to their website and it also comprehensively profiles them along with analyzing the website traffic. The software offers integration with wide range of sales and marketing applications such as CRM, marketing automation, email marketing and others to accelerate the sales cycle by automating email drip campaigns for lead generation and lead nurture programs. Automation of filters such as blocking ISPs, bots and poor sales prospects which refines the automatic settings to match the business goals are few of the other features offered by the software. Lead scoring, data exports, lead routing to different users/department, branding or white labeling, campaign tracking, among other factors are driving the adoption of visitor identification software market.
Visitor identification software market is bifurcated on the basis of pricing model into fixed pricing model and variable pricing model. The pricing model varies based on the organizations’ sizes (SME’S/large). Fixed pricing is preferred by the companies with significant customer base, as it helps them to narrow down a specific number of customers along with the ability to allocate budgets for purchasing these services. For instance, Clearbit offers flexible pricing with different tools and APIs specifically for small and medium enterprises. The pricing is based on CRM database size, monthly web traffic, number of monthly contacts and how many products to include. Whereas, variable pricing helps market participants to target emerging enterprises with growing customer bases such that the number of leads provided are directly correlated to the price being paid by these enterprises. With the implementation of this software, business receive real time lead alerts and enables them in lead management. Some of the features this software include basic analytics i.e. IP-address tracking, number of visits, session durations and much more about users browsing the website. Such factors are aiding for the growth of visitor identification software market.
Integration of machine learning solutions in visitor identification software is facilitating various enterprises to adequately analyze website behaviors of the visitors. This functionality mainly provides information on comparison reports of time spent on site and average pages viewed for those who have viewed the recommendations vs. those who have not. Machine learning helps to track website behaviors and automatically provide content recommendations based on those behaviors. For instance, Act-On Software, Inc. uses machine learning under adaptive web solutions with an aim to track visitor behavior and provide content recommendations automatically on those behaviors. This integration enables marketers with personalized content recommendations. The use of visitor identification software allows organizations to understand the presence of potential customers along with the type of customers who are showing particular interest towards the company’s offerings, which in turn is further propelling the visitor identification software market.
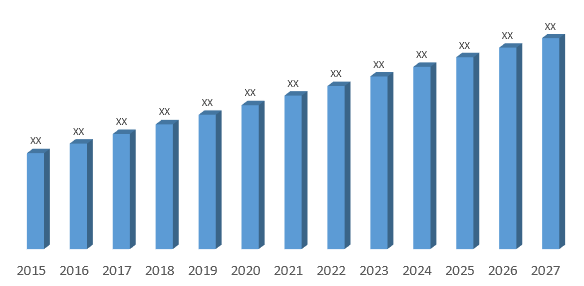
Various industries make use of this software including banking, financial services & insurance, telecom, consumer durables & electronics, travel & hospitality, amongst others. The consumer durables and electronics accounted for the major share in 2018. This is primarily due to the awareness amongst users with respect to online portals for gaining product or service information as opposed to offline associations or portals which provide similar information to users. The visitor identification software automatically identifies and sorts leads by picking out the highest-value prospects for a sales team to engage. This software is ideal for B2B selling because of the way the software works as it delivers sales representatives with the missing data from site visitors, which is important to convert them into a lead. Marketers use the visitor identification software for better targeting the website visitors with content. In terms of revenue, United States visitor identification software market was valued at US$ 711.84 Mn in 2019 and is anticipated to reach US$ 2235.76 Mn by 2027, growing at a CAGR of 15.38% from 2019 to 2027.
Visitor Identification Software Market Revenue & Forecast, (US$ Million), 2015 – 2027
Competitive Landscape
The report provides both, qualitative and quantitative research of visitor identification software market, as well as provides comprehensive insights and development methods adopted by the key contenders. The report also offers extensive research on the key players in this market and details on the competitiveness of these players. Key business strategies such as mergers and acquisitions (M&A), affiliations, collaborations, and contracts adopted by these major market participants are also recognized and analyzed in the report. For each company, the report studies their global presence, competitors, service offerings and specification amongst others.
Some of the players operating in the U.S. visitor identification software market are, Act-On Software, Inc., Zoho Corporation Pvt. Ltd., KickFire, Clearbit, netFactor (bombora), SHARPSPRING, Upland Software, Inc., Lead Forensics and Liidio Oy (leadfeeder) amongst others.

Visitor Identification Software Market:
- By Enterprise Size
- Small and Medium Enterprise
- Large Enterprise
- By Pricing Model
- Fixed Pricing
- Variable Pricing
- By Organization Size
- Small and Medium Sized Enterprises
- Large Enterprises
- By Industry Verticals
- Banking Financial Services and Insurances
- IT and Telecom
- Consumer Durables and Electronics
- Travel and Hospitality
- Automotive
- Others
- By Region
- West
- Southwest
- Northeast
- Southeast
- Midwest
Table of Contents
![]()
1.
Market Scope
1.1. Market
Segmentation
1.2. Years
Considered
1.2.1. Historic
Years: 2013 - 2017
1.2.2. Base
Year: 2018
1.2.3. Forecast
Years: 2019 – 2027
2.
Key Target Audiences
3.
Research Methodology
3.1. Primary
Research
3.1.1. Research
Questionnaire
3.1.2. United
States Percentage Breakdown
3.1.3. Primary
Interviews: Key Opinion Leaders (KOLs)
3.2. Secondary
Research
3.2.1. Paid
Databases
3.2.2. Secondary
Sources
3.3. Market
Size Estimates
3.3.1. Top-Down
Approach
3.3.2. Bottom-Up
Approach
3.4. Data
Triangulation Methodology
3.5. Research
Assumptions
4.
Recommendations and
Insights from AMI’s Perspective**
5.
Holistic Overview of
Visitor Identification Software Market
6.
Market Synopsis: Visitor Identification Software Market
7.
Visitor Identification
Software Market Analysis: Qualitative Perspective
7.1. Introduction
7.1.1. Product
Definition
7.1.2. Industry
Development
7.2. Market
Dynamics
7.2.1. Drivers
7.2.2. Restraints
7.2.3. Opportunities
7.3. Trends in
Visitor Identification Software Market
7.4. Market
Determinants Radar Chart
7.5. Macro-Economic
and Micro-Economic Indicators: Visitor Identification Software Market
7.6. Porter’s
Five Force Analysis
8.
United States Visitor
Identification Software Market Analysis and Forecasts, 2019 – 2027
8.1. Overview
8.1.1. United
States Visitor Identification Software Market Revenue (US$ Mn)
8.2. United
States Visitor Identification Software Market Revenue (US$ Mn) and Forecasts, By Pricing Model
8.2.1. Fixed
Pricing
8.2.1.1. Definition
8.2.1.2. Market Penetration, 2018
8.2.1.3. Market Estimation, 2013 – 2018
8.2.1.4. Market Forecast, 2019 – 2027
8.2.1.5. Compound Annual Growth Rate (CAGR)
8.2.1.6. Regional Bifurcation
8.2.1.6.1. West
8.2.1.6.1.1. Market
Estimation, 2013 – 2018
8.2.1.6.1.2. Market
Forecast, 2019 – 2027
8.2.1.6.2. Southwest
8.2.1.6.2.1. Market
Estimation, 2013 – 2018
8.2.1.6.2.2. Market
Forecast, 2019 – 2027
8.2.1.6.3. Northeast
8.2.1.6.3.1. Market
Estimation, 2013 – 2018
8.2.1.6.3.2. Market
Forecast, 2019 – 2027
8.2.1.6.4. Southeast
8.2.1.6.4.1. Market
Estimation, 2013 – 2018
8.2.1.6.4.2. Market
Forecast, 2019 – 2027
8.2.1.6.5. Midwest
8.2.1.6.5.1. Market
Estimation, 2013 – 2018
8.2.1.6.5.2. Market
Forecast, 2019 – 2027
8.2.2. Variable
Pricing
8.2.2.1. Definition
8.2.2.2. Market Penetration, 2018
8.2.2.3. Market Estimation, 2013 – 2018
8.2.2.4. Market Forecast, 2019 – 2027
8.2.2.5. Compound Annual Growth Rate (CAGR)
8.2.2.6. Regional Bifurcation
8.2.2.6.1. West
8.2.2.6.1.1. Market
Estimation, 2013 – 2018
8.2.2.6.1.2. Market
Forecast, 2019 – 2027
8.2.2.6.2. Southwest
8.2.2.6.2.1. Market
Estimation, 2013 – 2018
8.2.2.6.2.2. Market
Forecast, 2019 – 2027
8.2.2.6.3. Northeast
8.2.2.6.3.1. Market
Estimation, 2013 – 2018
8.2.2.6.3.2. Market
Forecast, 2019 – 2027
8.2.2.6.4. Southeast
8.2.2.6.4.1. Market
Estimation, 2013 – 2018
8.2.2.6.4.2. Market
Forecast, 2019 – 2027
8.2.2.6.5. Midwest
8.2.2.6.5.1. Market
Estimation, 2013 – 2018
8.2.2.6.5.2. Market
Forecast, 2019 – 2027
8.3. Key
Segment for Channeling Investments
8.3.1. By
Pricing Model
9.
United States Visitor
Identification Software Market Analysis and Forecasts, 2019 – 2027
9.1. Overview
9.2. United
States Visitor Identification Software Market Revenue (US$ Mn) and Forecasts, By Organization Size
9.2.1. Small
and Medium Sized Enterprises
9.2.1.1. Definition
9.2.1.2. Market Penetration, 2018
9.2.1.3. Market Estimation, 2013 – 2018
9.2.1.4. Market Forecast, 2019 – 2027
9.2.1.5. Compound Annual Growth Rate (CAGR)
9.2.1.6. Regional Bifurcation
9.2.1.6.1. West
9.2.1.6.1.1. Market
Estimation, 2013 – 2018
9.2.1.6.1.2. Market
Forecast, 2019 – 2027
9.2.1.6.2. Southwest
9.2.1.6.2.1. Market
Estimation, 2013 – 2018
9.2.1.6.2.2. Market
Forecast, 2019 – 2027
9.2.1.6.3. Northeast
9.2.1.6.3.1. Market
Estimation, 2013 – 2018
9.2.1.6.3.2. Market
Forecast, 2019 – 2027
9.2.1.6.4. Southeast
9.2.1.6.4.1. Market
Estimation, 2013 – 2018
9.2.1.6.4.2. Market
Forecast, 2019 – 2027
9.2.1.6.5. Midwest
9.2.1.6.5.1. Market
Estimation, 2013 – 2018
9.2.1.6.5.2. Market
Forecast, 2019 – 2027
9.2.2. Large
Enterprises
9.2.2.1. Definition
9.2.2.2. Market Penetration, 2018
9.2.2.3. Market Estimation, 2013 – 2018
9.2.2.4. Market Forecast, 2019 – 2027
9.2.2.5. Compound Annual Growth Rate (CAGR)
9.2.2.6. Regional Bifurcation
9.2.2.6.1. West
9.2.2.6.1.1. Market
Estimation, 2013 – 2018
9.2.2.6.1.2. Market
Forecast, 2019 – 2027
9.2.2.6.2. Southwest
9.2.2.6.2.1. Market
Estimation, 2013 – 2018
9.2.2.6.2.2. Market
Forecast, 2019 – 2027
9.2.2.6.3. Northeast
9.2.2.6.3.1. Market
Estimation, 2013 – 2018
9.2.2.6.3.2. Market
Forecast, 2019 – 2027
9.2.2.6.4. Southeast
9.2.2.6.4.1. Market
Estimation, 2013 – 2018
9.2.2.6.4.2. Market
Forecast, 2019 – 2027
9.2.2.6.5. Midwest
9.2.2.6.5.1. Market
Estimation, 2013 – 2018
9.2.2.6.5.2. Market
Forecast, 2019 – 2027
9.3. Key
Segment for Channeling Investments
9.3.1. By
Organization Size
10.
United States Visitor
Identification Software Market Analysis and Forecasts, 2019 – 2027
10.1. Overview
10.2. United
States Visitor Identification Software Market Revenue (US$ Mn) and Forecasts, By Industry Verticals
10.2.1. Banking
Financial Services and Insurances
10.2.1.1. Definition
10.2.1.2. Market Penetration, 2018
10.2.1.3. Market Estimation, 2013 – 2018
10.2.1.4. Market Forecast, 2019 – 2027
10.2.1.5. Compound Annual Growth Rate (CAGR)
10.2.1.6. Regional Bifurcation
10.2.1.6.1. West
10.2.1.6.1.1. Market
Estimation, 2013 – 2018
10.2.1.6.1.2. Market
Forecast, 2019 – 2027
10.2.1.6.2. Southwest
10.2.1.6.2.1. Market
Estimation, 2013 – 2018
10.2.1.6.2.2. Market
Forecast, 2019 – 2027
10.2.1.6.3. Northeast
10.2.1.6.3.1. Market
Estimation, 2013 – 2018
10.2.1.6.3.2. Market
Forecast, 2019 – 2027
10.2.1.6.4. Southeast
10.2.1.6.4.1. Market
Estimation, 2013 – 2018
10.2.1.6.4.2. Market
Forecast, 2019 – 2027
10.2.1.6.5. Midwest
10.2.1.6.5.1. Market
Estimation, 2013 – 2018
10.2.1.6.5.2. Market
Forecast, 2019 – 2027
10.2.2. IT and
Telecom
10.2.2.1. Definition
10.2.2.2. Market Penetration, 2018
10.2.2.3. Market Estimation, 2013 – 2018
10.2.2.4. Market Forecast, 2019 – 2027
10.2.2.5. Compound Annual Growth Rate (CAGR)
10.2.2.6. Regional Bifurcation
10.2.2.6.1. West
10.2.2.6.1.1. Market
Estimation, 2013 – 2018
10.2.2.6.1.2. Market
Forecast, 2019 – 2027
10.2.2.6.2. Southwest
10.2.2.6.2.1. Market
Estimation, 2013 – 2018
10.2.2.6.2.2. Market
Forecast, 2019 – 2027
10.2.2.6.3. Northeast
10.2.2.6.3.1. Market
Estimation, 2013 – 2018
10.2.2.6.3.2. Market
Forecast, 2019 – 2027
10.2.2.6.4. Southeast
10.2.2.6.4.1. Market
Estimation, 2013 – 2018
10.2.2.6.4.2. Market
Forecast, 2019 – 2027
10.2.2.6.5. Midwest
10.2.2.6.5.1. Market
Estimation, 2013 – 2018
10.2.2.6.5.2. Market
Forecast, 2019 – 2027
10.2.3. Consumer
Durables and Electronics
10.2.3.1. Definition
10.2.3.2. Market Penetration, 2018
10.2.3.3. Market Estimation, 2013 – 2018
10.2.3.4. Market Forecast, 2019 – 2027
10.2.3.5. Compound Annual Growth Rate (CAGR)
10.2.3.6. Regional Bifurcation
10.2.3.6.1. West
10.2.3.6.1.1. Market
Estimation, 2013 – 2018
10.2.3.6.1.2. Market
Forecast, 2019 – 2027
10.2.3.6.2. Southwest
10.2.3.6.2.1. Market
Estimation, 2013 – 2018
10.2.3.6.2.2. Market
Forecast, 2019 – 2027
10.2.3.6.3. Northeast
10.2.3.6.3.1. Market
Estimation, 2013 – 2018
10.2.3.6.3.2. Market
Forecast, 2019 – 2027
10.2.3.6.4. Southeast
10.2.3.6.4.1. Market
Estimation, 2013 – 2018
10.2.3.6.4.2. Market
Forecast, 2019 – 2027
10.2.3.6.5. Midwest
10.2.3.6.5.1. Market
Estimation, 2013 – 2018
10.2.3.6.5.2. Market
Forecast, 2019 – 2027
10.2.4. Travel
and Hospitality
10.2.4.1. Definition
10.2.4.2. Market Penetration, 2018
10.2.4.3. Market Estimation, 2013 – 2018
10.2.4.4. Market Forecast, 2019 – 2027
10.2.4.5. Compound Annual Growth Rate (CAGR)
10.2.4.6. Regional Bifurcation
10.2.4.6.1. West
10.2.4.6.1.1. Market
Estimation, 2013 – 2018
10.2.4.6.1.2. Market
Forecast, 2019 – 2027
10.2.4.6.2. Southwest
10.2.4.6.2.1. Market
Estimation, 2013 – 2018
10.2.4.6.2.2. Market
Forecast, 2019 – 2027
10.2.4.6.3. Northeast
10.2.4.6.3.1. Market
Estimation, 2013 – 2018
10.2.4.6.3.2. Market
Forecast, 2019 – 2027
10.2.4.6.4. Southeast
10.2.4.6.4.1. Market
Estimation, 2013 – 2018
10.2.4.6.4.2. Market
Forecast, 2019 – 2027
10.2.4.6.5. Midwest
10.2.4.6.5.1. Market
Estimation, 2013 – 2018
10.2.4.6.5.2. Market
Forecast, 2019 – 2027
10.2.5. Automotive
10.2.5.1. Definition
10.2.5.2. Market Penetration, 2018
10.2.5.3. Market Estimation, 2013 – 2018
10.2.5.4. Market Forecast, 2019 – 2027
10.2.5.5. Compound Annual Growth Rate (CAGR)
10.2.5.6. Regional Bifurcation
10.2.5.6.1. West
10.2.5.6.1.1. Market
Estimation, 2013 – 2018
10.2.5.6.1.2. Market
Forecast, 2019 – 2027
10.2.5.6.2. Southwest
10.2.5.6.2.1. Market
Estimation, 2013 – 2018
10.2.5.6.2.2. Market
Forecast, 2019 – 2027
10.2.5.6.3. Northeast
10.2.5.6.3.1. Market
Estimation, 2013 – 2018
10.2.5.6.3.2. Market
Forecast, 2019 – 2027
10.2.5.6.4. Southeast
10.2.5.6.4.1. Market
Estimation, 2013 – 2018
10.2.5.6.4.2. Market
Forecast, 2019 – 2027
10.2.5.6.5. Midwest
10.2.5.6.5.1. Market
Estimation, 2013 – 2018
10.2.5.6.5.2. Market
Forecast, 2019 – 2027
10.2.6. Others
10.2.6.1. Definition
10.2.6.2. Market Penetration, 2018
10.2.6.3. Market Estimation, 2013 – 2018
10.2.6.4. Market Forecast, 2019 – 2027
10.2.6.5. Compound Annual Growth Rate (CAGR)
10.2.6.6. Regional Bifurcation
10.2.6.6.1. West
10.2.6.6.1.1. Market
Estimation, 2013 – 2018
10.2.6.6.1.2. Market
Forecast, 2019 – 2027
10.2.6.6.2. Southwest
10.2.6.6.2.1. Market
Estimation, 2013 – 2018
10.2.6.6.2.2. Market
Forecast, 2019 – 2027
10.2.6.6.3. Northeast
10.2.6.6.3.1. Market
Estimation, 2013 – 2018
10.2.6.6.3.2. Market
Forecast, 2019 – 2027
10.2.6.6.4. Southeast
10.2.6.6.4.1. Market
Estimation, 2013 – 2018
10.2.6.6.4.2. Market
Forecast, 2019 – 2027
10.2.6.6.5. Midwest
10.2.6.6.5.1. Market
Estimation, 2013 – 2018
10.2.6.6.5.2. Market
Forecast, 2019 – 2027
10.3. Key
Segment for Channeling Investments
10.3.1. By
Industry Verticals
11.
United States Visitor
Identification Software Market Analysis and Forecasts, 2019 – 2027
11.1. Overview
11.2. United
States Visitor Identification Software Market Revenue (US$ Mn) and Forecasts By
Region
11.2.1. West
11.2.1.1. West Visitor Identification Software Market Revenue (US$ Mn)
and Forecasts, By Pricing Model
11.2.1.1.1. Fixed Pricing
11.2.1.1.2. Variable Pricing
11.2.1.2. West Visitor Identification Software Market Revenue (US$ Mn)
and Forecasts, By Organization Size
11.2.1.2.1. Small and Medium Sized Enterprises
11.2.1.2.2. Large Enterprises
11.2.1.3. West Visitor Identification Software Market Revenue (US$ Mn)
and Forecasts, By Industry Verticals
11.2.1.3.1. Banking Financial Services and Insurances
11.2.1.3.2. IT and Telecom
11.2.1.3.3. Consumer Durables and Electronics
11.2.1.3.4. Travel and Hospitality
11.2.1.3.5. Automotive
11.2.1.3.6. Others
11.2.2. Southwest
11.2.2.1. Southwest Visitor Identification Software Market Revenue (US$
Mn) and Forecasts, By Pricing Model
11.2.2.1.1. Fixed Pricing
11.2.2.1.2. Variable Pricing
11.2.2.2. Southwest Visitor Identification Software Market Revenue (US$
Mn) and Forecasts, By Organization Size
11.2.2.2.1. Small and Medium Sized Enterprises
11.2.2.2.2. Large Enterprises
11.2.2.3. Southwest Visitor Identification Software Market Revenue (US$
Mn) and Forecasts, By Industry Verticals
11.2.2.3.1. Banking Financial Services and Insurances
11.2.2.3.2. IT and Telecom
11.2.2.3.3. Consumer Durables and Electronics
11.2.2.3.4. Travel and Hospitality
11.2.2.3.5. Automotive
11.2.2.3.6. Others
11.2.3. Northeast
11.2.3.1. Northeast Visitor Identification Software Market Revenue (US$
Mn) and Forecasts, By Pricing Model
11.2.3.1.1. Fixed Pricing
11.2.3.1.2. Variable Pricing
11.2.3.2. Northeast Visitor Identification Software Market Revenue (US$
Mn) and Forecasts, By Organization Size
11.2.3.2.1. Small and Medium Sized Enterprises
11.2.3.2.2. Large Enterprises
11.2.3.3. Northeast Visitor Identification Software Market Revenue (US$
Mn) and Forecasts, By Industry Verticals
11.2.3.3.1. Banking Financial Services and Insurances
11.2.3.3.2. IT and Telecom
11.2.3.3.3. Consumer Durables and Electronics
11.2.3.3.4. Travel and Hospitality
11.2.3.3.5. Automotive
11.2.3.3.6. Others
11.2.4. Southeast
11.2.4.1. Southeast Visitor Identification Software Market Revenue (US$
Mn) and Forecasts, By Pricing Model
11.2.4.1.1. Fixed Pricing
11.2.4.1.2. Variable Pricing
11.2.4.2. Southeast Visitor Identification Software Market Revenue (US$
Mn) and Forecasts, By Organization Size
11.2.4.2.1. Small and Medium Sized Enterprises
11.2.4.2.2. Large Enterprises
11.2.4.3. Southeast Visitor Identification Software Market Revenue (US$
Mn) and Forecasts, By Industry Verticals
11.2.4.3.1. Banking Financial Services and Insurances
11.2.4.3.2. IT and Telecom
11.2.4.3.3. Consumer Durables and Electronics
11.2.4.3.4. Travel and Hospitality
11.2.4.3.5. Automotive
11.2.4.3.6. Others
11.2.5. Midwest
11.2.5.1. Midwest Visitor Identification Software Market Revenue (US$
Mn) and Forecasts, By Pricing Model
11.2.5.1.1. Fixed Pricing
11.2.5.1.2. Variable Pricing
11.2.5.2. Midwest Visitor Identification Software Market Revenue (US$
Mn) and Forecasts, By Organization Size
11.2.5.2.1. Small and Medium Sized Enterprises
11.2.5.2.2. Large Enterprises
11.2.5.3. Midwest Visitor Identification Software Market Revenue (US$
Mn) and Forecasts, By Industry Verticals
11.2.5.3.1. Banking Financial Services and Insurances
11.2.5.3.2. IT and Telecom
11.2.5.3.3. Consumer Durables and Electronics
11.2.5.3.4. Travel and Hospitality
11.2.5.3.5. Automotive
11.2.5.3.6. Others
12.
Competitive Benchmarking
12.1. Brand
Benchmarking
12.2. Market
Share Analysis, 2018
12.3. United
States Presence and Growth Strategies
12.3.1. Mergers
and Acquisitions
12.3.2. Product
Launches
12.3.3. Investments
Trends
12.3.4. R&D
Initiatives
13.
Player Profiles
13.1. Act-On
Software, Inc.
13.1.1. Company
Details
13.1.2. Company
Overview
13.1.3. Product
Offerings
13.1.4. Key
Developments
13.1.5. Financial
Analysis
13.1.6. SWOT
Analysis
13.1.7. Business
Strategies
13.2. Clearbit
13.2.1. Company
Details
13.2.2. Company
Overview
13.2.3. Product
Offerings
13.2.4. Key
Developments
13.2.5. Financial
Analysis
13.2.6. SWOT
Analysis
13.2.7. Business
Strategies
13.3. KickFire
13.3.1. Company
Details
13.3.2. Company
Overview
13.3.3. Product
Offerings
13.3.4. Key
Developments
13.3.5. Financial
Analysis
13.3.6. SWOT
Analysis
13.3.7. Business
Strategies
13.4. Lead
Forensics
13.4.1. Company
Details
13.4.2. Company
Overview
13.4.3. Product
Offerings
13.4.4. Key Developments
13.4.5. Financial
Analysis
13.4.6. SWOT
Analysis
13.4.7. Business
Strategies
13.5. Liidio Oy
(leadfeeder)
13.5.1. Company
Details
13.5.2. Company
Overview
13.5.3. Product
Offerings
13.5.4. Key
Developments
13.5.5. Financial
Analysis
13.5.6. SWOT
Analysis
13.5.7. Business
Strategies
13.6. netFactor
(bombora)
13.6.1. Company
Details
13.6.2. Company
Overview
13.6.3. Product
Offerings
13.6.4. Key
Developments
13.6.5. Financial
Analysis
13.6.6. SWOT
Analysis
13.6.7. Business
Strategies
13.7. SHARPSPRING
13.7.1. Company
Details
13.7.2. Company
Overview
13.7.3. Product
Offerings
13.7.4. Key
Developments
13.7.5. Financial
Analysis
13.7.6. SWOT
Analysis
13.7.7. Business
Strategies
13.8. Upland
Software, Inc.
13.8.1. Company
Details
13.8.2. Company
Overview
13.8.3. Product
Offerings
13.8.4. Key
Developments
13.8.5. Financial
Analysis
13.8.6. SWOT
Analysis
13.8.7. Business
Strategies
13.9. Zoho
Corporation Pvt. Ltd.
13.9.1. Company
Details
13.9.2. Company
Overview
13.9.3. Product
Offerings
13.9.4. Key
Developments
13.9.5. Financial
Analysis
13.9.6. SWOT
Analysis
13.9.7. Business
Strategies
13.10. Other
Market Participants
14. Key Findings
Note: This
ToC is tentative and can be changed according to the research study conducted
during the course of report completion.
**Exclusive for Multi-User and
Enterprise User.
At Absolute Markets Insights, we are engaged in building both global as well as country specific reports. As a result, the approach taken for deriving the estimation and forecast for a specific country is a bit unique and different in comparison to the global research studies. In this case, we not only study the concerned market factors & trends prevailing in a particular country (from secondary research) but we also tend to calculate the actual market size & forecast from the revenue generated from the market participants involved in manufacturing or distributing the any concerned product. These companies can also be service providers. For analyzing any country specifically, we do consider the growth factors prevailing under the states/cities/county for the same. For instance, if we are analyzing an industry specific to United States, we primarily need to study about the states present under the same(where the product/service has the highest growth). Similar analysis will be followed by other countries. Our scope of the report changes with different markets.
Our research study is mainly implement through a mix of both secondary and primary research. Various sources such as industry magazines, trade journals, and government websites and trade associations are reviewed for gathering precise data. Primary interviews are conducted to validate the market size derived from secondary research. Industry experts, major manufacturers and distributors are contacted for further validation purpose on the current market penetration and growth trends.
Prominent participants in our primary research process include:
- Key Opinion Leaders namely the CEOs, CSOs, VPs, purchasing managers, amongst others
- Research and development participants, distributors/suppliers and subject matter experts
Secondary Research includes data extracted from paid data sources:
- Reuters
- Factiva
- Bloomberg
- One Source
- Hoovers
Research Methodology

Key Inclusions


